PBI or Party Brand Index is a concept I developed (with some much appreciated help from pl515) as a replacement for PVI. PVI (Partisan Voting Index), which is measured by averaging the percentage of the vote from the last two presidential elections in each house district, and comparing it to the nation as a whole, is a useful shorthand for understanding the liberal v. conservative dynamics of a district. But PVI in my opinion it falls short in a number of areas. First it doesn’t explain states like Arkansas or West Virginia. These states have districts who’s PVIs indicates a Democrat shouldn’t win, yet Democrats (outside of the presidency) win quite handily. Secondly why is this the case in Arkansas but not Oklahoma with similar PVI rated districts?
Lastly PVI can miss trends as it takes 4 years to readjust. The purpose of Party Brand Index is to give a better idea of how a candidate does not relative to how the presidential candidate did, but compared to how their generic PARTY should be expected to perform. I’ve tackled IN, NC, CO, VA, MO, OK, AR, WV, NH, OH, and Florida. Now I will look at the fast becoming a purple state of Arizona
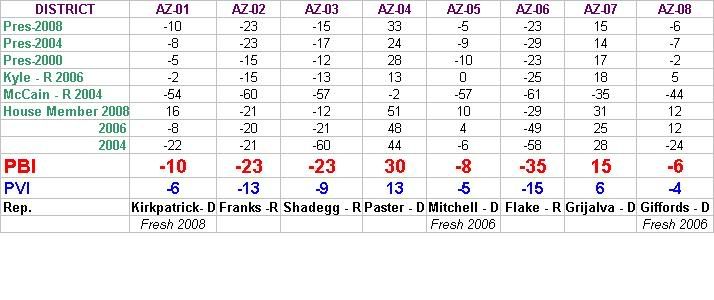
Like always I would like to post the data, then I will offer some analysis. My basic pattern is to work my way “out” from the “Purple States” to the more Blue and Red ones. (Although once in a while I like to skip my normal pattern of working out from purple states. I’m often curious on how my model would work in states like that are deeply blue at the local level, but deeply red at the presidential level.) As a reminder a negative number indicates a Republican bias to a district, while a positive number indicates a Democratic bias.
Let’s examine the fast becoming a purple state of Arizona.
ANALYSIS
Arizona’s number are masking some trends. John McCain was basically unchallenged in 2004, his large victory margin has skewed the numbers in most districts PBI by about 2-3 points. Also there are a number of other trends working in team blue’s favor.
47% of Arizona’s voters had a college education. Obama carried all 14 states (and DC) that had higher college educated electorates. In fact of the 23 states plus DC that were over 44% Obama carried everyone except Arizona, North Dakota, and Texas.
Latinos grew from 12% to 16% of the electorate, but Obama had one of the smallest increases in their support levels of any state. They supported Kerry over Bush in 2004 at 56% to 43%, Obama was at 57% to 41%. Consider this a home state advantage.
The biggest obstacle to a Democratic victory in the future is the party registration numbers. Republicans outnumber Democrats by about 7% state wide, Obama only carried one state where Republicans outnumber Democrats (Indiana). Since GOP voters tend to be more partisan than Democrats (they almost always vote at higher rates for the GOP candidate than Democrats do for the Dem) this lead to a major obstacle. In many ways this is the mirror image of the GOP’s problems in New Jersey. Every 4 years looking at NJ demographics they decide to target it, but the huge Democratic registration edge makes it their “Great White Whale.”
Ideologically Obama won 6 states that were less liberal than Arizona (based on the percentage of self describe liberals) including Colorado, Florida, North Carolina, and Ohio. Colorado had a 17% liberal, 46% moderate, 36% conservative breakdown, Arizona’s numbers are 21% liberal, 42% moderate, 36% conservative. Arizona’s numbers fall roughly in the middle of the average swing state. * the demographic information cited above comes from Chuck Todds’ book “How Obama Won”
My best advice to the party would be to focus on party building in Arizona. Get more people registered at Democrats. Focus party building on the young people moving into Arizona’s college towns. This is in addition to the obvious tactic of getting Latinos to register and vote at higher rates.
One final note, as I alluded to earlier, after I come across a few “conservative” Democrats, I run a “correction” factor to account for them being Blue Dogs. The general idea is that the distance they are able to maintain from the national party may help them win over voters who are more reluctant to vote for Democrats. I want to examine another swing state before I “recompute” Ohio’s and Florida’s (my last two states) Blue Dogs.
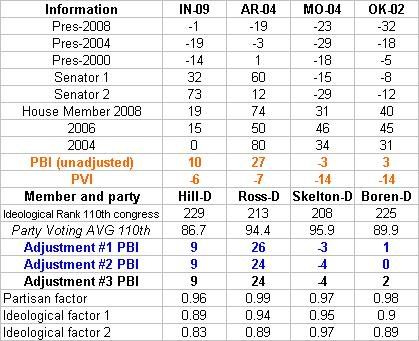
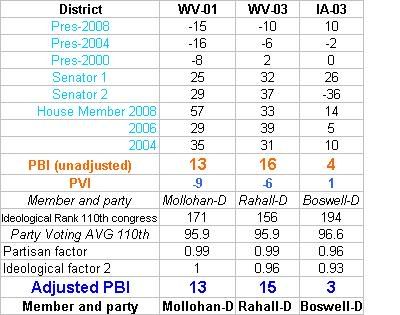
As a recap, here are the first “batch” of Blue Dogs, and rural Democrats (West Virginia’s Democrats aren’t members of the Blue Dogs) that I examined correcting for partisanship and ideology.
FOUR BLUE DOGS
THREE BLUE DOGS
As a reminder ranking a members ideology is a somewhat subjective decision. Potentially what’s one person “liberal” position, is another person “conservative” ones, remember the wingers developed a model that ranked the Sen. Obama as more liberal than Bernie Sanders or Russ Feingold. But partisanship, how often a member votes with their party is an absolute number. A Democrat who represents a “republican district” would be expected to “break with their party” on votes that don’t reflect their districts values.
I couldn’t find a website that ranks all the districts based on their PVI (I only could find list of them by state not rank, help please anyone), therefor I substituted a PVI ranking with where each member ranked in the Democratic caucus. In the 110th Congress the average Democrat had an ideological ranking of 170 (by the way this is a result of several members being tied, this is the medium not the midpoint). The average of members towards the center was 191, former Daily Kos celeb Ciro Rodriguez fell at exactly 191. The average of members towards the liberal side was 121, which falls between Rep. Larson of Conn. and Rep. Eshoo of CA. As or partisanship in the 110th Congress the average Democrat voted with their party 92.3% of the time.
As a clarification in Adjustment #1, I used a deviation factor based on how far each member was from the center of the Democratic caucus. Adjustment #2 was based on how far each member was from outside the standard deviation of the caucus. In Adjustment #3 I removed the partisanship factor to see what effect it would have. As I explained a few diaries ago I will use ADJUSTMENT FACTOR 2 in all subsequent corrections.
Because there are “only” 50 states (as opposed to evaluating 435 house members), I will at a later date have all the states ranked by PVI so I can adjust the Senator’s rankings. I developed Senate factors for the four states the four blue dogs came from. In the interest of full disclosure, my source for ideological rankings is Voteview, and for partisanship it was the Washington Post. This is still a work in progress, I’m making adjustments, and continuing to crunch numbers for more states. I also will use the adjustment factor on a liberal member of congress to see what effect that will have.
Anthology:
PBI (Party Brand Index) Part 8 Florida
PBI (Party Brand Index) Part 7 Ohio
PBI (Party Brand Index) Part 6 WV and NH
PBI (Party Brand Index) Part 5 Nevada and Iowa
Party Brand Index (part 3) North Carolina
I just found your postings on PBI and I’m very impressed by all the work you’ve put into it! And I’m especially happy to see you start with my home state of Indiana! I’m still reading through the details of your system, but I appreciate the work you’ve put into it so far.