This is the second part of a series of posts analyzing the swing state Pennsylvania. The next part can be found here.
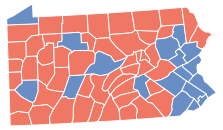
Like Florida, and unlike Ohio, Pennsylvania’s political geography can be divided into three. The industrial southwest is reddening, the populous southeast is bluing, and Pennsyltucky remains, as James Carville memorably described it, “Alabama without the blacks.” (Actually, Pennsyltucky is a fair bit less conservative.)
The following section will concentrate on Philadelphia, the region upon which Democrats draw the most votes.
Philadelphia the City
Although cities always vote Democratic, different cities contain different political characteristics. Not all big cities are liberal (see Houston, Phoenix), nor are all liberal cities are big (see San Francisco, Boulder).
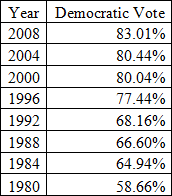
Fortunately for Democrats, Philadelphia is both America’s sixth largest city and one in which four out of five inhabitants regularly choose the Democrat. It is, moreover, a city which has become bluer for eight straight elections.
(A note: All my statistics are taken from http://www.uselectionatlas.org/)
More below.
Philadelphia’s decades-long movement towards Democrats has corresponded with six decades of population decline; white flight has gradually weeded out Republican voters. Machine politics – characterized by such practices as street money – continues to play a major role in elections.
Demographics underlie Democratic strength in the city (as they do throughout American cities). A full 44.8% of the city’s population is black, a heavily Democratic voting bloc. Latinos (another Democratic voting bloc), while fewer than elsewhere, comprise a solid 11.8% of Philadelphia.
A large majority of Philadelphia’s white voters must vote Democratic, too. In 2008 Obama took 83% of the vote, in a city whose non-Hispanic white population was 39.0% according to the census. Assuming minority turn-out proportional to their actual population, and assuming every single non-white person voted Democratic, then at a minimum, 56.4% of Philadelphia whites supported Obama. Under a more realistic assumption (e.g. 90% non-whites voting Democratic), 72.08% of Philadelphia whites would be supporting Obama. (The equation to get this is simple: 83.01 = 0.90*61.00 + x*39.00).
Philadelphia’s white vote revolves around two factors: liberal whites moving in through gentrification, and long-standing white ethnic communities. The former voting group – often young, single, and gay or gay-friendly – is liberal by orientation; the latter group, a consequence of long-gone anti-Catholic sentiment, still votes Democratic on economic issues but is slowly treading Republican.
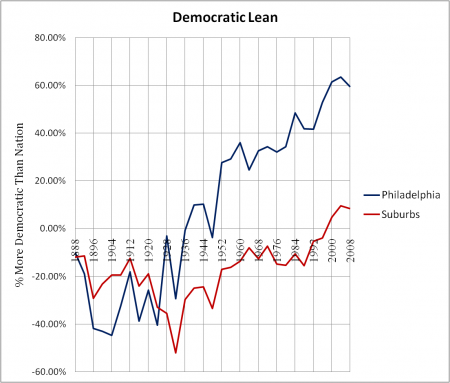
All in all, Philadelphia’s existence constitutes an enormous advantage for Democrats. For the past three presidential elections, it has been around 60% more Democratic than the nation as a whole. If George W. Bush had won 80% of the vote in 2008 (and John Kerry had won 20% of the vote), he still would have lost Philadelphia by 3.60%. That is a shocking (and sad) statistic. As long as Republicans keep on losing the city by 4-1 margins, they’ll have a very difficult time winning Pennsylvania as a whole.
Finally, notice how – for the first time in history – Philadelphia’s suburbs now lean Democratic. That shift, which I will cover next, should disturb even the most confident Republican.
–Inoljt, http://mypolitikal.com/


A question:
How big is the Asian population in Philadelphia, and what is known about their voting history?
It will probably get bluer yet again in 2012.
As he did almost everwhere, Carter ran worse in Philadelphia in 1980 than he had in 1976. So the increase in Democratic percentage for President starts in 1984, and covers seven consecutive elections.
I look forward to reading the rest of your articles on Pennsylvania, and I hope I’m not stepping on your story, but I noticed something interesting in looking at my own file.
That Democratic movement since 1980 which you have documented extends over the 4-county area of southeast Pennsylvania, taken as a whole. In Philadelphia, Montgomery, Delaware, and Bucks County, the Democratic share of the major-party vote for President (including Nader in 2000 and Perot in 1996 and 1992) was 46.4% in 1980, 51.1% in 1984, 52.6% in 1988, 53.5% in 1992, 61.1% in 1996, 64.1% in 2000, 65.2% in 2004, and 68.8% in 2008.
And, as in Philadelphia, the Democratic share has increased in every presidential election in each of the other three counties. Mondale got 35.5% in Montgomery County; Obama got 60.5%. In Bucks County it moved from 36.4% in 1984 to 54.4% in 2008. And in Delaware County it moved from 37.8% to 60.8%. As recently as 1988, Dukakis could not crack 40% in any of those three counties.
That’s interesting, in case some people might expect that the suburbs are growing more Republican as Republicans leave the inner city.
This is one place where the Southernization of the Republican Party is not paying off. These 4 counties cast 29.6% of the statewide vote in 2008. By getting 68.8% there, Obama needed only 42% from the rest of the state (including Pittsburgh) to win.