An 9-5 Democratic map probably. I will quickly give a rundown of the districts followed by a few maps of the districts.
District 1 (blue): 46% black and 45% white, probably John Lewis territory more than anyone else but man would the folks in Paulding and Bartow counties be pissed to be in a district with the west side of ATL. Probably the most ridiculous district.
District 2 (green): 45 percent white and 44 percent black, amazing considering how all the black population is concentrated in a chunk of Fulton and a sliver of Clayton. David Scott would probably run here.
District 3 (purple): 48% white and 42% black, Clayton and east Dekalb make this a Democratic district probably. I have no idea what Democrat would run though.
District 4 (red): 49 percent white, 39 percent black. Probably my favorite district. White percentage doesn’t necessarily represent GOP percentage because of Clarke county which is 60% white yet 60% Democratic. I think Hank Johnson would want this one or…
District 5 (yellow): Very diverse district, 40 percent white, 34 percent black, 17 percent Hispanic, 8 percent Asian. Similar to the 4th, white percentage includes liberal whites in east Fulton/ west central Dekalb. Another possibility for Hank Johnson?
District 6 (teal): 49% white, 25 percent black, 19% Hispanic, 6% Asian. Getting desperate here but this would no doubt be a Democratic district due to once again liberal whites in ATL plus the majority-minority status of the district. Have no idea who would represent this but definitely not Tom Price.
District 7 (gray): Finally a GOP seat in Metro ATL (6-1 delegation for Dems so far)! Tom Price and Phil Gingrey battle it out here for a 76 percent white, safe GOP district.
District 8 (periwinkle): I’m pretty sure I helped Jim Marshall out with this one stretching across Middle GA. 56% white, 39% black probably pretty close to 50-50 for Obama/McCain (7-1 Dems).
District 9 (light blue): Screwed up a little here but Barrow should be safe. 54% white, 40% black so less black than now. I was attempting to get a Democratic south east GA district by diluting Barrow’s district but you’ll see that’s not happening… (but we have a 8-1 Dem advantage).
District 10 (neon pink): 65% white and 28% black. Not quite good enough to elect a Democrat considering the hostility of SE GA whites towards Democrats (8-2 Democrats).
District 11 (yellow-green): pretty much the same as Sanford Bishop’s pre 2006 district. 52 percent white and 41 percent black I think a Democrat would be fine here (9-2 Democrats).
Districts 12-14: well the Republicans had to go somewhere… All these districts are between 75 to 82% white. I think the 12th would be Westmoreland’s, the 13th is similar to the open 9th and the 14th get’s rid of Paul Broun so hurray for that!
With the three additional GOP seats that brings me to a 9-5 Democratic advantage. Pretty unrealistic but entirely possible if not for the VRA guidelines. Honestly though I think this might expand black representation because of the additional metro ATL seats but I worry in a bad cycle the 11th and the 9th could be in danger for Democrats. Still even if those fell we’d be tied 7-7, gaining a seat.
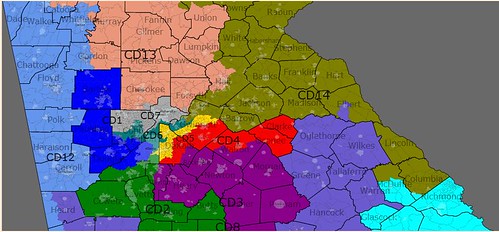
North GA:
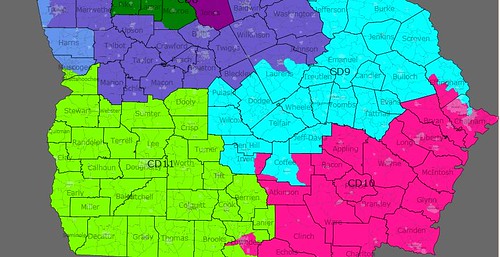
South GA:
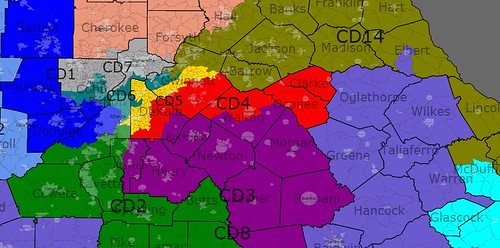
Middle GA:
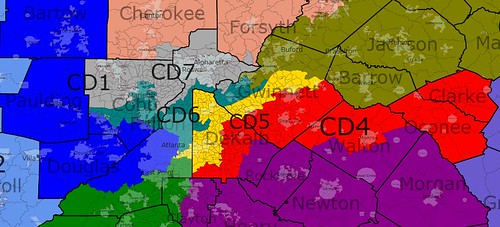
Metro ATL:
…I would love to have John Lewis as my representative.
is VRA good or bad for Democrats from pure electoral politics perspective? For me the answer is obvious.
on the basis of the 2004 or 2008 runoff votes?
Using your map, Marshall would be my Congressman again.
Thank you 🙂
http://swingstateproject.com/d…