There are a few scenarios which could give rise to this map. If control of redistricting is split, then I could see this as a compromise map. As you'll soon see, Mike Rogers' life gets easier while the Second District becomes solidly Democratic (albeit with Bobby Bright is serious trouble in the primary, assuming he's still around).
Even if Democrats have the redistricting trifecta, the fact that only one of the state's seven districts can be counted on to go Democratic and only one another saw Obama get more than 40% of the vote has got to be worrisome. So, a map such as this can also be seen as a Democratic gerrymander of sorts in that it makes two solidly Democratic districts.
I could even see this as a Republican map, especially if Bobby Bright survives. If that happens, they could concede the Second in return for shoring up their most vulnerable member: Mike Rogers.
Finally, this map could result from a decision by the courts or the Justice Department mandating that Alabama have another black-majority district. 2005 Census estimates put Alabama at 26.7% black. That amounts to just under two districts, and considering that adding another majority black district to Alabama is fairly easy as the heavily black areas tend to be clustered or at least fairly close to each other.

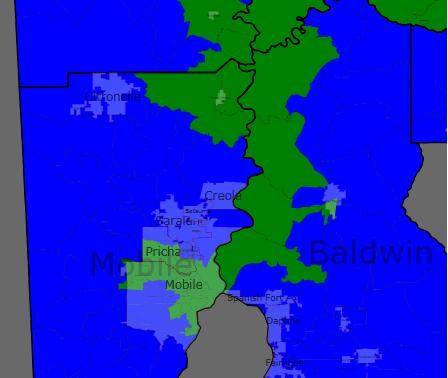
First District (Blue)
Old District: 67.8% white | 28% black
Old Demographics: 82% white | 13% black
New Demographics: 81% white | 13% black
The First exchanges heavily black areas in Mobile for rural, white areas along the Florida border. The net result is a significantly whiter and probably more Republican district, as if Jo Bonner needed it.
Second District (Green)
Old District: 67% white | 29% black
Old Demographics: 44% white | 53% black
New Demographics: 41% white | 55% black
Previous attempts to move the black areas of Mobile to the Seventh District and move extra black areas from the Seventh to the Second were unsuccessful as it left the First and Second underpopulated with nowhere to gain that wouldn’t negate the whole purpose. But moving this area into the Second does work. The Second also picks up heavily black areas from the Seventh and Third and loses whiter areas to the First and Third. As a result, the district is now majority black and, I would assume, pretty solidly Democratic. Bobby Bright would likely have trouble in the primary, though.
Third District (Purple)
Old District: 65% white | 32% black
Old Demographics: 74% white | 22% black
New Demographics: 73% white | 23% black
Things get easier for Mike Rogers. Not only has the district been pushed northward out of the black belt (or at least the blackest parts of it), becoming almost three-quarters white, but Rogers' Democratic opponent Josh Segall is now in the Second District.
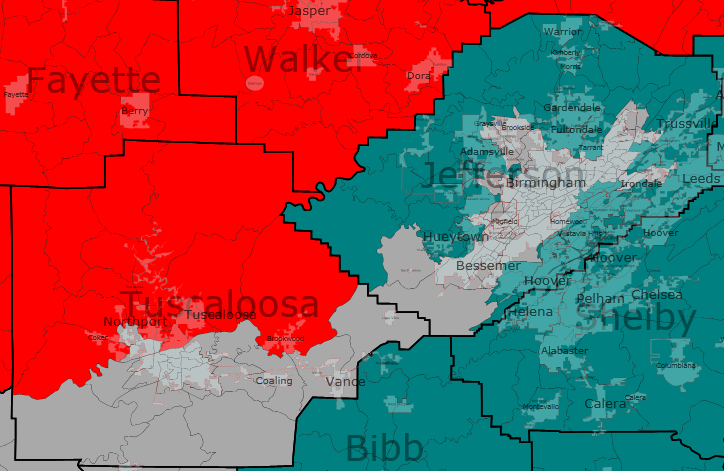
Fourth District (Red)
Old District: 90% white | 5% black
Old Demographics: 90% white | 6% black
New Demographics: 88% white | 6% black
The Fourth remains Alabama's whitest and least diverse districts. I tried to make it a heavily rural district, which you may can see in its loss of Fort Payne and Gadsden. That effort may have been futile as I had to put Florence and parts of Tuscaloosa in the district. I would be shocked if Rob Aderholt had any problems here.
Fifth District (Yellow)
Old District: 78% white | 17% black
Old Demographics: 79% white | 15% black
New Demographics: 76% white | 16% black
With this one, I tried to make it more urban (or at least less rural) as well as concentrate the military interests in one district. The new Fifth picks of Decatur and Fort Payne, among other areas, and sheds some more rural areas.
Sixth District (Teal)
Old District: 89% white | 8% black
Old Demographics: 88% white | 8% black
New Demographics: 85% white | 10% black
With the loss of Tuscaloosa County, the Sixth loses much of its former serpentine shape. With the addition of Autauga County, the district becomes more of a Birmingham to Montgomery district.
Seventh District (Gray)
Old District: 36% white | 62% black
Old Demographics: 37% white | 60% black
New Demographics: 35% white | 61% black
Not a whole lot has changed here. It loses some of Clarke County, giving the district a more compact look, as well as parts of Pickens and Wilcox Counties. In return, it gains some Birmingham-area precincts. The story is still the same: heavily black and solidly Democratic.
I played around the application a little bit, and could get the two black-majority districts, but yours look much more plausible and less gerrymandered than anything I came up with. I’m sure as you found out, the hard part was linking the black parts of Mobile to Montgomery County.
I’d take this map any day — the reality is that we took a shot or two at Mike Rogers in a good Democratic year with a good candidate, and didn’t come all that close.
It could contribute a few counties to the second so you don’t have that weird tentacle into Mobile.
I think it’s very very well done, and for a VRA map in the South is pretty damn compact!
Alabama will never elect a white Democrat to Congress again.
I like it a lot
The only way something like it won’t be enacted is if Bright loses in 2010. In that case the new incumbent Rethug will be protected.
What’s the difference between “Old District” and “Old Demographics”?
without using Photobucket? I don’t like photobucket if there is any other way to post pictures to diaries I would like to use it.
Right now i foresee exactly one Southern state, where Democrats will fully control redistricting in 2010-12 – it’s Arkansas. And i am not sure that there will be more 10 years from now. So – ….
I’ve tried my hand at Alabama before, using the principle that a 2-1 Republican controlled process would probably result in a compromise (Bright gets a safer district in exchange for Rogers getting a totally safe district). My problem was the SE corner, easily one of the most conservative parts of the state, which I couldn’t figure out how to get out of Bright’s district. Drawing the black parts of Mobile into the 2nd and putting SE into the 1st works great, in a headslap “seems pretty obvious to me now” sort of way.
Of course, I’m assuming that Bright survives in 2010, the Republican (I forget his name) gets elected over Sparks, and the AL House stays fairly solidly Democratic.
Bright can run for the Senate against Sessions in 2014.
First off, let me just say as someone who’s done my share of Alabama maps that yours is probably cleaner than I ever imagined a 2 VRA-seat map could be. Seriously, it seems…elegant, somehow. Which brings me to my first quibble: this map is not nearly gerrymandered enough! 🙂 The VRA basically gives you free rein to gerrymander–heck, it even encourages it!
One problem I did have with your map: do you realize the extent to which you turned the 5th from a marginal district that could elect a white Blue Dog Democrat into one that probably wouldn’t? DeKalb & Morgan counties are more reliably Republican all the way down the ticket, while other parts of northern Alabama are much less so. Like, for example, the counties you removed… Colbert & Lauderdale. Griffith won both of them solidly in 2008. He got 14184 votes to Wayne Parker’s 10045 in Colbert and got 20068 votes to 17215 in Lauderdale. These counties are 16% and 10% black, respectively, btw, and Obama lost them massively.
Meanwhile, in DeKalb, Obama & our weak-sauce congressional candidate (Nick Sparks) were again losing by massive margins, like 17951-5654 and 16590-6669. The best any Democrat did here was Supreme Court Justice candidate Deborah Bell Paseur, who still lost by about 2,000 votes. Paseur, btw, got eerily similar margins to Griffith throughout the 5th in 2008 (except Lauderdale, Paseur’s home county, where she WAY overperformed).
In Morgan County, the way it’s currently designed, the voters in the 5th were basically evenly divided, with Griffith winning by about 150 votes out of 26700. The part of the county that’s in the 4th, however, saw Republican Aderholt win 17782-4456. And bellweather Deborah Bell Paseur did the best among down-ticketers again, but still lost by over 6,000 votes countywide.
In the current 5th, a Democrat won 52-48 in an open seat, a margin of roughly 9500 votes. Had Griffith run in your 5th, by my back-of-the-envelope calculations, he would’ve lost by about 5000-6000 votes. (-7000 for Colbert & Lauderdale,
2000 for DeKalb &6000 for the rest of Morgan)And while I know we all hate Parker Griffith (enjoying the Republican Party there, Parker?) …. there doesn’t seem to be much of a rationale for moving things around the way you did (Florence-Muscle Shoals is just as “urban” as Fort Payne) However, all this is easily remedied….just shift things back to the way they were, exchanging the relevant parts with the 4th. The population growth in the 5th is right on target to keep it the same size, anyway. …Wow, that was a long explanation for a minor point. At any rate, the rest of the map is very well done, methinks.