In just a few days California voters will make final decisions on redistricting that will either expand the public commission process, or eliminate it entirely. These competing ballot measures, Prop 20 and 27 respectively both have intensely waged campaigns with big bucks from conservative backers taking on incumbent legislators and congressional members.
The latest polling has Proposition 20 passing and 27 losing. But what will that do for the state’s congressional delegation?
Using Dave’s Redistricting App I was able to draw these lines based on the criteria for the commission. These include geographic compactness, maintaining city and county lines, working to preserve communities of interest. What this avoids is looking at where incumbents live (the commission can’t know) or trying to draw lines based on any partisanship or competitiveness goal (the commission can draw no line to advantage or disadvantage a party).
Dave’s App is a bit dated in terms of its population estimates, so using current data the urban districts would likely expand a bit and rural districts would likely shrink. This is only an approximation and presents some of the challenges if a commission were to handle the redraw.
The numbering is not relevant and can really serve to confuse. Often times I will hear from a legislator or congressman “my district 18 is going to pick up this city” but under the commission both the numbering and the communities in a district will be determined by scratch. This fallacy diminishes the extraordinary impact of California’s decision to go to a lay board for political redistricting and give them the rules/restrictions that we have.
For the purposes of reviewing this plan I am describing districts by their core city or county, and where there are arbitrary numbers I may reference them, but it is a waste to get caught up into a discussion of why the 11th is in Southern California… that doesn’t matter.
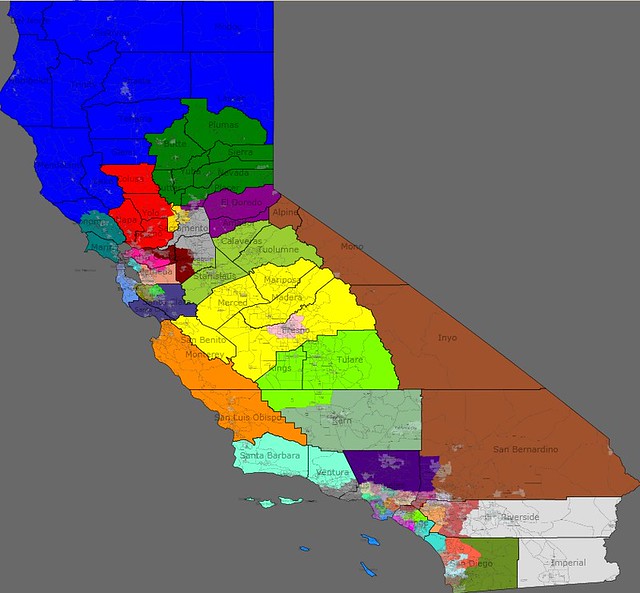
Statewide Map
Population Shifts
The biggest factor in redrawing California (either through the legislature, commission or courts) is the uneven growth between rural and urban communities. Growth statewide for the past 10 years has been approximately 10%, with 5% growth in San Francisco, 3.5% growth in Los Angeles, and 35% growth in Riverside (inland southern California). That means urban districts expand as they reach to gobble up 1/53rd of the state’s population, while rural districts contract for the same reason.
Boxed In
Aside from the obvious borders with Oregon, Nevada, Arizona and Mexico, plus a huge ocean, there are also two mountain ranges that provide some relatively impenetrable boundaries for map drawers. In this map the central coast is drawn vertically because it doesn’t make sense to cross mountain ranges. The central valley is more “boxy” then the high desert is again vertical and long to take in population. San Francisco is in a way the easiest part to draw because map makers can start with an assumption that they will not cross a body of water and county/city lines in order to merge two communities (Marin and San Francisco) that do not share a lot of interests. So, the Bay Area map is first constrained by this factor, and population within the city pushes districts southward.
The Channel
One of the most interesting parts of the state is the Central Valley, specifically San Joaquin County. If mapmakers were to start in San Joaquin they could easily draw one congressional seat that would take it’s 687,000 residents. But this is not possible when looking at the whole state.
As the Bay Area gets drawn there are leftover residents in Alameda and Contra Costa Counties, and as the Northern districts are drawn there has to be an outlet for those excess residents. San Joaquin is perfectly located at the confluence of these two streams, and as overflow comes down the entire central valley acts as a channel for districts that need to expand to gain required population.
Neatness
Overall the new congressional map is going to look neater. Districts will take on odd shapes where that is the underlying geography or county / city lines, but where two cities or counties are combined they are adjacent. Based on the new rules line drawers are not going to purposefully capture one community by going around or past another closer similar community.
This map gets the state’s 53 districts into sets of approximately 690,000 with a variation of +/- 2%. Getting them perfect using projected 2009 data seemed an unnecessary headache. When the 2010 census information becomes available the lines will be redrawn in real GIS software using the new data.
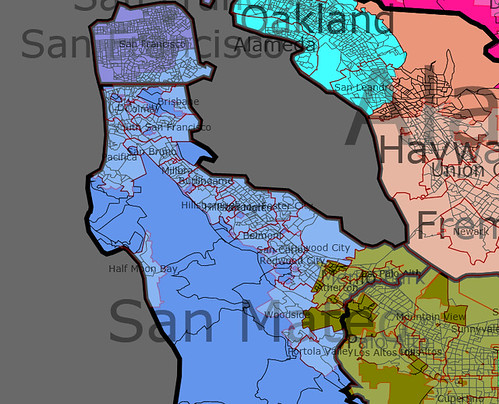
Bay Area Map
The Bay area begins in San Francisco, both figuratively and in this case literally. Lines for the legislature and congress have crossed bodies of water, but under the commission rules it is extremely unlikely that they would draw a congressional district that crossed either the Bay Bridge or Golden Gate. The political geography starts at the top of San Franciso and counts south until you run out of residents. In this map I have favored geographic compactness, placing the south eastern portion of San Francisco into the San Mateo district. Without any emphasis on drawing districts that are neat or compact the better choice would be to draw the San Francisco district as a crescent, with the south-eastern part of the city becoming part of the seat to the south.
The San Mateo seat would take in 90% of San Mateo – and depending on the final census this district could grow to take more of San Mateo.
Also seen in this picture are the Northern Santa Clara seat to include a number of smaller cities like Cupertino, Mountain View, Los Altos and Sunnyvayle. This district goes up to the border of San Jose but should be able to avoid crossing that city line.
The map also gives a peek at the Alameda seats – one that neatly places Oakland, the city of Alameda and Albany into one district, and Hayward, Fremont and Union City into another. The casualties in Alameda County are San Leandro that is nearly impossible to keep whole, and Dublin and Livermore that have to be shipped into a Contra Costa district. Keeping Alameda County together is impossible and Contra Costa became a pass thru for Alameda’s excess population.
Los Angeles Map
Los Angeles is a tough part of the state to draw. There are long simmering changes in the core of the city where African Americans are being displaced by Latinos, conservative pockets of voters in the South Bay and San Gabriel Valley, extremely liberal white voters in Santa Monica, a strong LGBT population in West Hollywood, and a San Fernando Valley community that has sought to secede from the city.
In addition to the principles of geographic compactness, preservation of city lines and traditional communities of interest, I have also followed some of the flow of the city as I understand it from living there most my life. In the end I found that freeways were a significant geographic factor – which is appropriate or poetic for Los Angeles, the birthplace of freeway commuters. There is a district along the 210 freeway, another along the 10, one that follows the 405.
I tried to avoid totally dividing the San Fernando valley, with an interest in treating it almost as if it was a city itself. However, this had significant negative consequences in other parts of the County. I may try to address this with different lines when new data is available.
South Bay and South LA districts
The driving factor in drawing the South Bay is Long Beach. The city of LB plus a portion of LA that comes into the port, Wilmington, Harbor City and part of San Pedro makes a strong district with shared interests and neat following of city lines.
After drawing these lines there are several obvious districts to follow. North/northeast of Long Beach is a strong Latino district (61% Latino) with small cities, to the North/northwest are is a traditionally African American base of Compton, Carson, Inglewood (30% African American), then to the west is a good coastal district.
Santa Monica is a major LA area city and there are two options for drawing its congressional seat. Mapmakers could take it up to Malibu and Ventura county based on a coastal community of interest, or it can draw the district into LA and absorb the strongly LGBT city of West Hollywood. I chose the latter option.
Downtown LA districts
The LA city districts are shaped by the contours of the LA basin and some spillover population needs from the neighboring districts. Both are over 60% Latino and the southern one is just 2% white. Just to the east of downtown is a district that brings together several small cities, including the now world famous city of Bell. This district is 87% Latino.
San Fernando Valley districts
This map gives the San Fernando valley two congressional seats, one of which takes in the City of Burbank that is not technically part of LA city’s San Fernando Valley, but is often considered a “Valley” community. Under this plan the Valley suffers from encroachment on all sides. If the plan was started in the San Fernando Valley three congressional districts could be drawn, but that could be at the expense of other parts of the city.
San Gabriel Valley
The San Gabriel Valley is drawn horizontally, following the 210 freeway and foothills from Glendale to Pasadena and other smaller communities, then continues along the same plane to reach into San Bernardino. Below the foothills there are districts that follow the 10 freeway and 60.

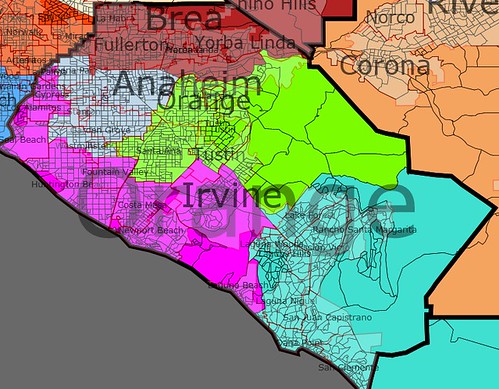
Orange County districts
The conservative base of California, Orange County has in the last 20 years grown a strong Latino community of Democratic voters in and around Santa Ana and an adjoining conservative base of Vietnamese voters in and around Garden Grove.
The district begins in the south with the encroachment from Northern San Diego county. This puts Laguna Niguel and southern Orange County in with Oceanside, following the 5 and 405 freeways and the new toll highway 73.
The coastal district brings in Huntington and Newport beaches, and reaches up to Cypress in an attempt to go inland without dividing a major portion of the Vietnamese community.
Inland Orange County has one district where Vietnamese will be an influence community, and another where Latinos will have a strong voice. The Northern Orange County district bleeds out into San Bernardino and toward the Ontario airport.
I am happy to answer questions about any other parts of the state and discuss the challenges facing the commission if they are charged with drawing congressional lines. Doing a from-scratch new map provides them with a huge opportunity and challenge.
Please leave comments and I will monitor/respond.
I’ll be the first to ask if you’d care to share the relevant data? I.e., race and partisanship by district.
Thanks.
I like your idea of essentially starting with the Bay Area and working outward, the geography there is the most restrictive. Your 5th seat for Nevada (SB to Alpine) is one that always seemed really obvious to me.
As for your comment on numbers, I think redistricting nerds should petition Congress to follow the tradition of the UK, Canada etc and require that districts be named rather than numbered. I’m always trying to figure out who represented the Wyoming 15th two censuses ago and it’s impossible because the number has moved across the state. It’s also impossible to know if adjacent numbered districts are anywhere near each other.
There is a specific requirement to maintain areas of “similar living standards”, ie. making “rich districts” and “poor districts”. Seems like a pretty clear attempt to preserve GOP-friendly districts.
Also, just to toss this out there…how come the GOP always gets their way with these types of initiatives, even in the likes of dark blue California?
I’ve searched for numbers on 20 and 27. A link to whatever polling you referenced in the beginning of the article would be rather cool.
There’s a lot of stuff here that I’ve never seen before, which is really interesting. For instance, the fact that you don’t have a purely coastal district north of the Bay Area, but rather combine it with the rest of northern California. Or combining Riverside and Imperial counties. Or putting all of Fresno into one district, instead of chopping it off into a gerrymandered Democratic district.
This is also the first time I’ve ever seen Los Angeles to be drawn to make sense. Whenever I see Los Angeles in gerrymandered districts, my brain starts pounding from all the weird lines and distorted shapes. But this actually looks simple. It gives me a sense that the inner-most parts of LA are more densely populated than the outer portions (something you can’t see with gerrymanders.) Also I can actually see how many districts fit inside Orange County – something like 4, I think.
By the way, are you following the VRA restrictions? It doesn’t seem to be that you are, since the VRA kills compactness. I could see some of the inner-city LA and Central Valley districts being rejected for packing too many minorities into one district. How many Asian, black, and Latino majority/plurality districts do you have?
It’s split between CA-19, CA-20 and CA-21. Everything looks very compact. I’m working on my own map now and compactness is something that I was going for as well.
First-time poster here! I used to live in CA-39 but moved out to Eugene for law school amongst the hippies. I really love this site especially for diaries like this.
I’ve heard so many Democrats argue against Prop 20 and for 27 because the independent commission has “no experience” with redistricting. If there was ever proof that the commission will have an overwhelming amount of quantitative input from redistricting “fans” who understand the math and like drawing lines, this is it.
The reason I feel strongly, despite being a Democrat, that prop 20 should pass, is because the sooner we pass redistricting reform in CA, the easier it will be in other states.
Yes, we’ll take a hit this time, but it’s worth it in the long term. And because of guys like Paul and others who understand redistricting because it’s intellectually interesting, I think the commission will do a great job.
I think most NorCal incumbents would be fine under this map. Herger, McClintock and Thompson’s seats have radically different boundaries but they each keep their bases. Matsui’s district doesn’t change much. Dan Lungren probably moves into the purple district, even though it only keeps Amador and northern SacCo because it looks pretty safe for him.
The western part of the Bay Area (Woolsey, Pelosi and Speier) stays pretty much the same, but the East Bay is radically changed. Right now I’d guess Miller takes the Contra Costa district and Stark the Alameda one, but the 10th and 11th districts are pretty much eliminated. Your red-brownish “channel” district overlaps with both the current 10th and 11th, so I’d guess that Garamendi and McNerney duke it out for that seat, or Miller/Stark might retire which would allow one of the two newer guys to slide into the open seat.
In the South Bay, looks like Mike Honda’s Asian-friendly 15th is eliminated and he’d have to choose between challenging Eshoo in west, Lofgren in SJ, or Sam Farr in South SJ/Santa Cruz. His best bet is the last option, hoping Farr runs in the orange Monterey/SLO district.
In the Central Valley, it looks like Cardoza’s seat is gone, instead creating a new safe Republican seat. Whoever wins in the 19th would probably move into the Stanislaus district, Costa would stay in Fresno, while Devin Nunes would have his pick of the Fresno-eating yellow district or the lime Tulare/Kings seat, while a new Republican would take the old.
Not sure what to think about the grey district. It takes the more conservative parts of Sacramento (formerly the 3rd), but also includes most of swing-y San Joaquin (from the 11th and 18th). I’d guess Cardoza might try here as it’s his only real shot, but it’s probably too conservative for him to win.
The orange district has Sam Farr’s hometown of Monterey, but replacing Santa Cruz with SLO makes it way more conservative, and it looks like it was practically gift-wrapped for Abel Maldonado, whose senate seat was almost identical (minus parts of Silicon Valley).
Overall, it looks like Democrats would suffer a few losses in NorCal, with the biggest losers being Garamendi, McNerney, Cardoza and Honda. The yellow district is a guaranteed D-to-R flip, and the grey looks likely to be the same. I don’t know how the red-brown “channel” seat would break down as it’s fractions of two counties, but it’s also a possible Dem loss. The orange seat is now a swing seat, and there are several good GOP candidates who could win it.
So this map looks like a 2-4 seat loss for Democrats in NorCal alone. I don’t know enough about SoCal, and your map in that area is too small, for me to make any predictions. Not good news for Dems in the face of GOP gerrymandering in other states.
What happens if both Prop. 20 and Prop. 27 pass?