Just for fun, I wanted to see what I could come up with in the event the House of Representatives increases in size so that each state with an at-large representative (excluding Alaska which isn’t yet supported) gets a second rep.
Couldn’t remember it being done (if it has, sorry for the repetitiveness).
Funny, I read left to right, but redistrict right to left. I guess it’s that manifest destiny thing, moving from east to west.
Delaware, Montana, North Dakota, South Dakota, Vermont, and Wyoming.
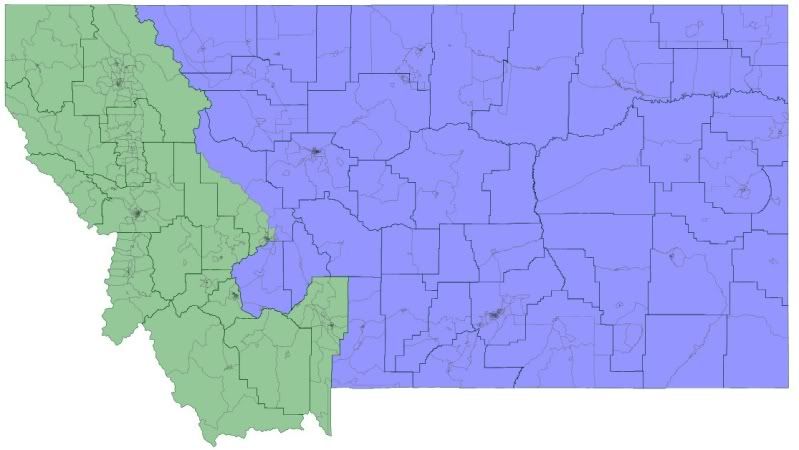
CD1, Lean Republican
Blue
86% White, 9% Native American, 2% Hispanic
54% McCain/46% Obama
CD2, Lean Democratic
Green
93% White, 3% Native American, 2% Hispanic
51% Obama/49% McCain
Even though the app doesn’t have the presidential breakdown, it’s pretty easy to figure it out when you keep the counties together and then just get the county figures. The county that’s split in Montana had a corresponding map that I was able to allocate the votes.
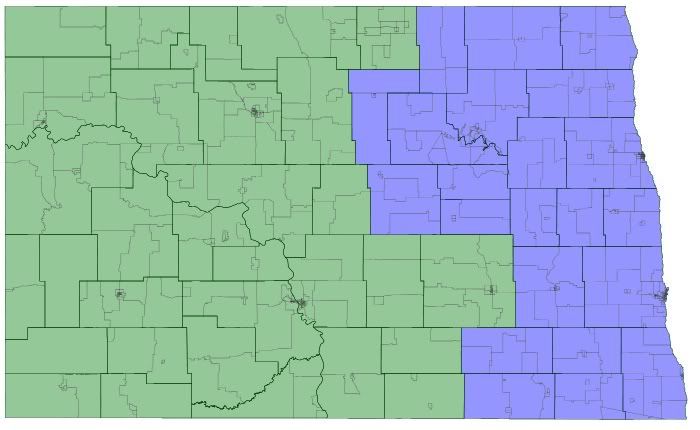
CD1, Lean Democratic
Blue
94% White, 3% Native American
52% Obama/48% McCain
Earl Pomeroy might still be a Congressman with this district.
CD2, Safe Republican
Green
90% White, 7% Native American
39% Obama/61% McCain
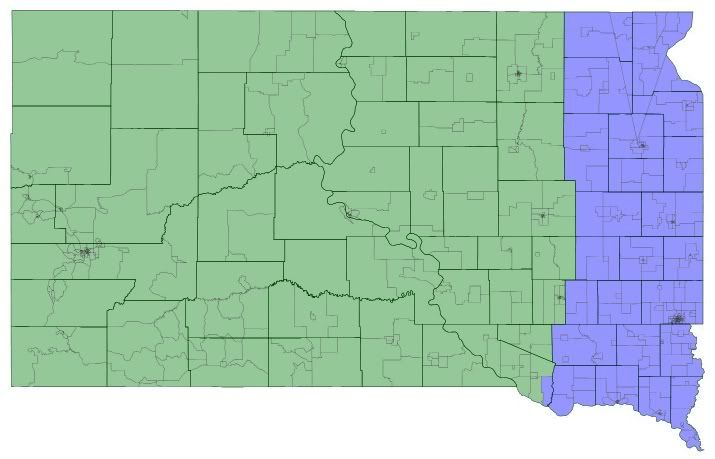
CD1, Lean Republican
Blue
94% White, 3% Native American
49% Obama/51% McCain
Stephanie Herseth-Sandlin might also still be in Congress with a district like this.
CD2, Likely Republican
Green
83% White, 13% Native American
42% Obama/58% McCain
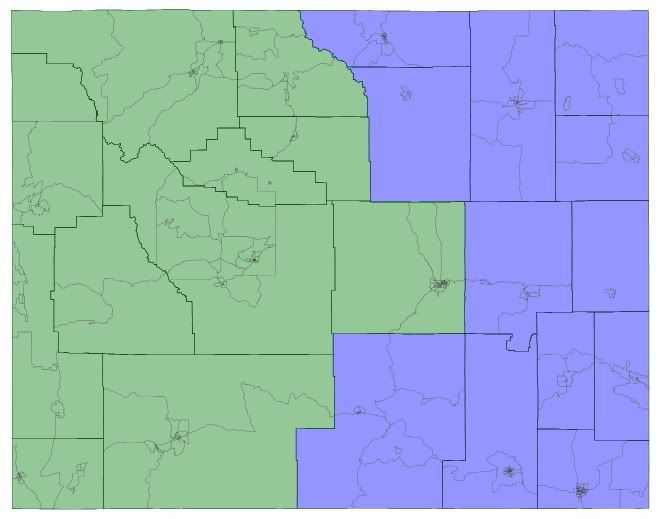
CD1, Safe Republican
Blue
89% White, 7% Hispanic
34% Obama/66% McCain
CD2, Safe Republican
Green
89% White, 5% Hispanic, 3% Native American
33% Obama/67% McCain
This was a little interesting. When I ran the 2006 numbers for the Congressional race between Gary Trauner (D) and Barbare Cubin (R) the result was a little different.
CD1, 50.12% Trauner/49.87% Cubin
45846/45624
CD2, 49% Trauner/51% Cubin
46478/47712
So by those numbers Gary Trauner would have been a Congressman by 222 votes.
CD1, Safe Democratic
Blue
95% White
70% Obama/30% McCain
CD2, Safe Democratic
Green
97% White
68% Obama/32% McCain
Surprisingly easy to break up Washington County (Montpelier) and allocate the votes. Wikipedia had maps for the locations of the towns which is how the Secretary of State’s office broke down the election results in that county. Just put the towns into the right districts.
In case you might be wondering, since I ran the 2006 numbers in Wyoming, I also did it in Vermont (Peter Welch vs. Martha Rainville) where the Republicans had their big recruit. Unfortunately for the Republicans, she lost in both districts.
CD1, 53% Welch/47% Rainville
69203/62567
CD2, 56% Welch/44% Rainville
70612/54456
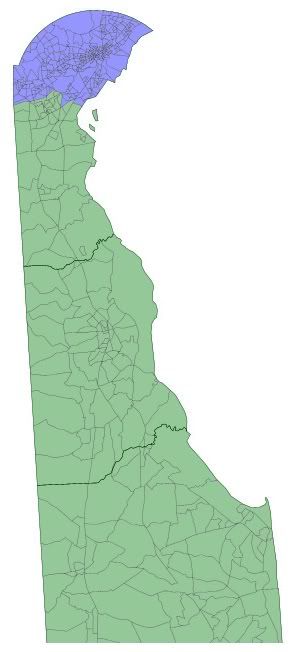
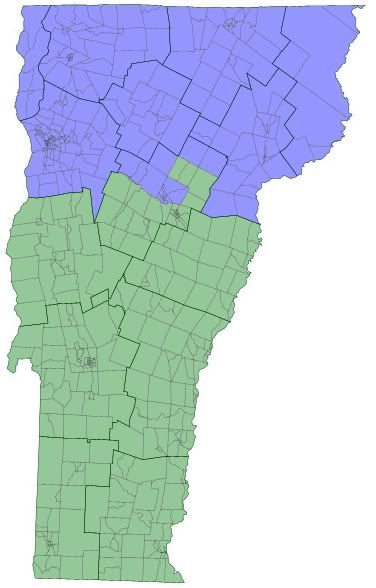
CD1, Safe Democratic
Blue
70% White, 20% Black, 6% Hispanic, 3% Asian
63% Obama/37% McCain
CD2, Likely Democratic
Green
75% White, 17% Black, Hispanic 4%
55% Obama/45% McCain
A big asterisk needs to go by this map, because it is a big guesstimate. New Castle County didn’t have easy precincts or districts that corresponded to the map. Or if it did, I couldn’t find it. The election district maps I found at the Delaware Elections site were .pdfs of each small election district with breakdowns, but I didn’t feel like playing Match Game with them.
I used the state house races in New Castle and gave the Democratic votes to Obama and the Republican votes to McCain. Obviously, I didn’t get the right numbers, I know. Again, I just did it for fun.
The House size would have to increase a lot for Wyoming to get a second seat. More people live in El Paso County (one in Texas and one in Colorado) than Wyoming so we’d be talking about 270,000 per seat. Thats a House of well over 1,000 representatives!
I’ve been wanting to do the same, and now you’ve saved me the trouble. I’m quite sure you’ve come up with almost exactly the same maps I would’ve, except perhaps South Dakota. I think in that case they might choose to redistrit with an arc around the southeast corner of the state as one district versus splitting it vertically.
Either way, very neat. Thanks for posting!
PS. Montana might actually pull off a second seat next time around. They weren’t too far off this time, relatively speaking.
Obama/Biden overperformed because one of their own was VP. Christine O’Donnell won that district. Delaware was 62% Obama, so the 2 districts can’t be 63% and 55%. I would guess they were 73% and 51%.
I’m sure the districts would be east and west instead of north and south. It’s interesting that the eastern district would be more Democratic than NE-1, KS-2, or even MN-7.
This was mostly just for fun, I don’t really know anything about South Dakota politics. The main thing of note is that it is possible to create three Native American majority districts, which are blue, green and purple and have majorities of 59, 65, and 56 percent.
I attempted to make 2-district maps with one district that favors the party currently in the minority.
Delaware:
The blue district would be 70+% Obama, the green one around 50/50. Your Delaware districts would probably be about the same.
Montana:
Blue: 53-44 Obama, Green: 55-42 McCain.
North Dakota:
Blue: 52-46 Obama, Green: 60-38 McCain.
South Dakota:
Blue: pretty much 50/50, Green: 58-40 McCain.
Vermont:
Yeah, went a little crazy with this one. Blue would still be over 60% Obama, while green would probably be over 70% Obama.
Wyoming:
Blue is around 60% McCain (maybe less), Green probably over 70%.
You totally beat me to this. I’ve been messing with these maps for the last few days now. North Dakota to be honest just seems kind of pointless so I didn’t do it, but I’ve done all the others.
SD: Lopsidedness of population surprised me, too. I was expecting two even districts using the Missouri as a natural boundary, but ended up cramming everything except Sioux Falls into CD1. The only important difference is I put all of the Indian reservations into CD1, so my version has a little pointy bit at the top right hand corner. Otherwise, not a lot of ways to divide a rectangle.
VT: My VT map is actually substantially different, though I think yours is more plausible – assuming we suspend disbelief that VT will ever have more than one district. I did a divide along cultural/class boundaries, with the Burlington-Montpelier corridor as the center of CD1 and the rest of the state (incl. St. Albans) as CD2. It actually turned out a lot like Maine, I think, where CD1 is hard liberal while CD2 would probably elect a Blue Dog or even a moderate R if the latter still existed. Would be really crappy to campaign in, though.
My DE and MT maps were pretty similar. DE can’t really be split any other way that makes sense; MT looks so much cleaner than mine turned out. I really struggled over which district Bozeman should go in, then lost it from there.
Lots of fun, overall.
It seems common in redistricting maps for people to treat >50% Obama districts as “Democratic-leaning” districts when in a neutral year, they may lean Republican.
For instance, in terms of CPVI, MT-01 would be about R+10 and MT-01 about R+4. I can’t really see how an R+4 district could be “Lean Democratic”. Perhaps you’re accounting for the fact that Congressional Democrats have done quite well in Montana historically. I am hesitant to think this trend is likely to continue, though, with the continued “Presidentialisation” of politics.
And yeah, it’s contigious. I can’t calculate Obama-McCain numbers as counties are split, but I’d be very surprised if it was less than 55% Obama.
Some thought went into it, I gerrymandered Billings on a precinct basis and calculated the best way to get to every Democratic area without pickinc up too many GOP areas (you can see that with Bozeman, where I left Republican Belgrade out).
Also, no, the district doesn’t touch the border southwest of Missoula, there are like a 2-3 miles left.
The Twos becomes Three–NH, Maine, Rhode Island, Hawaii and Idaho. Actually Rhode Island may be going the other way but the other states are candidates for three seats.
I might add as a point of interest an historical study of their maps is quite amusing. We see lots of changes in maps that are posted for various states but the two seat states are frozen in time in many ways. There are very logical reasons in each case.
and the gap between Rhode Island and Montana is getting smaller and smaller. Either one state gains another or the other loses one. What a mad dash.
In Rhode Island for whatever reason Providence has always been split-at least since 1912-between the two seats. Either to give that town some influence in its seat or to lessen its influence. Not sure which it is.
In NH Nasshau and Manchester have always been in seperate seats. As one city has become more democratic that seat is slightly more D then the other. The idea of splitting the cities was to keep the districts competitive.
In Maine the hallmark of two seat redistricting has been to split the six republican coastal counties. Sagadahoc to Washington county have been split 3 & 3 between the districts. The democratic growth in Portland area has botched that plan and the six GOP counties are as diehard GOP as before. Yet the plan will probably remain in place.
Idaho & Hawaii are city driven plans in their own ways.