TN-09: EMILY’s List Endorses Tinker Over Cohen

(From the diaries – promoted by James L.)

I’m not sure if this is a case of EMILY’s List jumping the shark, drinking the gender essentialist Kool-Aid, or throwing Steve Cohen under the bus (maybe all three cliches at once?), but EMILY’s List has endorsed Nikki Tinker in the primary in TN-09 rather than incumbent progressive Steve Cohen.

EMILY’s List offered the following rationale:

“This is an extraordinary circumstance for us. We don’t make these decisions lightly,” said EMILY’s List spokeswoman Ramona Oliver. “Nikki ran a strong race in 2006 has put a strong race together in 2008, and she’s the only woman in this race.”

Cohen’s response was:

Cohen said he was somewhat surprised by the endorsement, citing his support and ‘A’ rating from the abortion-rights group Planned Parenthood. “It’s unfortunate that the women who give money and trust to EMILY’s List are not going to see their money going against Republicans, but that their money is going to used against a champion of choice,” Cohen said.

And Cohen’s campaign manager got more to the point!

“Steve Cohen doesn’t have the proper plumbing for EMILY’s List. His record as a state senator and congressman doesn’t mean anything to EMILY’s List because he’s not the right gender,” said Cohen campaign manager Jerry Austin.

The race in TN-09 is a curious confluence of gender and race; Steve Cohen is a Jewish white guy who represents a district that’s almost 60% African-American (who emerged from the primary via a split black vote). This is the seat that used to be represented by Harold Ford, Jr., so with Cohen a member of the Progressive Caucus and sporting a Progressive Punch score of 95%, he’s a big improvement over Ford, who was consistently the least liberal member of the CBC.

By contrast, Tinker (who is African-American and, obviously, female) is running as the apparently more conservative option (and, presumably, one who would therefore be less representative of the views of her D+18 district). Tinker’s background is in corporate law, specializing in “labor relations,” first for large firm Ford & Harrison and then for the general counsel for Memphis-based Northwest Airlines affiliate Pinnacle Airways.

For what it’s worth, a poll from a few weeks ago showed Cohen beating Tinker by a gaudy 63-11 margin, so unless it’s intended simply as a thumb in the eye to Cohen, it may be too little too late for them (although the primary isn’t until August 7).

Why a thumb in the eye right now? Cohen may have a frowny face on their good/bad chart as a result of his May 10 gaffe where he used a sexually loaded cinematic allusion to urge Hillary Clinton to exit stage right:

“Glenn Close should have stayed in that tub, and Sen. Clinton has had a remarkable career and needs to move to the next step, which is helping elect the Democratic nominee,” Cohen said.

Cohen rightly expressed his regrets over the comparison later, but is it an offense that really justifies EMILY’s List diverting its resources away from the general election task of beating Republicans and their decidedly non-feminist agenda?

Flip This House Delegation

It’s that time of the year when people start contemplating “Oh, no! What if there’s a tie in the Electoral College?” (It’s actually not that far-fetched. Take the Kerry states, add Iowa, Colorado, and New Mexico, subtract New Hampshire and you get 269 each.)

As you might or might not be aware, the 12th Amendment states that in the event of a tie (or no one getting a majority because of a 3rd party), the House of Representatives decides who becomes President. However… it’s not done by individual votes. Instead, each state delegation gets one vote. So, let’s assume there’s no horse trading going on behind the scenes, or strangely principled decisions to honor the will of the state’s voters rather than one’s party designation, and see which party controls which party delegation: the Dems control 27, the GOP controls 21, and there are 2 ties. (This is already a dramatic improvement over the situation going into the 2006 elections, when the GOP controlled 30, Dems controlled 17, and there were 3 ties.)

Dems: Arkansas (3-1), California (34-19), Colorado (4-3), Connecticut (4-1), Hawaii (2-0), Illinois (11-8), Indiana (5-4), Iowa (3-2), Maine (2-0), Maryland (6-2), Massachusetts (10-0), Minnesota (5-3), Mississippi (3-1), New Hampshire (2-0), New Jersey (7-6), New York (23-6), North Carolina (7-6), North Dakota (1-0), Oregon (4-1), Pennsylvania (11-8), Rhode Island (2-0), South Dakota (1-0), Tennessee (5-4), Vermont (1-0), Washington (6-3), West Virginia (2-1), and Wisconsin (5-3)

GOP: Alabama (5-2), Alaska (1-0), Delaware (1-0), Florida (16-9), Georgia (7-6), Idaho (2-0), Kentucky (4-2), Louisiana (4-3), Michigan (9-6), Missouri (5-4), Montana (1-0), Nebraska (3-0), Nevada (2-1), New Mexico (2-1), Ohio (11-7), Oklahoma (4-1), South Carolina (4-2), Texas (19-13), Utah (2-1), Virginia (8-3), and Wyoming (1-0)

Ties: Arizona (4-4) and Kansas (2-2)

So which are the likeliest delegations to flip? Turning to Swing State Project’s competitive House race ratings, I’ve tried to rank the likelihood of delegations moving from majority-R (or a tie) to majority-D. Ordinarily, I’d suggest this be the basis for some consideration as to how to allocate our House race resources… but considering that we’re already up 27-21 and looking to flip more delegations without a lot of strategic targeting, simply by virtue of how much the playing field is tilted in our direction this year, this serves more as a conversation piece this year. In short, we can move the margin to 30-19 by winning all our toss-ups, and we can move it as far as 35-14 by winning all our lean Rs as well.

Alaska: 1 to flip. AK-AL is a toss-up, previously rated Lean D. The biggest threat to our fortunes in this seat would be if Don Young doesn’t make it out of his primary.

Arizona: 1 to break tie. AZ-01 is an open scandal seat, rated toss-up.

New Mexico: 1 to flip. Rated toss-up, NM-01 is an open seat in a D+2 district, although the Republicans recruited a solid contender here. (Plus, NM-02 is a likely R.)

Nevada: 1 to flip. NV-03 is lean R. Although there was some weirdness with a candidate swap last month, Dina Titus may actually be an upgrade. NV-02 is also likely R.

Ohio: 2 to tie, 3 to flip. We’re getting into table-running territory here, but we can do it by picking up OH-15 (toss-up), OH-16 (toss-up), and one of OH-01 (lean R) and OH-02 (lean R). For good measure, there are OH-07 and OH-14 (races to watch).

Missouri: 1 to flip. MO-06 (lean R) looks promising, with a former Kansas City mayor on our side. MO-09 (likely R) presents another opportunity.

Louisiana: 1 to flip. LA-04 (lean R) doesn’t seem so out of reach given our special election victory in LA-06.

Michigan: 2 to flip. MI-07 and MI-09 are both rated lean R. (And MI-07 may actually be our best shot at an incumbent.)

Wyoming: 1 to flip. WY-AL is likely R, although we’d have better odds if we were facing the retiring incumbent instead of someone new.

Further down the list, there’s Virginia (3 to flip: VA-11 is toss-up, VA-02 and VA-10 are likely R, VA-05 is a race to watch), Florida (a herculean 4 to flip, but FL-08, FL-13, FL-15, FL-18, FL-21, FL-24, and FL-25 are all likely R), Idaho (1 to tie, 2 to flip: ID-01 is likely R), Alabama (2 to flip: AL-02 is likely R and AL-03 is a race to watch), Kentucky (1 to tie, 2 to flip: KY-02 is likely R), Montana (1 to flip: MT-AL is a race to watch), Kansas (1 to break tie: KS-04 is a race to watch), South Carolina (1 to tie, 2 to flip: SC-01 and SC-02 are races to watch), Nebraska (2 to flip: NE-02 is a race to watch), and Texas (3 to tie, 4 to flip: TX-07 and TX-10 are races to watch). There’s no action to speak of in Delaware (1 to flip), Georgia (1 to flip), Oklahoma (2 to flip), or Utah (1 to flip).

OK, what about worst case scenario time? I’m not sure what could make the Democratic brand more toxic than the spoiled dog food that the Republicans are currently peddling, but suppose it happens (and Obama wouldn’t be tying the electoral vote in the general under those circumstances anyway, so this is mostly academic). Suppose the Democrats pick nothing up, and also lose every toss-up? That still doesn’t flip a single delegation back to the Republicans. The Democrats would also have to lose every lean D seat in order for the Republicans to pick up a 25-21 edge (by flipping Indiana, Arizona, and Pennsylvania, breaking the tie in Kansas, and knocking Wisconsin, New Hampshire, and Mississippi back to ties).

Kansas: 1 to break tie. KS-02 is lean D, KS-03 is likely D.

Indiana: 1 to flip. IN-09 (the 4th Hill/Sodrel go-round) is ranked lean D, plus IN-02 and IN-08 aren’t out of the woods at likely D.

Arizona: 1 to break tie. AZ-05 and AZ-08 are both lean D.

Pennsylvania: 2 to flip. PA-04 and PA-10 are lean D, plus PA-08 and PA-11 are likely D.

Wisconsin: 1 to tie, 2 to flip. WI-08 is lean D.

New Hampshire: 1 to tie, 2 to flip. NH-01 is lean D, and NH-02 is likely D.

Mississippi: 1 to tie, 2 to flip. MS-01 is lean D.

Further down the list, there’s also Illinois (2 to flip: IL-14 is lean D and IL-08 is likely D), North Carolina (1 to flip: NC-11 is likely D), Minnesota (1 to tie, 2 to flip: MN-01 is likely D), Connecticut (2 to flip: CT-02 and CT-05 are likely D), and Tennessee (1 to flip: TN-04 is a race to watch). For the rest of the Dem states, there’s no path to a flip.

Representatives’ Race/Ethnicity and District Demographics

(From the diaries – promoted by DavidNYC)

In several diaries or stories lately there have been comments where people have wondered whether Congressperson X is the only person of Y race to represent a district that is majority-Z. I went through the list and found every one I can think of, so hopefully this diary can be the ultimate argument-settler. Please feel free to chime in in the comments if you think someone is missing.

I’m using 2005 census estimates. Interestingly, a number of districts have crossed a threshold since the 2000 census: a number of districts, for instance, have crossed from a white plurality to a Hispanic plurality in those years (CA-17, CA-21, CA-23, CA-27), while CA-13 crossed from white plurality to an Asian plurality. TX-09, TX-18, and TX-30 crossed from an African-American plurality to a Hispanic plurality (although the Houston districts may have switched back, thanks to the New Orleans diaspora). While most districts are becoming less white, one district actually crossed the other way: HI-02 crossed from an Asian plurality to a white plurality.

Districts with white majority not represented by white

Rep. Rep’s race District % white % Af.-Am. % Asian % Hispanic
Wu Asian OR-01 77.8 1.2 6.1 11.8
Cole Native Am. OK-04 76.9 6.3 1.9 5.5
Salazar Hispanic CO-03 73.8 0.4 0.7 22.4
Franks Hispanic* AZ-02 73.5 2.9 2.2 17.5
Ellison Af.-Am. MN-05 67.8 13.3 5.7 8.4
Cleaver Af.-Am. MO-05 65.2 23.7 1.4 7.0
Carson Af.-Am. IN-07 58.0 31.0 1.4 6.8
Eshoo Asian* CA-14 55.9 2.4 19.6 18.0

(Despite the Anglo name, Trent Franks identifies as Mexican-American and is a member of the Congressional Hispanic Conference, the Republican equivalent to the Congressional Hispanic Caucus. Anna Eshoo is of Assyrian descent; I don’t know if she would describe herself as white or Asian.)

Districts with white plurality not represented by white

Rep. Rep’s race District % white % Af.-Am. % Asian % Hispanic
Bishop Af.-Am. GA-02* 47.8 47.6 0.6 2.9
Moore Af.-Am. WI-04 44.1 35.6 3.3 14.3
Honda Asian CA-15 41.2 2.1 33.6 19.9
Matsui Asian CA-05 39.6 14.7 15.9 24.7
Lee Af.-Am. CA-09 36.0 22.5 15.7 21.4
Hirono Asian HI-02 28.7 1.5 26.5 10.8

(The Census Bureau, for some reason, does not have estimated populations for 2005 for the 110th congress (only for the 109th congress, which doesn’t reflect Georgia’s mid-decade redistricting), so the numbers for GA-02 are based on the actual 2000 census count. As you can see, it may have crossed into an African-American plurality in the last few years.)

Districts with African-American majority not represented by African-American

Rep. Rep’s race District % white % Af.-Am. % Asian % Hispanic
Cohen White TN-09 29.6 63.1 1.7 4.3

Districts with African-American plurality not represented by African-American

Rep. Rep’s race District % white % Af.-Am. % Asian % Hispanic
Brady White PA-01 26.5 49.6 4.8 17.1

Districts with Asian majority not represented by Asian

Rep. Rep’s race District % white % Af.-Am. % Asian % Hispanic
Abercrombie White HI-01 17.0 2.4 56.5 5.0

Districts with Asian plurality not represented by Asian

Rep. Rep’s race District % white % Af.-Am. % Asian % Hispanic
Stark White CA-13 30.4 7.1 35.0 22.9

Districts with Hispanic majority not represented by Hispanic

Rep. Rep’s race District % white % Af.-Am. % Asian % Hispanic
Gene Green White TX-29 17.1 10.1 1.2 70.8
Filner White CA-51 18.4 6.3 13.1 59.5
Berman White CA-28 30.7 3.1 6.0 58.4
Waters Af.-Am. CA-35 9.7 29.3 5.7 53.5

Districts with Hispanic plurality not represented by Hispanic

Rep. Rep’s race District % white % Af.-Am. % Asian % Hispanic
Pearce White NM-02 42.0 1.5 0.6 49.3
Nunes White* CA-21 40.3 2.3 6.3 48.6
Rangel Af.-Am. NY-15 19.0 27.3 3.0 47.7
Richardson Af.-Am. CA-37 14.2 22.2 12.9 47.6
Farr White CA-17 43.0 1.8 5.4 46.9
Capps White CA-23 44.7 1.6 5.2 46.3
Crowley White NY-07 24.2 15.6 15.9 42.3
Jackson Lee Af.-Am. TX-18 17.2 37.0 3.2 41.6
Sherman White CA-27 40.2 5.1 12.0 40.6
Al Green Af.-Am. TX-09 14.1 34.3 10.1 40.5
E.B. Johnson Af.-Am. TX-30 17.9 39.7 1.0 40.1
Watson Af.-Am. CA-33 20.6 27.1 12.6 37.5
Lofgren White CA-16 29.0 2.8 27.8 37.2

(Devin Nunes is a member of the Congressional Hispanic Conference, but identifies as Portuguese-American, which at least to me does not imply either “Hispanic” (from a Spanish-speaking background) or “Latino” (from a Latin American background).)

PVI vs. Vote Index: The Role of Caucuses

(Excellent work.  From the diaries – promoted by James L.)

You may recall I did a few diaries last month where I explored the relationship between representatives’ voting records and the lean of their districts (see here and here). One other question I had wanted to work into my discussion was the role of the various ideological Congressional caucuses.

There are pretty clear differences between the voting records of members of the different caucuses, but does membership in particular caucuses correlate with a particular kind of district? And is any particular caucus generally ‘out-of-whack,’ where the members as a whole tend to overperform or underperform their districts? In particular, I was wondering about the Blue Dogs, who tend to get the lion’s share of the abuse from the left blogosphere. It’s well understood they’re the most conservative members of the House Democrats… but are they also the most underperforming?

For those who aren’t familiar with the caucuses, there are three major ideological caucuses for the House Democrats: the Progressive Caucus, which comprises many of the House’s most liberal members (and, generally, those from the most urban districts), the New Democrat Coalition, which, although it’s a lineal descendent of the Democratic Leadership Council, tends to represent the ideological midpoint of the Democratic caucus, and the Blue Dog Coalition, representing the most conservative Democratic House members (and, not coincidentally, most of the ones from the most rural districts). Also within the Democratic party are the Congressional Black Caucus, which has significant overlap with the Progressive Caucus, and the Congressional Hispanic Caucus, which tends to range across the Democratic spectrum. Likewise, although it receives less attention, there is a similar schism on the Republican side, between the Main Street Partnership, comprised generally of more moderate representatives in suburban districts, and the more conservative Republican Study Committee.

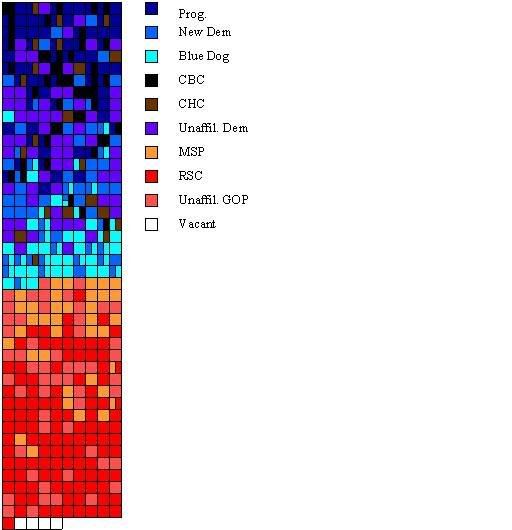
Here’s an instance where a picture is worth a thousand words: this chart has a box for each representative (grouped in rows of 10), arranged from most liberal voting record at top to most conservative at bottom, color-coded according to caucus membership. (For record, I’m using Progressive Punch Chips are Down scores, circa March 2008.) As you can see, there’s a pretty clear stepping downward from Progressive to NDC to Blue Dogs to Main Street to RSC. (You’ll notice a lot of squares where there are two, or in one case three, colors jammed in there. A number of people are members of multiple caucuses.)

Photobucket

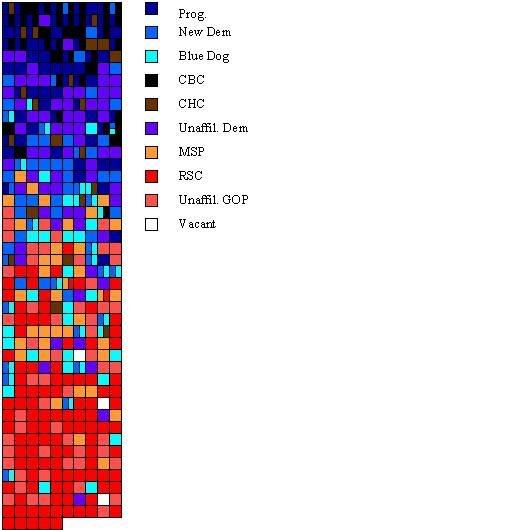
Notice that this chart is a pretty good match for the following one, which arranges each representative from most Democratic-leaning district (as measured by PVI) at top, to most Republican-leaning district at bottom. In other words, in general, you can see the same basic clustering of Progressive (and CBC) members at top, NDC members below that, and a whole lot of RSC at the bottom. The swing-district middle is a bit more muddled here, split largely between Blue Dogs and Main Streeters with a lot of odds and ends.

Photobucket

While these two graphs show that, in general, there’s a pretty good correlation between voting record, district lean, and caucus membership, they aren’t connected and thus don’t show individual outliers who are either underperforming or overperforming their district leans. For that, let’s turn to a scatterplot that was originally put together by plf515 (from this diary). The vertical axis is how liberal the representative is (here measured by National Journal composite scores from 2007); the horizontal axis is the district lean. I’ve added the same caucus-based color-coding as the previous two graphs. (Note that this graph only covers Democrats.)

Photobucket

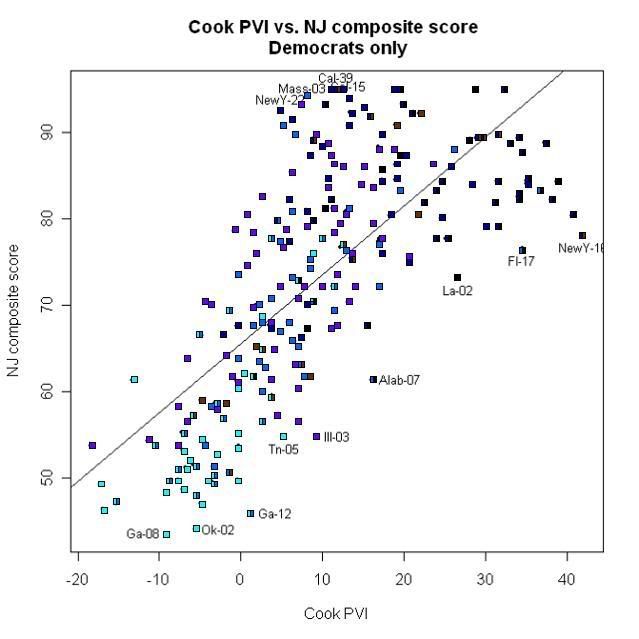
The diagonal line represents essentially the center of gravity for all the points on the graph. Dots close to the line represent those for whom voting record and district lean are a predictable fit. The further away from the line a dot is, the more of an outlier the representative is. Above the line, the far-away dots are representatives who are voting more liberally than one would expect based on the district (overperforming the district), while the dots far below the line are representatives who are underperforming the district lean with their voting records.

As you can see, the outliers aren’t consistent with any one caucus or any particular type of voting record: there are some Congressional Black Caucus members who are lagging their extremely Democratic districts (Bill Jefferson in LA-02, as well as Artur Davis in AL-07 and Kendrick Meek in FL-17, two of the four members of both the CBC and the NDC), and there are some Blue Dogs whose conservative records are low even in relation to their moderate or conservative districts (Jim Marshall in GA-08, Dan Boren in OK-02, John Barrow in GA-12, and Jim Cooper in TN-05). (The other two marked outliers are Jose Serrano, of the Progressive and Congressional Hispanic Caucuses, but located in the nation’s most Democratic district… and the purple one is, of course, Dan Lipinski of IL-03, who is unaffiliated although voting like a Blue Dog in a D+10 district.)

More generally, looking at the placement of the dots, they seem to follow the same general pattern: more Progressives and CBC members at the liberal ends of the spectrum, more Blue Dogs at the conservative end, a cluster of NDC members near the very middle. Looking at them in relation to the diagonal line, though, you can see some differences in where they are, relative to the overall center of gravity. The mass of the Blue Dogs tend to cluster below the diagonal line; eyeballed as a whole, they’re underperforming, albeit slightly. The same goes with the Congressional Black Caucus, which clusters below the diagonal line at the other end of the graph, where they tend to occupy the most Democratic districts in the country and are liberal but don’t necessarily have the most liberal voting records to match.

Clustered above the diagonal line tend to be the Progressives — or I should say the “Progressives only,” since many of the Progressive/CBC double-dippers tend to fall below the line — who tend to fall in the D+5 to D+20 range but also in the uppermost tier of liberal voting records. (The Massachusetts delegation alone seems to make up a sizable portion of this clump, along with a few stalwarts like Maurice Hinchey in NY-26 and Tammy Baldwin in WI-02.)

So… as the charts show, caucus membership corresponds pretty well with both voting record and district lean, although, naturally, there are lots of individual deviations. Here are some more data on the caucuses:

All Blue Dogs (49)

20 from South, 7 from Northeast, 12 from Midwest, 10 from West

Median PVI: R+3

PVI Range: D+13 (Baca) to R+17 (Matheson)

Median Progressive Punch 2007-08: 86.43

Progressive Punch 2007-08 Range: 95.65 (Loretta Sanchez) to 68.22 (Barrow)

Median Progressive Punch Chips Are Down: 57.87

Progressive Punch Chips Are Down Range: 83.52 (Mike Thompson) to 29.82 (Marshall)

Median Progressive Punch Lifetime: 76.06

Progressive Punch Lifetime Range: 93.76 (Arcuri) to 60.39 (Cramer)

Median National Journal Composite 2007: 54.1

National Journal Composite 2007 Range: 77.8 (Loretta Sanchez) to 43.5 (Marshall)

Bad Votes on Iraq Supplemental: 40 (81.6%)

Bad Votes on FISA: 34 (69.4%)

Bad Votes on ENDA: 14 (28.6%)

Bad Votes on Stem Cells: 9 (18.4%)

Bad Votes on SCHIP override: 1 (2.0%)

Median Rural % of District: 39

Rural % of District Range: 69 (Michaud) to 0.0 (Harman and Loretta Sanchez)

Blue Dogs Only (24)

12 from South, 2 from Northeast, 8 from Midwest, 2 from West

Median PVI: R+4.5

PVI Range: D+10 (Mike Thompson) to R+17 (Matheson)

Median Progressive Punch 2007-08: 85.43

Progressive Punch 2007-08 Range: 94.07 (Mike Thompson) to 72.99 (Marshall)

Median Progressive Punch Chips Are Down: 53.96

Progressive Punch Chips Are Down Range: 83.52 (Mike Thompson) to 29.82 (Marshall)

Median Progressive Punch Lifetime: 72.84

Progressive Punch Lifetime Range: 88.95 (Charlie Wilson) to 60.39 (Cramer)

Median National Journal Composite 2007: 51.8

National Journal Composite 2007 Range: 75.8 (Mike Thompson) to 43.5 (Marshall)

Bad Votes on Iraq Supplemental: 21 (87.5%)

Bad Votes on FISA: 18 (75%)

Bad Votes on ENDA: 10 (41.7%)

Bad Votes on Stem Cells: 8 (33.3%)

Bad Votes on SCHIP override: 1 (4.2%)

Median Rural % of District: 45.25

Rural % of District Range: 69 (Michaud) to 11.3 (Cooper)

Blue Dogs + NDC (20)

7 from South, 5 from Northeast, 4 from Midwest, 4 from West

Median PVI: R+2.5

PVI Range: D+12 (Schiff) to R+15 (Lampson)

Median Progressive Punch 2007-08: 86.01

Progressive Punch 2007-08 Range: 95.65 (Loretta Sanchez) to 68.22 (Barrow)

Median Progressive Punch Chips Are Down: 53.37

Progressive Punch Chips Are Down Range: 81.4 (Loretta Sanchez) to 31.61 (Lampson)

Median Progressive Punch Lifetime: 80.18

Progressive Punch Lifetime Range: 93.76 (Arcuri) to 64.94 (McIntyre)

Median National Journal Composite 2007: 55.9

National Journal Composite 2007 Range: 77.8 (Loretta Sanchez) to 45.8 (Barrow)

Bad Votes on Iraq Supplemental: 14 (70%)

Bad Votes on FISA: 9 (45%)

Bad Votes on ENDA: 4 (20%)

Bad Votes on Stem Cells: 1 (5%)

Median Rural % of District: 16.6

Rural % of District Range: 55.4 (Carney) to 0 (Harman and Loretta Sanchez)

[Note: There are also one Blue Dog/CBC member (Sanford Bishop), four Blue Dogs/CHC members (Cardoza, Costa, Baca, and Salazar), and one Blue Dog/New Dem/CBC member (David Scott).]

All New Democrats (59)

17 from South, 17 from Northeast, 8 from Midwest, 17 from West

Median PVI: D+5

PVI Range: D+38 (Greg Meeks) to R+15 (Lampson)

Median Progressive Punch 2007-08: 93.52

Progressive Punch 2007-08 Range: 98.29 (Capps) to 68.22 (Barrow)

Median Progressive Punch Chips Are Down: 73.94

Progressive Punch Chips Are Down Range: 93.26 (Capps) to 31.61 (Lampson)

Median Progressive Punch Lifetime: 85.42

Progressive Punch Lifetime Range: 94.75 (Courtney) to 64.94 (McIntyre)

Median National Journal Composite 2007: 67.5

National Journal Composite 2007 Range: 94 (Capps) to 45.8 (Barrow)

Bad Votes on Iraq Supplemental: 29 (49.2%)

Bad Votes on FISA: 16 (27.1%)

Bad Votes on ENDA: 6 (10.2%)

Bad Votes on Stem Cells: 1 (1.7%)

Median Rural % of District: 6.8

Rural % of District Range: 56.9 (Kind) to 0 (6-way tie)

New Democrats Only (33)

6 from South, 11 from Northeast, 4 from Midwest, 12 from West

Median PVI: D+7

PVI Range: D+28 (Crowley) to R+4 (Mitchell)

Median Progressive Punch 2007-08: 93.99

Progressive Punch 2007-08 Range: 98.29 (Capps) to 75.03 (Altmire)

Median Progressive Punch Chips Are Down: 75.84

Progressive Punch Chips Are Down Range: 93.26 (Capps) to 38.2 (Altmire)

Median Progressive Punch Lifetime: 87.72

Progressive Punch Lifetime Range: 94.75 (Courtney) to 75.03 (Altmire)

Median National Journal Composite 2007: 70

National Journal Composite 2007 Range: 94 (Capps) to 51.3 (Altmire)

Bad Votes on Iraq Supplemental: 13 (39.4%)

Bad Votes on FISA: 5 (15.2%)

‘Bad’ Votes on ENDA: 1 (3.0%)

Median Rural % of District: 5

Rural % of District Range: 56.9 (Kind) to 0 (4-way tie)

[Note: There are also three New Dem/CBC members (Artur Davis, Kendrick Meek, and Greg Meeks), two New Dem/CHC members (Gonzalez and Cuellar), and one New Dem/Progressive (Tom Udall).]

All Progressives (68)

9 from South, 21 from Northeast, 17 from Midwest, 21 from West

Median PVI: D+20

PVI Range: D+43 (Serrano) to R+1 (John Hall)

Median Progressive Punch 2007-08: 97.24

Progressive Punch 2007-08 Range: 99.26 (Baldwin) to 92.18 (Kucinich)

Median Progressive Punch Chips Are Down: 89.11

Progressive Punch Chips Are Down Range: 97.19 (Baldwin) to 74.72 (Hare)

Median Progressive Punch Lifetime: 94.82

Progressive Punch Lifetime Range: 98.49 (Ellison) to 83.74 (Kaptur)

Median National Journal Composite 2007: 84.3

National Journal Composite 2007 Range: 95 (6-way tie) to 66.3 (Kucinich)

Bad Votes on Iraq Supplemental: 1 (1.5%)

‘Bad’ Votes on ENDA: 3 (4.4%)

Bad Votes on Stem Cells: 1 (1.5%)

Median Rural % of District: 0.65

Rural % of District Range: 61.8 (Welch) to 0 (25-way tie)

Progressive Only (33)

2 from South, 14 from Northeast, 6 from Midwest, 11 from West

Median PVI: D+15

PVI Range: D+36 (Robert Brady) to R+1 (John Hall)

Median Progressive Punch 2007-08: 97.23

Progressive Punch 2007-08 Range: 99.26 (Baldwin) to 92.18 (Kucinich)

Median Progressive Punch Chips Are Down: 89.14

Progressive Punch Chips Are Down Range: 97.19 (Baldwin) to 74.72 (Hare)

Median Progressive Punch Lifetime: 94.98

Progressive Punch Lifetime Range: 98.03 (Hirono) to 83.74 (Kaptur)

Median National Journal Composite 2007: 84.5

National Journal Composite 2007 Range: 95 (Schakowsky, McGovern, and Baldwin) to 66.3 (Kucinich)

‘Bad’ Votes on ENDA: 1 (3.0%)

Bad Votes on Stem Cells: 1 (3.0%)

Median Rural % of District: 4.4

Rural % of District Range: 61.8 (Welch) to 0 (5-way tie)

Progressive + CBC (26)

7 from South, 5 from Northeast, 10 from Midwest, 4 from West

Median PVI: D+30

PVI Range: D+43 (Rangel) to D+10 (Bennie Thompson)

Median Progressive Punch 2007-08: 97.26

Progressive Punch 2007-08 Range: 99.03 (Jesse Jackson Jr.) to 93.97 (Eddie Bernice Johnson)

Median Progressive Punch Chips Are Down: 89.52

Progressive Punch Chips Are Down Range: 96.07 (Jesse Jackson Jr.) to 77.38 (Corrine Brown)

Median Progressive Punch Lifetime: 96.23

Progressive Punch Lifetime Range: 98.49 (Ellison) to 87.51 (Corrine Brown)

Median National Journal Composite 2007: 84.3

National Journal Composite 2007 Range: 95 (Conyers and Gwen Moore) to 67.7 (Corrine Brown)

Bad Votes on Iraq Supplemental: 1 (3.8%)

‘Bad’ Votes on ENDA: 1 (3.8%)

Median Rural % of District: 0.05

Rural % of District Range: 37.2 (Bennie Thompson) to 0 (14-way tie)

Progressive + CHC (8)

2 from Northeast, 1 from Midwest, 5 from West

Median PVI: D+23.5

PVI Range: D+43 (Serrano) to D+10 (Grijalva)

Median Progressive Punch 2007-08: 97.73

Progressive Punch 2007-08 Range: 99.14 (Linda Sanchez) to 95.66 (Gutierrez)

Median Progressive Punch Chips Are Down: 90.43

Progressive Punch Chips Are Down Range: 96.61 (Linda Sanchez) to 80.98 (Gutierrez)

Median Progressive Punch Lifetime: 94.59

Progressive Punch Lifetime Range: 98.23 (Grijalva) to 91.13 (Gutierrez)

Median National Journal Composite 2007: 89.3

National Journal Composite 2007 Range: 95 (Linda Sanchez) to 75.3 (Pastor)

‘Bad’ Votes on ENDA: 1 (12.5%)

Median Rural % of District: 0

Rural % of District Range: 16.4 (Grijalva) to 0 (6-way tie)

All CBC (39)

17 from South, 8 from Northeast, 10 from Midwest, 4 from West

Median PVI: D+27

PVI Range: D+43 (Rangel) to D+2 (Sanford Bishop)

Median Progressive Punch 2007-08: 96.75

Progressive Punch 2007-08 Range: 99.03 (Jesse Jackson Jr.) to 91.77 (Artur Davis)

Median Progressive Punch Chips Are Down: 87.01

Progressive Punch Chips Are Down Range: 96.07 (Jesse Jackson Jr.) to 65.17 (Artur Davis)

Median Progressive Punch Lifetime: 92.11

Progressive Punch Lifetime Range: 98.49 (Ellison) to 74.36 (Sanford Bishop)

Median National Journal Composite 2007: 83.05

National Journal Composite 2007 Range: 95 (3-way tie) to 61.3 (Artur Davis)

Bad votes on Iraq Supplemental: 5 (12.8%)

Bad votes on FISA: 1 (1.3%)

Bad votes on ENDA: 3 (7.7%)

Median Rural % of District: 0.1

Rural % of District Range: 52.3 (Butterfield) to 0 (17-way tie)

CBC only (8)

6 from South, 2 from Northeast

Median PVI: D+24.5

PVI Range: D+41 (Towns) to D+9 (Butterfield)

Median Progressive Punch 2007-08: 96.48

Progressive Punch 2007-08 Range: 97.57 (Alcee Hastings) to 95.14 (Jefferson)

Median Progressive Punch Chips Are Down: 85.76

Progressive Punch Chips Are Down Range: 89.53 (Alcee Hastings) to 80.35 (Jefferson)

Median Progressive Punch Lifetime: 89.52

Progressive Punch Lifetime Range: 92.19 (Al Green) to 86.54 (Jefferson)

Median National Journal Composite 2007: 85

National Journal Composite 2007 Range: 89.2 (Alcee Hastings) to 73 (Jefferson)

Bad votes on Iraq supplemental: 2 (25%)

‘Bad’ votes on ENDA: 1 (12.5%)

Median Rural % of District: 2.1

Rural % of District Range: 52.3 (Butterfield) to 0 (Towns)

All CHC (21)

6 from South, 3 from Northeast, 1 from Midwest, 11 from West

Median PVI: D+13

PVI Range: D+43 (Serrano) to R+6 (Salazar)

Median Progressive Punch 2007-08: 95.66

Progressive Punch 2007-08 Range: 99.14 (Linda Sanchez) to 85.24 (Cuellar)

Median Progressive Punch Chips Are Down: 80.98

Progressive Punch Chips Are Down Range: 96.61 (Linda Sanchez) to 50.56 (Cuellar)

Median Progressive Punch Lifetime: 87.38

Progressive Punch Lifetime Range: 98.23 (Grijalva) to 70.05 (Ortiz)

Median National Journal Composite 2007: 76.7

National Journal Composite 2007 Range: 95 (Linda Sanchez) to 50.5 (Cuellar)

Bad votes on Iraq Supplemental: 10 (47.6%)

Bad votes on FISA: 4 (19.0%)

‘Bad’ votes on ENDA: 1 (4.8%)

Median Rural % of District: 0.5

Rural % of District Range: 39 (Salazar) to 0 (9-way tie)

CHC only (7)

4 from South, 1 from Northeast, 2 from West

Median PVI: D+9

PVI Range: D+23 (Roybal-Allard and Sires) to R+4 (Rodriguez)

Median Progressive Punch 2007-08: 92.65

Progressive Punch 2007-08 Range: 97.26 (Napolitano) to 90.48 (Ortiz)

Median Progressive Punch Chips Are Down: 71.91

Progressive Punch Chips Are Down Range: 88.7 (Roybal-Allard) to 64.63 (Ortiz)

Median Progressive Punch Lifetime: 84.68

Progressive Punch Lifetime Range: 95.38 (Sires) to 70.05 (Ortiz)

Median National Journal Composite 2007: 65

National Journal Composite 2007 Range: 92.2 (Roybal-Allard) to 58.5 (Ortiz)

Bad votes on Iraq Supplemental: 4 (57.1%)

Bad votes on FISA: 1 (14.3%)

Median Rural % of District: 1.7

Rural % of District Range: 23.6 (Rodriguez) to 0 (3-way tie)

Unaffiliated Democrats (63)

10 from South, 25 from Northeast, 17 from Midwest, 11 from West

Median PVI: D+9

PVI Range: D+36 (Pelosi) to R+18 (Chet Edwards)

Median Progressive Punch 2007-08: 95.39

Progressive Punch 2007-08 Range: 98.91 (Pelosi) to 85.66 (Boyda)

Median Progressive Punch Chips Are Down: 80.9

Progressive Punch Chips Are Down Range: 96.43 (Pelosi) to 55.93 (Boyda)

Median Progressive Punch Lifetime: 88.56

Progressive Punch Lifetime Range: 98.54 (Tsongas) to 63.46 (Skelton)

Median National Journal Composite 2007: 74.85

National Journal Composite 2007 Range: 93.3 (Delahunt) to 53.7 (Chet Edwards)

Bad votes on Iraq Supplemental: 23 (36.5%)

Bad votes on FISA: 3 (4.8%)

Bad votes on ENDA: 5 (7.9%)

Bad votes on Stem cells: 6 (9.5%)

Median Rural % of District: 7.8

Rural % of District Range: 66.6 (Stupak) to 0 (8-way tie)

All MSP (37)

5 from South, 10 from Northeast, 15 from Midwest, 7 from West

Median PVI: R+4

PVI Range: D+6 (Castle) to R+14 (Granger)

Median Progressive Punch 2007-08: 20.07

Progressive Punch 2007-08 Range: 39.71 (Gilchrest) to 4.57 (Camp)

Median Progressive Punch Chips Are Down: 6.74

Progressive Punch Chips Are Down Range: 25.29 (Gilchrest) to 1.14 (Calvert)

Median Progressive Punch Lifetime: 14.18

Progressive Punch Lifetime Range: 31.41 (Shays) to 4.64 (Granger)

Median National Journal Composite 2007: 39.3

National Journal Composite 2007 Range: 48.3 (Gilchrest) to 20.2 (Calvert)

Good votes on FISA: 1 (2.7%)

Good votes on ENDA: 20 (54.1%)

Good votes on Min. wage: 28 (75.7%)

Good votes on Stem cells: 24 (64.9%)

Good votes on SCHIP override: 21 (56.8%)

Median Rural % of District: 21

Rural % of District Range: 58.6 (Camp) to 0.4 (Kirk)

All RSC (109)

56 from South, 5 from Northeast, 22 from Midwest, 26 from West

Median PVI: R+11

PVI Range: R+1 (Chabot) to R+26 (Cannon)

Median Progressive Punch 2007-08: 4.18

Progressive Punch 2007-08 Range: 24.75 (Tim Murphy) to 0.62 (Lamborn and Jordan)

Median Progressive Punch Chips Are Down: 1.32

Progressive Punch Chips Are Down Range: 11.86 (Mario Diaz-Balart) to 0 (15-way tie)

Median Progressive Punch Lifetime: 3.8

Progressive Punch Lifetime Range: 23.96 (Alexander) to 0.62 (Lamborn and Jordan)

Median National Journal Composite 2007: 17.05

National Journal Composite 2007 Range: 39.5 (Mario Diaz-Balart) to 6.7 (7-way tie)

Good votes on ENDA: 3 (2.8%)

Good votes on Min. wage: 20 (18.3%)

Good votes on Stem cells: 6 (5.5%)

Good votes on SCHIP override: 5 (4.6%)

Median Rural % of District: 25.5

Rural % of District Range: 73.5 (Aderholt) to 0 (Royce and Roskam)

[Note: There are two RSC/MSP members: Dave Camp and Mike Turner.]

Unaffiliated Republicans (54)

22 from South, 9 from Northeast, 15 from Midwest, 8 from West

Median PVI: R+8

PVI Range: D+3 (Saxton) to R+23 (Deal)

Median Progressive Punch 2007-08: 9.14

Progressive Punch 2007-08 Range: 36.43 (Chris Smith) to 0.77 (Boehner)

Median Progressive Punch Chips Are Down: 2.83

Progressive Punch Chips Are Down Range: 16.38 (Walter Jones) to 0 (7-way tie)

Median Progressive Punch Lifetime: 6.76

Progressive Punch Lifetime Range: 24.5 (Paul) to 2.71 (Boehner)

Median National Journal Composite 2007: 25.3

National Journal Composite 2007 Range: 44.5 (Chris Smith) to 6.7 (Boehner)

Good votes on Iraq Supplemental: 2 (3.7%)

Good votes on FISA: 1 (1.9%)

Good votes on ENDA: 11 (20.4%)

Good votes on Min. wage: 32 (59.3%)

Good votes on Stem cells: 7 (13.0%)

Good votes on SCHIP override: 15 (27.8%)

Median Rural % of District: 29.8

Rural % of District Range: 78.7 (Harold Rogers) to 0 (Bill Young and Fosella)

[Note: The Iraq Supplemental vote referenced is HR 2206 Roll Call 425. The FISA vote is S 1927 Roll Call 836. These were the Iraq and FISA votes where party discipline broke down the most; however, there have been a large number of Iraq Supplemental and FISA votes, and a bad vote on one of these by a representative does not mean a consistently bad position. Some ENDA votes have ‘bad’ in quotes to reflect that a handful of very liberal representatives voted against ENDA, presumably, from the left for being inadequate. The Region categories follow the basic 4 Census Bureau regions, with the exception of me counting Maryland and Delaware as Northeast states.]

GA-12: Primary Challenge for John Barrow

The House race in Georgia’s 12th district just got a lot more interesting: after winning by 800-some votes in 2006, it was looking like John Barrow would get an almost-free ride against a third-tier GOP challenger with little money. However, Barrow is now getting a plausible challenge… in the primary. State Senator Regina Thomas is running against him.

Barrow is a Blue Dog, and has one of the most conservative records among House Democrats, by any measure: his Progressive Punch score for the 07-08 session is currently 67.80%, the lowest of any Dem. His Progressive Punch Chips are Down score is only 31.22%, 3rd worst of any Dem. National Journal’s score for him for the 2007 session was 45.8, which is also 3rd worst of the Dems, and actually more conservative than three Republicans. But unlike Blue Dogs with similar track records, who sit in districts that are R+10 or worse, Barrow is in a Democratic-leaning district (D+2). He’s one of the most glaring instances of a rep out of his step with his district’s lean.

Photobucket

Regina Thomas (no campaign site yet; this is her senate site) has been a state senator since 2000, representing part of Savannah. The 12th is bookended by the African-American parts of Augusta and Savannah, and contains a lot of rural territory in between.

Photobucket

The district is 44% African-American, so in all likelihood African-Americans make up well more than half of the Democratic electorate. (Thomas is African-American; Barrow is white.) Unlike Barrow, for starters, she’s opposed to the war in Iraq and pro-choice.

Ordinarily, I’m kind of lukewarm about running primary challenges against Blue Dogs and their ilk, but this race is something of a unique opportunity: perhaps the single most egregious example of a very conservative Dem in a Dem-leaning district, a viable challenger who already represents a sizable portion of the district as state senator, and unlike Lipinski vs. Pera, no urban machine propping up the incumbent. Thomas lacks two main things: probably very few people in the rest of the district (like Augusta, which will be key) know who she is… and money (as far as I can tell, she has none).

PVI vs. Vote Index: Only the Meaty Votes

(From the diaries – promoted by James L.)

I thought I’d continue with the PVI vs. Vote Index project begun here and continued here and here. It seems like almost every permutation involving the different ratings methods (Progressive Punch, Progressive Punch Chips Are Down, ADA, and National Journal Composite) has been tried out now, so I wanted to try a new approach: focusing on particular important votes, presenting a matrix that shows who broke with the party on what, and throwing PVI into the mix. (If you’re like me, you constantly forget why you’re supposed to be angry at a particular representative, so it’s handy to have everyone’s black marks on one handy chart.)

I chose six votes to start with, three where Democratic discipline really seemed to break down (Iraq supplemental, FISA, and ENDA), and three where Republican discipline broke down (minimum wage, stem cells, and SCHIP veto override). “Iraq supplemental” and “FISA” are particularly difficult categories, because there have been many votes on each, and a lot of Dems have gone for more nuanced positions than can be encapsulated with one vote. For these categories, I chose the vote on each topic where Democratic discipline seemed to break down the most, and correspondingly, where the blogosphere engaged in the loudest and angriest freakout: HR 2206 Roll Call 425 on Iraq and S 1927 Roll Call 836 on FISA. (The final votes on these topics had much higher party unity.)

For each party, I have a table of how many times a representative voted against the party. Within each table, representatives are listed in order of PVI from highest to lowest. This doesn’t create as neat and tidy a relationship as we’ve been doing with the more thorough scoring approaches… but it shouldn’t take too much imagination to look at each table and form a qualitative judgment as to who’s fitting the district and who isn’t.

I’m also including representatives with no votes against the party but who are in districts in what we’ll call the danger zone (D+5 to R+5). These ones, maintaining discipline in the face of potentially hostile districts, are the ones we might think of as analogous to the ‘overperformers’ from previous diaries on this topic. (No one on the wrong side of the danger zone, i.e. Democrats in districts of R+6 or greater… has complete party unity.)

By way of analysis, note that the same underperforming cast of characters stands out here as in the more rigorously quantitative approaches to the PVI vs. Vote question: Lipinski, Marshall, Barrow, Artur Davis, Cooper, Costa. Likewise, the Republican overperformers (the ones theoretically vulnerable because of their wingnuttiness) also look about the same: Chabot, Walberg, Rogers (MI), Feeney, Roskam, Kline.

The good news is (and this was noted in previous diaries in this series): being in the majority is a real tonic for party discipline. Note how many more Republicans than Democrats broke with the party 3, 4, or 5 times. (Many of them are also in affluent suburban D+ districts and are feeling the heat… except for Todd Platts, who seems to have come out of nowhere with a new Club for Growth-related deathwish.) For the Democrats who broke the party line multiple times, they’re almost always members of the Blue Dogs and coming from rural southern or Midwestern districts (again, with the glaring exception of Lipinski).

Democrats

5 votes

Rep. District PVI Votes
Marshall GA-08 R+8 Iraq, FISA, ENDA, Stem cells, SCHIP

4 votes

Rep. District PVI Votes
Lipinski IL-03 D+10 Iraq, FISA, ENDA, Stem cells
L. Davis TN-04 R+3 Iraq, FISA, ENDA, Stem cells
McIntyre NC-07 R+3 Iraq, FISA, ENDA, Stem cells
Shuler NC-11 R+7 Iraq, FISA, ENDA, Stem cells
G. Taylor MS-04 R+16 Iraq, FISA, ENDA, Stem cells

3 votes

Rep. District PVI Votes
Barrow GA-12 D+2 Iraq, FISA, ENDA
C. Wilson OH-06 D+0 Iraq, FISA, Stem cells
Tanner TN-08 D+0 Iraq, FISA, ENDA
Rahall WV-03 D+0 Iraq, ENDA, Stem cells
Donnelly IN-02 R+4 Iraq, FISA, Stem cells
Gordon TN-06 R+4 Iraq, FISA, ENDA
Melancon LA-03 R+5 Iraq, FISA, ENDA
Cramer AL-05 R+6 Iraq, FISA, ENDA
C. Peterson MN-07 R+6 Iraq, FISA, Stem cells
Ellsworth IN-08 R+9 Iraq, FISA, Stem cells
Lampson TX-22 R+15 Iraq, FISA, ENDA
C. Edwards TX-17 R+18 Iraq, FISA, ENDA

2 votes

Rep. District PVI Votes
A. Davis AL-07 D+17 FISA, ENDA
Cooper TN-05 D+6 Iraq, FISA
Costa CA-20 D+5 Iraq, FISA
Berry AR-01 D+1 Iraq, ENDA
Boswell IA-03 D+1 Iraq, FISA
Snyder AR-02 D+0 Iraq, ENDA
Ross AR-04 D+0 Iraq, ENDA
Walz MN-01 R+1 Iraq, FISA
Cuellar TX-28 R+1 Iraq, FISA
Boyd FL-02 R+2 Iraq, FISA
Stupak MI-01 R+2 Iraq, Stem cells
Etheridge NC-02 R+3 Iraq, FISA
Altmire PA-04 R+3 Iraq, FISA
Mitchell AZ-05 R+4 Iraq, FISA
Rodriguez TX-23 R+4 Iraq, FISA
Bean IL-08 R+5 Iraq, FISA
Boren OK-02 R+5 Iraq, FISA
Salazar CO-03 R+6 Iraq, FISA
Space OH-18 R+6 Iraq, FISA
Mollohan WV-01 R+6 Iraq, Stem cells
Hill IN-09 R+7 Iraq, FISA
Chandler KY-06 R+7 Iraq, FISA
Carney PA-10 R+8 Iraq, FISA
Skelton MO-04 R+11 Iraq, ENDA
Herseth SD-AL R+11 Iraq, FISA
Pomeroy ND-AL R+13 Iraq, FISA
Matheson UT-02 R+17 Iraq, FISA

1 vote

Rep. District PVI Votes
Towns NY-10 D+41 ENDA
Clarke NY-11 D+40 ENDA
Velazquez NY-12 D+34 ENDA
Nadler NY-08 D+28 ENDA
Wasserman Schultz FL-20 D+18 Iraq
Emanuel IL-05 D+18 Iraq
Andrews NJ-01 D+14 Iraq
Weiner NY-09 D+14 ENDA
Baca CA-43 D+13 Iraq
Levin MI-12 D+13 Iraq
Dingell MI-15 D+13 Iraq
S. Davis CA-53 D+12 Iraq
Kildee MI-05 D+12 Iraq
Clyburn SC-06 D+11 Iraq
D. Scott GA-13 D+10 Iraq
B. Thompson MS-02 D+10 Iraq
Hoyer MD-05 D+9 Iraq
Berkley NV-01 D+9 Iraq
Butterfield NC-09 D+9 Iraq
Kaptur OH-09 D+9 Stem cells
Reyes TX-16 D+9 Iraq
M. Udall CO-02 D+8 Iraq
Visclosky IN-01 D+8 Iraq
Ruppersburger MD-02 D+8 Iraq
Holt NJ-12 D+8 ENDA
Schwartz PA-13 D+8 Iraq
Gonzalez TX-20 D+8 Iraq
G. Green TX-29 D+8 Iraq
Higgins NY-27 D+7 FISA
Dicks WA-06 D+6 Iraq
Costello IL-12 D+5 Stem cells
Kanjorski PA-11 D+5 Iraq
Murtha PA-12 D+5 Iraq
Michaud ME-02 D+4 ENDA
Oberstar MN-08 D+4 Stem cells
Sestak PA-07 D+4 Iraq
Cardoza CA-18 D+3 Iraq
Hinojosa TX-15 D+3 Iraq
R. Larsen WA-02 D+3 Iraq
Kind WI-03 D+3 Iraq
S. Bishop GA-02 D+2 Iraq
Baird WA-03 D+0 Iraq
Giffords AZ-08 R+1 Iraq
Ortiz TX-27 R+1 Iraq
Mahoney FL-16 R+2 Iraq
Gillibrand NY-20 R+3 Iraq
D. Moore KS-03 R+4 Iraq
Kagen WI-08 R+4 Iraq
Spratt SC-05 R+6 Iraq
Boyda KS-02 R+7 Iraq
Holden PA-17 R+7 Iraq
Boucher VA-09 R+7 Iraq

0 votes

Rep. District PVI
Foster IL-14 R+5
McNerney CA-11 R+3
Arcuri NY-24 R+1
J. Hall NY-19 R+1
DeFazio OR-04 D+0
Shea-Porter NH-01 D+0
Doggett TX-25 D+1
Hooley OR-05 D+1
Obey WI-07 D+2
B. Miller NC-13 D+2
Yarmuth KY-03 D+2
Perlmutter CO-07 D+2
P. Murphy PA-08 D+3
T. Bishop NY-01 D+3
Hodes NH-02 D+3
Klein FL-22 D+4
C. Murphy CT-05 D+4
Braley IA-01 D+5
Hare IL-17 D+5
Lo. Sanchez CA-47 D+5

Republicans

4 votes

Rep. District PVI Votes
Castle DE-AL D+6 ENDA, Min. wage, Stem cells, SCHIP
Shays CT-04 D+5 ENDA, Min. wage, Stem cells, SCHIP
Kirk IL-10 D+4 ENDA, Min. wage, Stem cells, SCHIP
Gerlach PA-06 D+2 ENDA, Min. wage, Stem cells, SCHIP
Dent PA-15 D+2 ENDA, Min. wage, Stem cells, SCHIP
Reichert WA-08 D+2 ENDA, Min. wage, Stem cells, SCHIP
Fossella NY-13 D+1 ENDA, Min. wage, Stem cells, SCHIP
Ramstad MN-03 R+1 ENDA, Min. wage, Stem cells, SCHIP
Pryce OH-15 R+1 ENDA, Min. wage, Stem cells, SCHIP
Bono CA-45 R+3 ENDA, Min. wage, Stem cells, SCHIP
Platts PA-19 R+12 ENDA, Min. wage, Stem cells, SCHIP

3 votes

Rep. District PVI Votes
LoBiondo NJ-02 D+4 ENDA, Min. wage, SCHIP
H. Wilson NM-01 D+2 Min. wage, Stem cells, SCHIP
B. Young FL-10 D+1 Min. wage, Stem cells, SCHIP
McHugh NY-23 D+0 ENDA, Min. wage, SCHIP
T. Davis VA-11 R+1 ENDA, Stem cells, SCHIP
Upton MI-06 R+2 Min. wage, Stem cells, SCHIP
LaTourette OH-14 R+2 Min. wage, Stem cells, SCHIP
English PA-03 R+2 ENDA, Min. wage, SCHIP
C. Miller MI-10 R+4 ENDA, Min. wage, SCHIP
Regula OH-16 R+4 Min. wage, Stem cells, SCHIP
Biggert IL-13 R+5 ENDA, Min. wage, Stem cells
Capito WV-02 R+5 Min. wage, Stem cells, SCHIP
Freylinghuysen NJ-11 R+6 ENDA, Min. wage, Stem cells
Gilchrest MD-01 R+10 ENDA, Min. wage, Stem cells
Emerson MO-08 R+11 Min. wage, Stem cells, SCHIP
Walden OR-02 R+11 ENDA, Min. wage, Stem cells
D. Young AK-AL R+14 Min. wage, Stem cells, SCHIP

2 votes

Rep. District PVI Votes
Saxton NJ-03 D+3 ENDA, Min. wage
Walsh NY-25 D+3 Min. wage, SCHIP
P. King NY-03 D+1 Min. wage, SCHIP
Porter NV-03 D+1 ENDA, SCHIP
Latham IA-04 D+0 Min. wage, SCHIP
McCotter MI-11 R+1 ENDA, Min. wage
C. Smith NJ-04 R+1 Min. wage, SCHIP
Ferguson NJ-07 R+1 Min. wage, SCHIP
Tiberi OH-12 R+1 ENDA, SCHIP
Renzi AZ-01 R+2 Min. wage, SCHIP
T. Murphy PA-18 R+2 Min. wage, SCHIP
Turner OH-03 R+3 Min. wage, SCHIP
Dreier CA-26 R+4 ENDA, Stem cells
Buchanan FL-13 R+4 Min. wage, SCHIP
Ros-Lehtinen FL-18 R+4 ENDA, Min. wage
M. Diaz-Balart FL-25 R+4 ENDA, Min. wage
Brown-Waite FL-05 R+5 Min. wage, Stem cells
Kuhl NY-29 R+5 ENDA, Min. wage
Wolf VA-10 R+5 Min. wage, SCHIP
Petri WI-06 R+5 Min. wage, SCHIP
L. Diaz-Balart FL-21 R+6 ENDA, Min. wage
T. Johnson IL-15 R+6 FISA, Min. wage
Hobson OH-7 R+6 ENDA, SCHIP
Duncan TN-02 R+11 Iraq, Min. wage
W. Jones NC-03 R+15 FISA, Min. wage
Simpson ID-02 R+19 Min. wage, SCHIP

1 vote

Rep. District PVI Votes
Knollenberg MI-09 D+0 ENDA
Weller IL-11 R+1 Min. wage
P. Ryan WI-01 R+2 ENDA
Keller FL-08 R+3 Min. wage
Hayes NC-08 R+3 Min. wage
M. Rogers AL-03 R+3 Min. wage
Bilirakis FL-09 R+4 Min. wage
Bilbray CA-50 R+5 Stem cells
LaHood IL-18 R+5 Min. wage
Forbes VA-04 R+5 Min. wage
Calvert CA-44 R+6 Stem cells
Rohrabacher CA-46 R+6 Stem cells
Goode VA-05 R+6 Min. wage
McKeon CA-25 R+7 Stem cells
McCrery LA-04 R+7 ENDA
Hulshof MO-09 R+7 Min. wage
McMorris WA-05 R+7 SCHIP
Campbell CA-48 R+8 ENDA
Stearns FL-06 R+8 Min. wage
Shimkus IL-19 R+8 Min. wage
H. Rogers KY-05 R+8 Min. wage
Heller NV-02 R+8 Stem cells
Wamp TN-03 R+8 Min. wage
J. Lewis CA-41 R+9 Stem cells
Ehlers MI-03 R+9 Min. wage
Issa CA-49 R+10 Stem cells
Mack FL-14 R+10 Stem cells
Whitfield KY-01 R+10 Min. wage
Alexander LA-05 R+10 Min. wage
J. Peterson PA-05 R+10 Min. wage
Boozman AR-03 R+11 Min. wage
Rehberg MT-AL R+11 SCHIP
Goodlatte VA-06 R+11 Min. wage
Bonner AL-01 R+12 Min. wage
Flake AZ-06 R+12 ENDA
G. Davis KY-04 R+12 Min. wage
Poe TX-02 R+12 Min. wage
Everett AL-02 R+13 Min. wage
Schmidt OH-02 R+13 Min. wage
Granger TX-12 R+14 Stem cells
Paul TX-14 R+14 Iraq
Barton TX-06 R+15 Stem cells
Marchand TX-24 R+15 Min. wage
Aderholt AL-04 R+16 Min. wage
Crenshaw FL-04 R+16 Min. wage
L. Smith TX-21 R+16 Min. wage
Coble NC-06 R+17 Stem cells
J. Moran KS-01 R+20 Min. wage
Bachus AL-05 R+25 Min. wage

0 votes

Rep. District PVI
Chabot OH-01 R+1
Walberg MI-07 R+2
M. Rogers MI-08 R+2
Feeney FL-24 R+3
Roskam IL-06 R+3
Kline MN-02 R+3
Reynolds NY-26 R+3
Mica FL-07 R+4
Weldon FL-15 R+4
Manzullo IL-16 R+4
Camp MI-04 R+4
Garrett NJ-05 R+4
Gallegly CA-24 R+5
Putnam FL-12 R+5
Bachmann MN-06 R+5
Graves MO-06 R+5

This should be considered a work in progress, with improved versions likely to be published in the future, so please feel free to suggest 1) better ways of displaying this data (I intended to make the tables sortable, but SSP’s code doesn’t seem to allow that), and 2) what other 2007-08 votes are particularly important as litmus tests. There were a few others I was considering instead of ENDA, like the Employee Free Choice Act (not enough Dem defections) and the Peru trade agreement (not a clear liberal/conservative split… more of an internationalist/populist split in each party), so I’ll certainly consider adding additional categories.

UPDATE: Link to Google Docs for a copy of the spreadsheet here. I threw in Progressive Punch scores in case anyone wants to correlate votes on these big 6 against the broader scores.

The PVI-Voting Pattern Index

(Phenomenal work. Promoted from the diaries with an edit to the title by DavidNYC.)

Lots of people in the blogosphere want to primary Bad Dems. Used wisely, that’s a good thing. It can wake up a Blue Dog on cruise control in a dark blue district (Jane Harman); sometimes, it can even lead to a victory and a Better Dem (Donna Edwards).

Unfortunately, I’ve never seen any sort of metric that helps us decide who’s a worthwhile primary target, i.e. who’s way out of whack with his or her district, versus someone who’s an odious Blue Dog but who’s the best we can manage in a red district and someone to be welcomed into the big tent (if sometimes secretly grumbled about). So, here’s my stab at it.

It’s based on this proposition: the representative in the most liberal district should have the most liberal voting record. The representative in the most conservative district should have the most conservative voting record. The representative in the 217th most liberal district should have the 217th most liberal voting record. And so on. Of course, in reality, it doesn’t always work like that. But finding the representatives whose voting records are severely mismatched with their districts’ lean helps us find the Bad Dems who need some prodding. And as a bonus, it also helps us find the Republicans who should theoretically be extra vulnerable in a general election: the wingnuts hiding in moderate districts.

To that end, I’ve developed the PVI-Voting Pattern Index. It simply rates every district from most Democratic to most Republican in its presidential preference, and rates every representative from most liberal to most conservative, and looks at the differentials.

Let’s start with the Dems who are underperforming their districts: in other words, the ones with super-safe districts who are voting in the middle of the pack, or ones with bluish districts who are voting conservatively.

Rep. District PVI PVI rank PP NJ Liberal rank Difference
A. Davis AL-07 D+17 62 91.77 61.3 179 -117
Meek FL-17 D+35 10 94.76 76.5 117 -107
Rangel NY-15 D+43 2 94.85 80.3 105 -103
Jefferson LA-02 D+28 26 95.14 73 121 -95
E.B. Johnson TX-30 D+26 29 93.97 77.7 123 -94
Fattah PA-02 D+39 4 94.95 82.2 96 -92
Lipinski IL-03 D+10 102 90.93 54.7 191 -89
S.T. Jones OH-11 D+33 16 95.28 79 104 -88
Doyle PA-14 D+22 39 94.58 75.2 125 -86
C. Brown FL-03 D+16 64 94.39 67.7 142 -78
R. Brady PA-01 D+36 8 95.35 84 83.5 -75.5
Rush IL-01 D+35 11 95.61 82.8 86.5 -75.5
Meeks NY-06 D+38 6 96.24 83.3 76 -70
Engel NY-17 D+21 44 93.12 83.3 111 -67
Lynch MA-09 D+15 68 94.07 72.3 135 -67
G. Green TX-29 D+8 124 91.21 56.5 189 -65
Towns NY-10 D+41 3 96.37 84.2 67 -64
T. Ryan OH-17 D+14 73 94.36 70.3 136 -63
M. Udall CO-02 D+8 121 90.94 60.2 184 -63
Serrano NY-16 D+43 1 97.54 78 63 -62
J. Cooper TN-05 D+6 139 85.7 54.7 200 -61
Berkley NV-01 D+9 115 92.01 61.8 173 -58
P. Stark CA-13 D+22 40 96.24 75.2 98 -58
Reyes TX-16 D+9 111 92.54 61.8 166.5 -55.5
Sires NJ-13 D+23 37 95.67 80.3 92 -55
Cummings MD-07 D+25 32 96.51 77.5 86.5 -54.5
Maloney NY-14 D+26 31 96.06 80 85 -54
Capuano MA-08 D+33 20 97.16 79.2 73.5 -53.5
Emanuel IL-05 D+18 57 95.96 72.3 110 -53
Barrow GA-12 D+2 178 68.22 45.8 228.5 -50.5

Frankly, I was surprised to see so many members of the Congressional Black Caucus on the list, especially since most of the ones on the list have pretty progressive records (although it certainly does shine the spotlight on the ones with more centrist records, like Artur Davis and Kendrick Meek… those two, plus Greg Meeks, are the only members of both the CBC and the New Democrat Caucus). The formula is pretty unforgiving, and it can be hard to live up to having one of the most Democratic leaning seats in the nation.

It may be more interesting to focus on people who have the less safe seats, but not so dangerous as to justify sketchier voting records. Mr. Lipinski you’re all familiar with, but this list also points, for instance, to Jim Cooper, a Blue Dog in a D+6 seat based in Nashville, or John Barrow, the second most conservative Democrat in the House, who sits in a D+2 seat.

Now, let’s turn to the good news: the Democrats who are vastly overperforming their districts. These are a mix of Blue Dogs holding down the fort in some of the nation’s most conservative districts, and flat-out progressives based in light-blue or swing districts.

Rep. District PVI PVI rank PP NJ Liberal rank Difference
C. Edwards TX-17 R+18 406 89.55 53.7 196 210
Pomeroy ND-AL R+13 360 90.61 61.3 183 177
Matheson UT-02 R+17 397 77.65 49.2 220 177
G. Taylor MS-04 R+16 393 73.46 46.3 225.5 167.5
Lampson TX-22 R+15 380 71.24 47 227 153
Skelton MO-04 R+11 339 89.50 54.3 195 144
Hinchey NY-22 D+6 142 98.02 92.5 12 130
Herseth SD-AL R+11 328 86.43 53.7 204.5 123.5
Price NC-04 D+6 141 97.42 90.7 24 117
Boucher VA-09 R+7 297 91.91 58.3 181.5 115.5
Spratt SC-05 R+6 279 91.54 63.7 170.5 108.5
Capps CA-23 D+9 112 98.29 94 6.5 105.5
Chandler KY-06 R+7 294 90.48 55.3 193 101
Filner CA-51 D+7 132 97.23 91.5 32 100
Holt NJ-12 D+8 128 97.42 89.7 28 100
Boyda KS-02 R+7 301 85.66 53.8 204.5 96.5
Holden PA-17 R+7 293 89.75 53.2 197 96
Mollohan WV-01 R+6 281 92.00 56.7 185 96
Shea-Porter NH-01 D+0 197 95.39 78.5 102.5 94.5
Grijalva AZ-07 D+10 107 98.53 89.2 15 92

Now, let’s look at the Republicans. A low OWI score shows which GOP representatives are, as it were, overperforming their lean of their districts, by being hardcore dead-enders in districts that should elect moderates, or better yet, Democrats.

Rep. District PVI PVI rank PP NJ Liberal rank Difference
Kline MN-02 R+3 228 2.11 9.3 400 -172
Feeney FL-24 R+3 236 2.18 12 396 -160
Chabot OH-01 R+1 201 5.25 17.5 353 -152
Mica FL-07 R+4 248 3.2 8.3 394 -146
Bachmann MN-06 R+5 266 1.48 10.8 405 -139
P. Ryan WI-01 R+2 218 3.97 20.3 352 -134
Garrett NJ-05 R+4 253 3.10 14.7 383 -130
Shadegg AZ-03 R+6 284 2.23 6.7 409 -125
Walberg MI-07 R+2 226 3.80 20.7 350 -124
Roskam IL-06 R+3 232 5.05 16.8 355 -123
Putnam FL-12 R+5 274 2.62 12.3 390 -116
Franks AZ-02 R+9 315 0.74 6.7 421 -106
S. King IA-05 R+8 311 1.12 8.8 414 -103
Gallegly CA-24 R+5 260 6.19 14 360 -100
Tiberi OH-12 R+1 205 8.12 25.3 304 -99
Fossella NY-13 D+1 186 11.51 29.7 285 -99
H. Wilson NM-01 D+2 173 19.26 31.7 272 -99
P. King NY-03 D+2 179 18.78 27.8 277 -98
M. Rogers MI-08 R+2 216 6.53 22.2 314 -98
Latham IA-04 D+0 190 13.10 26 287 -97

It’s heartening to see that a lot of these guys are already being targeted by the DCCC this cycle (Feeney, Chabot, Bachmann, Walberg, Shadegg). Also, I see more names that are on the “Races to Watch” lists of a lot of people here (Kline, Garrett).

Finally, let’s look at the Republicans who are more moderate than their districts would predict. There isn’t that much we can do with this list, other than thank them (or sit back and watch as the Club for Growth primaries them, as we saw with Wayne Gilchrest this year), so I’m just holding it to 10 names. It’s an interesting mix of representatives from red districts who’ve turned against the war, and very conservative representatives from super-red districts who just aren’t as crazy as the voters in their districts.

Rep. District PVI PVI rank PP NJ Liberal rank Difference
W. Jones NC-03 R+15 383 27.48 42 236 147
Simpson ID-02 R+19 408 18.92 33.2 270 138
J. Moran KS-01 R+20 413 12.69 34.7 275.5 137.5
Paul TX-14 R+14 379 16.72 39.8 259 120
Platts PA-19 R+12 357 21.76 38.5 251 106
Gilchrest MD-01 R+10 327 39.71 48.3 224 103
D. Young AK-AL R+14 368 16.05 35.8 270 98
Coble NC-06 R+17 403 5.61 27.8 305 98
Aderholt AL-04 R+16 387 10.20 26.8 290 97
Emerson MO-08 R+11 342 22.80 39.8 245.5 96.5

Some of the more observant of you might be wondering about how there’s one name missing… the name that’s come to signify that Bad Dems can, in fact, be beaten? Some of the others of you might be wondering who are the representatives who exactly match their districts, with almost no difference between their record and the district’s lean? Well, the answer to both of those questions is: Al Wynn. Somewhat surprisingly, for his 2007 voting record, he was right on the mark. MD-04, at D+30, is the 23rd most Democratic district. He had a Progressive Punch score of 97.14 and a National Journal score of 95, making him the 22nd most liberal representative. That’s a differential of 1.

So what does that mean? Did we target the wrong man? Nope… turns out, savvy politician that he is, he veered sharply to the left in 2007, worried by his previous narrow primary victory and anticipating the rematch. Here’s a chart that illustrates the U-turn: Progressive Punch also puts together lifetime scores, so I compared those against district lean too. Observe how most of the Lifetime Bad Dems are the same as the 2007 Bad Dems, but check out who’s #2 on the list:

Rep. District PVI PVI rank Lifetime PP Liberal rank Difference
Doyle PA-14 D+22 42 76.23 200 -158
Wynn MD-04 D+30 24 86.23 142 -118
Jefferson LA-02 D+28 27 86.54 140 -113
A. Davis AL-07 D+17 65 82.49 172 -107
Crowley NY-07 D+28 28 87.72 134 -106
Meek FL-17 D+35 10 88.70 116 -106
R. Andrews NJ-01 D+14 77 80.69 182 -105
R. Brady PA-01 D+36 8 89.25 108.5 -100.5
J. Moran VA-08 D+14 81 81.40 178 -97
Meeks NY-06 D+38 6 89.56 100 -94

Now, Wynn’s turnaround of 10.91, from a lifetime score of 86.23 to a 2007 score of 97.14, wasn’t the biggest gain of any Democrat… not by a long shot. The biggest jumps, perhaps unsurprisingly, were among the Blue Dogs, who had lower scores to begin with, and an opportunity to make up more ground by voting with the new Democratic majority. The biggest jump belonged to Ike Skelton, who went from 63.46 to 89.5, and the 3rd biggest jump was John Murtha, shooting up from 70.85 to 94.67.

In fact bigger jumps were shown by many of the other Dems subject to internal challenges or the threat thereof, often at the behest of the netroots: Jane Harman (who’s #13 on the Lifetime Bad Dem list) went from 79.08 to 93.32, Ellen Tauscher went from 84.01 to 95.97, and even Henry Cuellar beat Wynn, going from 74.25 to 85.24. (In case you’re wondering, only one Dem went in reverse: Nick Lampson went from a lifetime score of 75.28 to a 2007 score of 71.24, perhaps to compensate for his new very red district.)

So, there’s something here for both people from the “more” Democrats school and the “better” Democrats school to chew on. Primary challenges can sometimes be effective, but they have to be chosen wisely, and the best targets may not always be the most conservative. Also, there’s a lot of low-hanging fruit in the form of unpleasant right-wingers in light-red and swing districts; let’s get picking!

Methodological notes: Districts are rated according to PVI. There would be a lot of ties if I just used the Cook PVI ratings, so I took the actual vote totals in each district and used the PVI formula to recalculate PVIs to enough significant digits where aren’t any ties.

Representatives are rated according to the 2007-08 Progressive Punch scores and their 2007 National Journal composite scores, to smooth out any hiccups caused by one or the other compilers’ methods. To further increase the sample size I would have liked to also include DW-Nominate scores (which don’t cherry-pick votes but include all votes and measure representatives’ deviations from each other), but those won’t be published for the 110th Congress until it’s over in 2009, and to include ADA scores, but there isn’t enough differentiation there (for instance, 78 different representatives got a score of 95). Rather than averaging their two scores (where you run into an apples & oranges problem) and ranking the averaged scores, I ranked each representative from 1 to 422 on each score, then averaged their two rankings, then ranked the averaged rankings.

Here’s an example: Mike McIntyre is the midpoint for the House, at the 211th most liberal (or conservative) representative. He has a Progressive Punch score of 84.31, which is 208th. He has a National Journal score of 49.5, for a rank of 217.5 (a tie at 217th). The average of those is 212.75. An averaged score of 212.75 makes him the 211th overall. His district, NC-07, has a PVI of R+3.5271, the 230th most Democratic district in the nation. Subtract 211 from 230 for an OWI score of +19. Not much difference; he’s very slightly overperforming his district.

Wait… why are there only 422? Well, there are four open seats (those formerly held by Lantos, Jindal, Baker, and Wicker). Also, there are nine representatives for whom there wasn’t enough information to calculate a National Journal score (Richardson, Broun, Foster, Carson, Tsongas, Latta, and Wittman are all too new, while Cubin has missed too many votes and Pelosi ordinarily doesn’t vote). For each of these missing representatives, I also didn’t rank the district lean, so that the lean of open districts wouldn’t cause any distortion. For the last table on lifetime PP scores, there was a pool of 431, for which I re-ranked the lean of their 431 districts, so there may be some slight difference in district rankings compared with the other charts.

I fully acknowledge that these rankings don’t incorporate where their money comes from, who their back-room friends are, what they say in front of the cameras, how they frame things, or anything other than how they vote, but that’s the only thing that can be fairly quantified.

UPDATE: There have been some calls to make the whole database available, so I’ve done just that. It’s at Google Documents.

Districts That Swung the Most From 2000 to 2004

I stumbled on this topic when I was thinking of posting in the AL-05 diary that this was one of the districts that had swung the hardest to the right from 2000 to 2004, as measured by Gore % vs. Kerry %. That left me wondering if that was really the case, though, and I did some quick database manipulation. In fact, while Kerry did suffer an embarrassing drop in this district (4.3% lower than Gore, from 43.8% in 2000 to 39.5% in 2004), it was only the 35th worst drop for the Dems. Many of the ones that were worse really surprised me, and since this is a good place for discussing minutiae like this, I thought a diary on the topic might be a good conversation-starter. (PVI, as most of us here know, is the best shorthand for a district’s lean, but it averages out the results from 2000 and 2004 and one weakness it has it that it doesn’t indicate the direction the votes moved between 2000 and 2004.)

Biggest drops:

Rank District % change PVI
1 NY-09 11.2% D+14
2 TN-06 9.5% R+4
3 AL-04 9.4% R+16
4 NY-13 7.9% D+1
5 CA-47 7.7% D+5
6 TN-04 7.5% R+3
7 FL-19 6.5% D+21
8 TN-07 6.5% R+12
9 NJ-04 6.5% R+1
10 TN-01 6.1% R+14
11 OK-02 5.9% R+5
12 TX-15 5.7% R+1
13 CA-43 5.6% D+13
14 OK-03 5.5% R+18
15 AL-03 5.5% R+4
16 OK-04 5.2% R+13
17 TX-27 5.2% R+1
18 NY-03 5.1% D+2
19 FL-20 5.1% D+18
20 NJ-02 5.1% D+4

I see four different trends at work here… none of which indicate a potentially damaging long-term trends in any of these areas.

1) 9-11 districts, for want of a better word. These are white ethnic districts in the New York metro area (and where retirees from these districts are found, i.e. the Jersey Shore and Broward County, Florida) where the impacts of 9-11 were felt the most, both actually and in terms of perception, and there was a rally-around-the-President effect (whether it was out of fear or jingoism is unclear, but it’s not likely to be as much of a factor next time).

2) Tennessee, where Gore benefited (somewhat) from favorite son status and Kerry necessarily fell off.

3) Predominantly white districts in Oklahoma and Alabama, two states that the Kerry campaign essentially wrote off and where highbrow Yankees are particularly unlikely to play well. Not so much of a problem if we have a presidential candidate running a 50-state strategy this time.

4) Certain heavily Latino districts in Texas’s Rio Grande Valley and southern California suburbs, where apparently Bush’s Latino outreach efforts paid off some dividends. These districts already lean a bit more conservative than the more urban heavily Latino districts, and at any rate, with the 2006 election as an indicator, the GOP’s new tactics on immigration are likely to wipe out these gains and then some.

Biggest gains:

Rank District % change PVI
1 VT-AL 8.3% D+8
2 CA-06 8.2% D+21
3 MN-05 8.2% D+21
4 CA-01 8.0% D+10
5 AK-AL 7.9% R+14
6 CA-08 7.5% D+36
7 CO-01 7.5% D+18
8 WA-07 7.4% D+30
9 GA-13 7.4% D+12
10 CA-09 7.4% D+38

I decided to stick with only 10 on this table because these aren’t as surprising: strongly Dem, mostly urban districts where there was a strong Nader effect in 2000 and most left-leaning voters returning to Kerry in 2004. The only exceptions are Alaska (again, explained by the lack of Nader) and GA-13, a suburban district where the African-American percentage of the population has shot up tremendously.

OR-05: Darlene Hooley to Retire

Uh oh; we finally have a Democratic open seat for 2008 that isn’t an automatic hold. The Oregonian (via Blue Oregon) reports that Darlene Hooley is retiring in OR-05.

She says:

Hooley, 68, who spent time in the hospital in November, said health was not a reason for her decision not to seek a seventh term. “I’ve never felt better,” she said in an interview.

Instead, she said it was the cumulative effect of arduous travel, the relentless demands of fund-raising and 32 years of public service that converged into a decision.

“At some point in everybody’s life you have to decide, how much longer do I want to do this?” she said.

“It’s time to move on.”

OR-05 is a D+1 district. Hooley has represented it since 1996 (when she beat Jim Bunn, one of the more aberrant members of the Class of 94). She’s a New Dem, and somewhat to the right of the Dem caucus’s midpoint with a Progressive Punch score in the low 80s.

This district has a Democratic tradition, but it currently has a 5,000 registered voter edge for the GOP. The district is a mix of Portland burbs (the more affluent ones lean GOP, the more middle-class ones lean Dem), exurbs (very GOP), Salem (lean Dem), part of Corvallis (very Dem), and rural farm areas (very GOP). It has a rapidly growing Latino population, but they probably aren’t voting much yet. (It’s currently 81% white, 13% Latino. It’s Oregon’s 2nd most affluent district, although that’s certainly skewed upwards by burbs like Lake Oswego and West Linn.)

Mike Erickson, who ran in 2006, is running again on the GOP side. He held her to about 55-45 in 2006 and can self-finance, so he has the potential to make this a very competitive race.

PolitickerOR speculates that her chief of staff, Joan Mooney Evans, will leap into the race. Another possibility they mention is new House Majority Leader Dave Hunt. A name that also occurred to me is Jim Hill, who used to represent Salem in the state senate, then was state treasurer, and most recently primaried governor Ted Kulongoski from the left in the 2006 election.

Bottom line: this will be the Dems’ most difficult open seat to hold, although that’s mostly by virtue of their other open seats being pretty easy. Erickson has an advantage in running a second time, but he’ll be going uphill against another blue tide, and the Dems have a decent bench to pick from here.