The Wyoming Rule revisited

There was a diary that (inaccurately) listed the number of seats each state would get per the “Wyoming rule”, which was deleted, presumably due to its in accuracies.

This got me thinking about the whole issue of uneven representation and why the Wyoming rule is not a very good solution to the problem.

Under the current reapportionment scheme, the rep from Montana represents 994,416 people, while a rep from Rhode Island would represent 527,623 people, which is a ratio of 1.88.  The “Wyoming Rule” would mandate that the house districts be set at the size of the smallest state (ie. Wyoming) to correct this inequity. This would increase the size of the house to 544.

However the inequity doesn’t go away, just shrinks slightly. Alaska still has 721,523 people per rep, while South Dakota has 409,880, a ratio of 1.76.  By adding over 100 new members to the house, you only drop the ratio by 0.12.

What would by a “fair” maximum inequity? 1.5? 1.3? 1.1?  Those would require 843, 1392, and 3265 representatives respectively.

So in conclusion, the Wyoming rule does not work, and the other only fix would be to have a huge house or to amend the constitution to allow house districts to cross state lines.

The source for this is a modified version of this perl script:

http://www.thegreenpapers.com/…

If you want to see my modifications, let me know and I’ll post them in comments.

Here are the number of seats under the “Wyoming rule”:

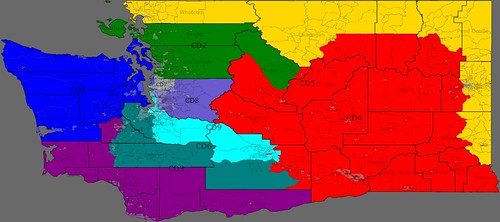
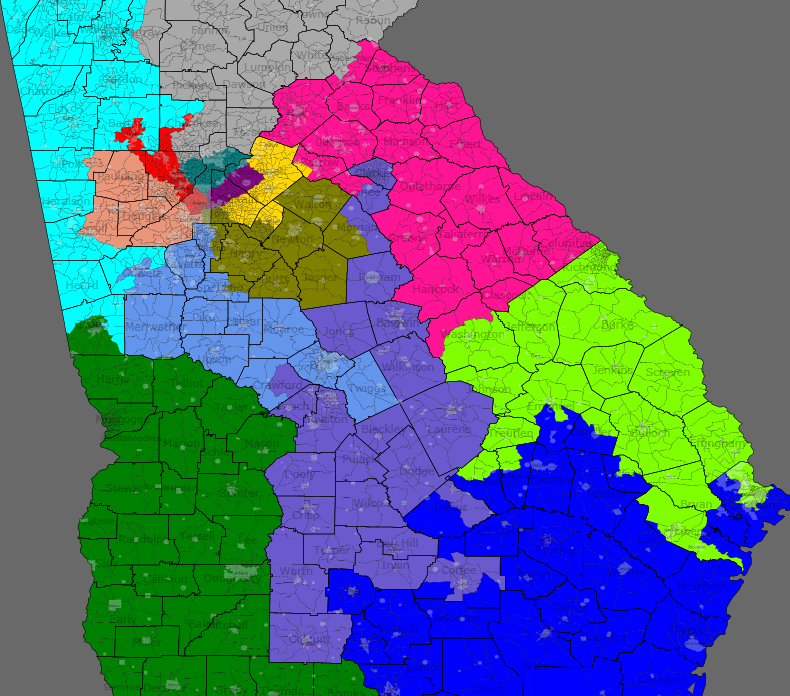
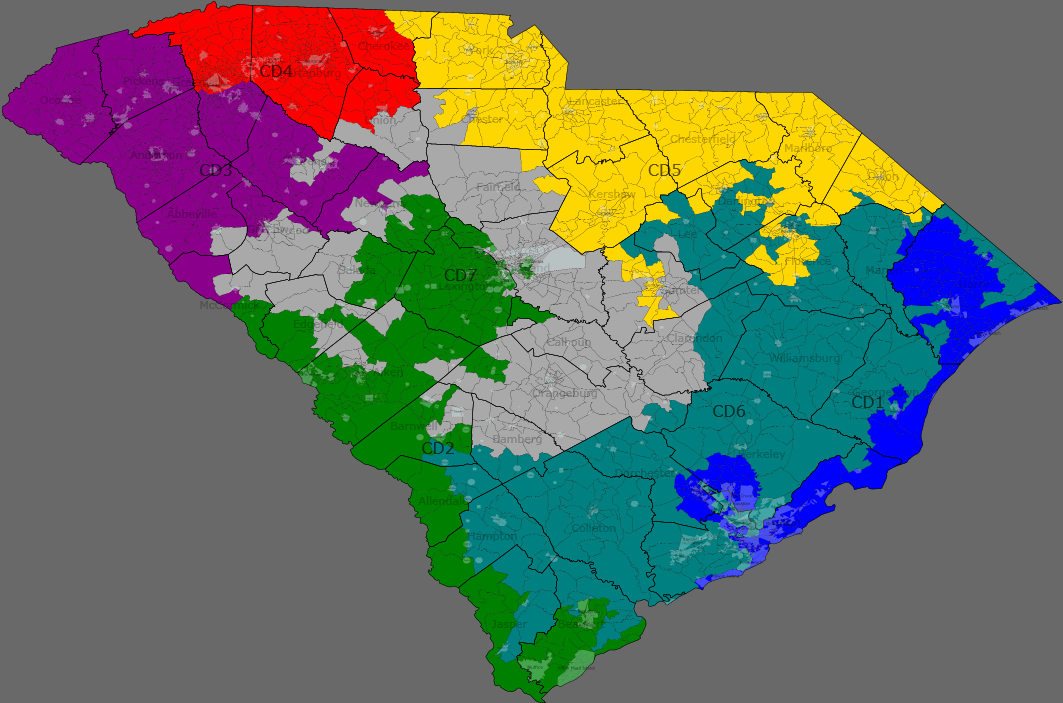
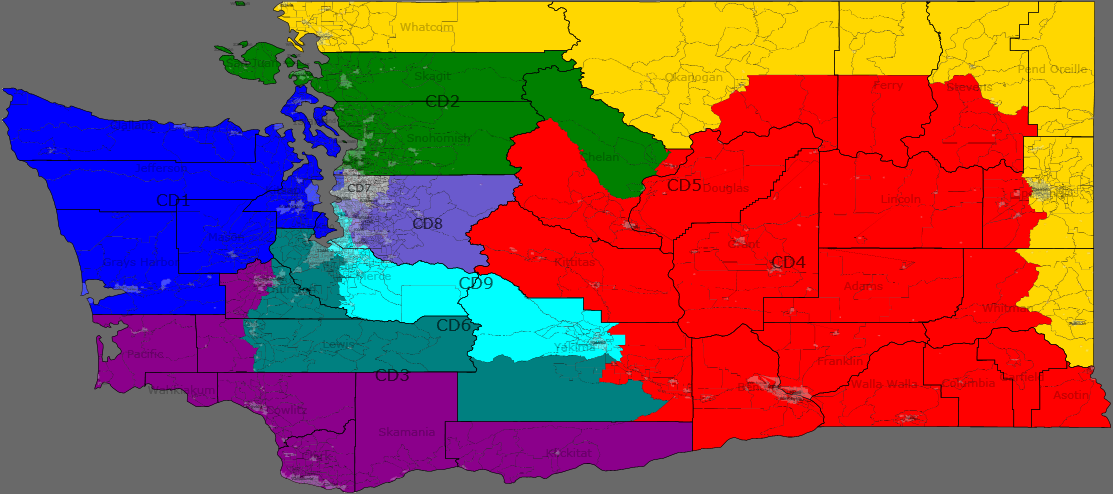
AL-8,AK-1,AZ-11,AR-5,CA-66,CO-9,CT-6,DE-2,FL-33,GA-17,HI-2,ID-3,IL-23,IN-11,IA-5,KS-5,KY-8,LA-8,ME-2,MD-10,MA-12,MI-18,MN-9,MS-5,MO-11,MT-2,NE-3,NV-5,NH-2,NJ-16,NM-4,NY-34,NC-17,ND-1,OH-20,OK-7,OR-7,PA-22,RI-2,SC-8,SD-2,TN-11,TX-45,UT-5,VT-1,VA-14,WA-12,WV-3,WI-10,WY-1

With 843 seats, the most underrepresented state would be South Dakota, and the most overrepresented state would be Wyoming, both with 2 seats, for a ratio of 1.44.

With 1392 seats, the most underrepresented state would be Alaska and again Wyoming would be most overrepresented, each with 3 seats, for a ratio of 1.27.

With 3265 seats, the most underrepresented state would be Hawai’i, with 14 seats, and the most overrepresented state would be Vermont, with 7 seats, for a ratio of 1.08.

A 14-4 GOP (Dummy?)mander of PA

Following dramatic gains in the House of Representatives, I think most state legislatures controlled by the Republicans will try to be aggressively maximize their seats.  After 2008, we were proposing 28-0 maps of New York and assuming anything that went even slightly for Obama would be ours in perpetuity, so the Republicans are likely having similar thoughts now.  With that preface, I present my map of Pennsylvania.

The whole State

PA-05, Gold, 52%M 46%O

G.T. Thompson (R)

The 5th takes half of Erie, becoming more Democratic, but it had some room to spare.

PA-09, Cyan, 54%M 44%O

Bill Shuster (R) vs Mark Critz (D)

Johnstown is severed from the 12th district a lumped in with the more conservative 9th.  Critz may choose to run in the new 12th instead.

Southeast

PA-01, Blue, 85%O 14%M

Bob Brady (D)

This district shifts to the North some, losing the tentacle to Chester while grabbing white liberal areas in Delaware and Montgomery counties, but retails its Black plurality (43%).

PA-02, Green, 91%O 9%M

Chaka Fattah (D)

Still a Black majority district but less so (52%).  Gains some of the Hispanic parts of Philly, while losing some of West Philly to the 1st district.

PA-13, Salmon, 64%O 35%M

Allyson Schwartz (D)

Little known fact: The current 13th was drawn to be winnable by a Republican.  Not any longer.  The new form is quite sinuous, picking up as many dem areas in the Philly burbs as possible.  

PA-06, Teal, 51%O 48%M

Jim Gerlach (R)

While this district bears rather little in common with its former self, it is significantly more Republican than the old 6th which went 58% for Obama.

PA-07, Gray, 50%O 50%M

Pat Meehan (R)

We trade urban parts of Delaware county for some rural parts of Chester and Lancaster, making the district safer. It now went for Obama by only 127 votes.

PA-08, Periwinkle, 52%O 47%M

Mike Fitzpatrick (R)

Still a Bucks County centered district, it does some precinct swapping with the 13th to become marginally more Republican.

PA-16, Lime, 52%M 46%O

Joe Pitts (R)

The 16th now stretches from South Philly to Chambersburg.  Pitts will have to introduce himself to a lot of new voters, since most of his former territory has been moved to other districts.

PA-18, Yellow, 53%M 46%O

Todd Platts (R)

This district is actually a good fit for the moderate Platts, giving him the rapidly Bluing cities of York, Lancaster and Lebanon as well as some Conservative rural areas connecting them.

Northeast

PA-17, Indigo, 53%M 46%O

Open or Tim Holden (D)

In attempt to get rid of Holden, his home county (Schuylkill) is removed from the district and more conservative territory to the West is substituted.  He may choose to run here anyway or he may run in the 11th.

PA-15, Orange, 56%O 43%M

Charlie Dent (R)

The 15th is not strengthened or significantly changed since Dent rather effortlessly survived both ’06 and ’08.  If it ain’t broken, don’t fix it.

PA-11, Chartreuse, 51%O 48%M

Lou Barletta (R) vs Tim Holden (D)

This district is made significantly more Republican, but it may not help if Barletta gets tossed in front of the legendary Holden steamroller.  Of course Holden hasn’t had serious challenge in years so he may be rusty and Barletta may be able to ride anti-immigrant sentiment to victory.  Holden may also choose to run in the 17th.  Even then Barletta may not be completely safe, but I did warn you that this map was a reach.

PA-10, Pink, 51%O 48%M

Tom Marino (R)

Marino better hope 2012 is good year for the GOP because adding Scranton makes this an Obama district and he doesn’t have much time to get established.

Southwest

PA-03, Purple, 53%M 45%O

Mike Kelly (R)

Losing part of Eire makes this district safer.

PA-04, Red, 55%M 44%O

Jason Altmire (D) vs Timothy Murphy (R)

Here we try to eliminate narrow 2010 survivor Altmire by setting up a dogfight between him and long time rep Murphy.  While the district is not any more Republican than the current 4th, The territory just over half from the old 18th and he would be up against a fellow incumbent.

PA-14, Olive, 68%O 31%M

Mike Doyle (D)

Not much change here.

PA-12, Cornflower Blue, 55%M 43%O

Open or Mark Critz(D)

If Critz tries to run here rather than the 9th, he’ll find it more Republican than his old district, where he only narrowly survived 2010.

Two Gerrymanders of West Virginia

Since it is one of the states the Dems completely control, I decided to look some at what could be done in West Virginia. Two objectives came to mind:

– Shore up Rahall

– Make life difficult for McKinley

Here is my first map:

The second district (in green) is designed to soak up as many Republican areas as possible and is around 61% McCain.  The first district (in blue) is now up about 45% Obama, while the third district clocks in at just over 46% Obama.  This is compared with 42% that Obama got in both districts in their current form.

Capito Moore lives in Charleston, so she might run for statewide office rather than in the new second, but should she decide to stay in congress her non-residency should be a non-issue, given her popularity.

This got me thinking: Is 46% Obama really the best we can do in West Virginia?  Only 7 counties went for Obama and they’re scattered throughout the state.  

This lead to my second map:

The 11 counties entirely contained in the 2nd (green) district went for Obama by just over 2000 votes.  Once you include the connective strips, it probably flips to McCain, but not by very much. With precinct data I’m sure it would be possible to create something similar that actually went Dem in 2008.

I wouldn’t actually recommend such a map.  Not only does it strengthen McKinley, it puts Capito Moore in the intended D second district and Rahall and his Beckley base in the now more Republican third. Nevertheless, I thought it an interesting experiment.

A possible Gerrymander of Massachusetts

The assumption behind this map is that Capuano runs for Senate and all other incumbents are protected.  All cities and towns are kept intact, excepting Boston.

Boston Detail:

1st district – Oliver (Blue)

Gains some Worcester suburbs and some 495 belt towns, which makes it slightly more conservative, but at D+14 it has some room to spare.

2nd District – Neal (Green)

Adds a couple Republican towns in the East and Democratic ones in the West, overall not much changed.

3rd District – McGovern (Purple)

Keeps its Worcester and Fall River anchors, in fact gaining the portion of Fall River that Frank used to have.  The district shifts slightly, losing the Northern suburbs of Worcester and gaining other towns in Norfolk and Bristol counties.  Overall, not much change in partisan composition.

4th District – Frank (Red)

Like the 3rd, this district retains it’s anchors, but shifts slightly East.

5th District – Tsongas (Gold)

This district is made safer, swapping its 495 belt towns for more liberal towns in the Metrowest area.  (Fun fact: Framingham, at 67,000 inhabitants, is the largest town in New England)

6th District – Tierney (Teal)

Embattled rep Tierney needs some shoring up, so he gets the biggest prize from Capuano’s district: Cambridge and Somerville.  While this should make him safe in the general, if Tierney’s ethics troubles get any worse, he could be vulnerable in the primary, especially since much of the territory in this district is new to him.

7th District – Markey (Gray)

This district, while picking up the Alston-Brighton neighborhood of Boston, gets slightly more conservative overall, as it trades the metrowest towns that Tsongas picked up for some more conservative ones that Tierney lost. At D+15 it still has a strong liberal inner suburb base and should be fine.

8th District – Lynch (Periwinkle)

Lynch’s district changes radically in order to preserve the majority-minority district required (maybe?) by the VRA.  Lynch may not be too happy about this, since he has the most conservative voting record of any of the delegation and will now have a very Liberal district.  He could be vulnerable to a primary challenge, perhaps from State Senator Sonia Chang-Diaz.

9th District – Keating (Cyan)

This district doesn’t change much, unfortunately.  There are only so many ways to draw a district that stretches from Quincy to Cape Cod.  If O’Leary had won the primary we would have had more options.

The new 8th district is 48% non-hispanic white, which is comparable to the current 8th.  Just for fun, I tried to draw a district that would bring this number as low as possible:


40% White, 27% Black, 10% Asian, 21% Hispanic, 2% other.

9 Competitive Districts for Indiana

In a “now for something completely different” moment, I decided to redistrict a state in such away where all districts would be maximally competitive.  Indiana is ideal for this since it was extremely close in the last election and does not have large enough minority populations to invoke the VRA.

Without further ado:

I used the town totals from the back of this data set to split Lake and LaPorte counties. For the other split counties, notably Marion and Hamilton, I just came up with reasonable numbers for what I wanted the split to be, figuring it would be relatively easy to adjust the lines to make it a reality.

Estimates of margins of victory and political analysis

District 1 (Blue):  Obama by 3500.  Hammond and Terre Haute are balanced against some conservative Indianapolis suburbs. Open seat.

District 2 (Green): Obama by 4900. Loses Michigan City and gain some Conservative territory to the East, but retains its South Bend base assuring Donnelly’s relatively easy reelection.

District 3 (Purple): McCain by 700, the only one he wins. This Fort Wayne based district now gains some Democratic turf in Muncie and Anderson. Souder had challenging races in his old district, so would presumably draw even stronger challenges here.

District 4 (Red): Obama by 5800. Gary and Lake County weigh against a broad swath of conservative turf, setting up a battle royale of Visclosky verses Buyer.  Theoretically the most Democratic district, but the estimates are a bit sketchy for some of the splits.

District 5 (Gold): Obama 1400. Some Democratic turf near the lake and Tippecanoe County weigh against the conservative interior, most notably deep red Kosciuskco.  Open seat.

District 6 (Turquoise): Obama by 3300. Some of the more Democratic parts of Marion weigh against Republican rural areas and suburbs.  Carson will need to convince enough of those folks that it’s okay to send a Muslim to congress that Indianapolis can carry the day.

District 7 (Gray): Obama by 4200.  A good urban suburban mix.  Burton will need to convince those urban voters that his golf habit won’t prevent him from representing them.

District 8 (Lavender): Obama by 3400.  This district is slight more Democratic than the old Eighth, since it picks up Monroe county. Blue Dog Ellsworth should have no trouble.

District 9 (Cyan): Obama by 2600.  I would think that moderate Democrat Hill would have the advantage over the ultra conservative Pence, who may prefer to run in the Sixth, but Hill has never won by particularly large margins, so who knows.

DOJ to the Black Courtesy Telephone (South Carolina)

If South Carolina does gain a district, as projected, it will be possible to make that new district a second majority African American one.

Here’s one such map that does this:


(Full Resolution)

Charleston:

Columbia:

The racial demographics of the two districts are:

District 6 (Charleston based):

Black: 341,718 (53.4%)

White: 263,579 (41.2%)

Other (inc. Hispanic): 34,797 (5.4%)

District 7 (Columbia based):

Black: 357,623 (55.9%)

White: 242,185 (37.9%)

Other: 39,613 (6.2%)

Even if the DOJ doesn’t mandate the creation of new African American district, the Republican controlled legislature may want to create one anyway, since it would shore up the 1st and 2nd districts, both of which had strong challenges last year, and take some Black voters out of the 5th, which would go from 32 to 25 percent Black, though it would remain unlikely that they will be competitive there until Spratt retires.

New Districts for Washington State

The goal of this was to draw 8 districts capable of electing Democrats.  Without detailed political data it’s difficult to know whether this is ridiculously overreaching or just “aggressive”, but I though I’d give it a shot.

The Whole State:


(Larger Resolution)

Blow up of Seattle-Tacoma:

District 1:

This district is now centered on the Olympia Peninsula, but still retails a portion of Seattle and it’s Northern suburbs.

District 2:

Loses Whatcom and Island counties in exchange for some suburban areas South of Everett and a small area East of the Cascades.

District 3:

This district (which in it’s old configuration went narrowly for Bush twice) has been shored up slightly by replacing most of conservative Lewis county with a larger portion of Olympia and Dem trending Klickitat County.

District 4:

Heart of Conservative Eastern Washington.  Yakima, which was the population center of the old district has been removed in exchange for the reddest areas of the old 5th.

District 5:

Politically competitive district in Northern and far Eastern Washington.  While it went for Obama in 2008, it probably supported Bush in 2004.  A strong Dem from Spokane could wrest the seat from McMorris Rodgers.

District 6:

This seat has been changed fairly substantially. While, still anchored in Tacoma, it no longer contains the Olympia Peninsula, but instead has portions of Thuston, most of Lewis and a small part of Yakima counties.  Current Congressman Norm Disks would be unhappy, as his Bremerton home is now outside of the district.

District 7:

To help out some of the neighboring districts the 7th now has less of Seattle and gained some suburban regions that were in the 1st and 8th.  It still should be very Democratic.

District 8:

The new 8th is now entirely in King County, gaining Renton, Kent and a healthy portion of Seattle.  Hopefully enough to send Sheriff Dave riding off into the sunset.

District 9:

This is the district I am the most apprehensive about.  While I did give it a portion of Seattle I also added some conservative parts of Pierce County and the City of Yakima.  I would want to look at more detailed political data to make sure I didn’t push it too far right.


Georgia on my Mind (redistricting)

The following is a bit of a thought experiment. Imagine a Democratic Gerrymander of Georgia that could more or less ignore the VRA, or at least go with the standard of “majority minority” rather than striving for 50%+ Black.  I used Dave’s Redistricting App, with the new population estimates, creating 14 districts.  I was not as aggressive as fitchfan28 and focused my efforts on the Atlanta area leaving South Georgia largely unchanged.

District 1 (Dark Blue):

Not much different from before. Jack “Pelosi is destroying families by making us work Mondays” Kingston will have no trouble here.

District 2 (Dark Green):

Also not much change.  Sanford Bishop’s district continues to be racially mixed, with a narrow White majority.  Perfect for a Black Blue Dog.

District 3 (Salmon):

First of several of the majority minority districts. Southern parts of Fulton County balance out some more conservative suburbs.  Contains some of the Black suburbs as well.

District 4 (Red):

Heart of Atlanta and much of Cobb county.  At little more White than some of the others, but still not a majority.

District 5 (Purple):

The most diverse of all the districts.  Large populations of Whites, Blacks, Hispanics and Asians.

District 6 (Aquamarine):

This district is about 2/3rds White.  It might be more Liberal, being located largely in Fulton and Dekalb counties, it might not be.  I didn’t have political data.  (Anyone familiar with Georgia care to comment?)

District 7 (Gold):

A fairly equal mix of Whites from  and Blacks. Some other minorities, but not as many as the 5th.

District 8 (Light Purple):

I took away Macon, but made it up with Athens.  Only after I drew the lines did I realize that Jim Marshall lives in Macon and may choose to run in the new 13th.  The district is just over 60% White, so there’s enough minorities and Liberals (in Clark County) the Dems might do okay.

District 9 (Cyan):

Very Conservative and White.

District 10 (Pink):

See district 9.

District 11 (Grey):

Conservative Atlanta Exurbs and North Georgia district.  Would be a good landing spot for Tom Pierce, if the 6th is too urbanized now.

District 12 (Light Green):

Not too different from the old 12th, though a little bit blacker. (Now Majority Minority)

District 13 (Periwinkle):

Whites are just under to a majority in this rural and exurban district.

District 14 (Mustard):

Another majority minority district with whites and blacks in close numbers.

Overall, 6 minority districts, which should all go to the Dems, plus Bishop’s Second, which is an easy hold.  The new 8th will be a bit of a struggle but doable and potential pickup in the 6th, depending on how the numbers run.  So a total of 7 – 9 districts out of 14, without any aggressive Gerrymandering.

Swingnut Demographics

The discussion regarding “Ferris Bueller’s Day Off” surprised me in that a number of people volunteered their age and were, on the whole, younger than I imagined the members of this site to be.  To test this hypothesis, (since the Bueller sample may have been self selecting, for obvious reasons) I’ve created a poll.  The age spreads are a bit narrower for the younger ages.  If people enjoy this, I will perhaps do more demographic polls in the future.

By what margin will Bob Shamansky win?

View Results

Loading ... Loading ...