I decided to try my hand at redistricting California’s Congressional districts for 2010-2012, using Dave’s Redistricting App. After playing around with it a bit, here’s what the map I came up with looks like overall:

Here’s the 2008 Obama/McCain vote in California, on the precinct level:

Read on for a detailed analysis and breakdown:
California redistricting after the 2010 census presents a great opportunity for Democrats. In 2000, a bipartisan incumbent protection map was drawn, which very effectively protected all incumbents – both Democrats and Republicans. In fact, since that map was drawn, only 1 seat has changed hands. That was CA-11, lost by Richard Pombo to Jerry McNerney in 2006. With time, as California has continued to become more strongly Democratic, the Congressional map has effectively turned into a GOP gerrymander.
My goal was to make as many seats as possible that voted about 63% for Obama, while making as many of the rest of the remaining seats as possible at least competitive and winnable for Democrats, and conceding as few seats as possible to the GOP. My vote estimates are not exact (I did not add up all the precincts), but should generally be accurate, and any errors should be small enough to not really effect the overall partisan status of each district. My vote percentages take into account only Democratic and Republican votes, disregarding 3rd party votes which do not alter the outcome – so 63% for Obama necessarily means 37% for McCain as well. However, if CA 3rd party voters cast votes for major party candidates in Congressional races, on net it should probably help Democrats – a majority of 3rd Party votes in California were cast for Ralph Nader or Cynthia McKinney. I also assumed that California will keep 53 districts, though it is possible that California will lose one (or who knows, even gain, if the census count is high).
In theory, it would be possible to redistrict California so that every Congressional district voted for Obama. But that would require either a bit more gerrymandering than I was willing to contemplate (like running a district from downtown San Francisco to Shasta County), or would require weakening some Democratic seats to the point that they might actually become winnable for Republicans. So instead I settled on trying to create the maximum number of seats with a PVI at or near about D+10. If a Democratic incumbent in a seat which is about D+10 loses their seat to a Republican, they probably deserve to lose it – corruption, scandal, $100,000 in the freezer, and we are probably better off without them. But even if the GOP did manage to momentarily pick up a D+10 district, Democrats would have an excellent chance of picking it back up in the next cycle. Other than scandal, it would take a truly formidable national GOP wave, greater than that of 1994 or 2006, to lose more than a handful of D+10 seats. And in that case, the GOP would control Congress regardless of what happens in California.
I also made a statewide precinct map showing the Obama/McCain vote in 2008 on the precinct level. It is not entirely complete, because no votes were cast in some irredeemably rural “precincts” and some precincts have changed. But for the most part it should get the job done in the areas where we have to worry about looking below the county level. I could have never done Southern California in particular without this. There are 8 shades of blue and red, equally incremented by 6.25 points each, so that for example, the lightest blue means that Obama won the precinct with 50-56.25% of the vote, while the darkest blue precincts voted 93.75-100% for Obama. There’s also a bigger version of the same map if you want to a more zoomed in view (big image, you were warned).
In addition, here’s the 2008 Obama/McCain vote with the size of each precinct adjusted in proportion to the actual number of votes cast in the precinct, rather than its geographical size. With the caveat that this slightly understates Republican strength because the few counties missing in the previous map voted for McCain, this is in one sense a more true depiction of the the Presidential vote in California. It also really brings home what a great proportion of the vote was cast in the LA and Bay areas. There are really not that many substantial clusters of red precincts that cannot be overwhelmed with surrounding blue areas. While in the geographic precinct map, it looks like McCain won some substantial areas, the reality is that he won in very few places – McCain only won in the most sparsely populated areas of the state and in select CA suburbs and exurbs. (Click here for a zoomed in version of the same map).

I’d also recommend anyone interested in California redistricting read Silver Spring’s earlier work on redistricting California, (which gave me some of the ideas that went into this map), which drew a map with 44 Democratic, 7 GOP, and 2 swing seats while increasing Latino and Asian American opportunity districts and generally respecting community/political boundaries. But I wanted to see if I could push the map further, conceding fewer GOP seats and further increasing Hispanic and Asian American representation, without endangering any existing Democratic incumbents.
The future political shape of California
California voted 61% for Obama to 37% for McCain. Disregarding 3rd party votes, Obama got 62% to McCain’s 38%. Obama also managed to narrowly win 8 of 19 GOP held districts which had been gerrymandered to be safe GOP, proving by example that there are potential progressive gains to be made in California.
Because California is unlikely to become much more Republican over the next 10 years, the likelihood that an aggressive redistricting plan will backfire, like the 2000 GOP gerrymander of Pennsylvania, is minimal. The chief reason for this is that California is a Majority Minority state in which the white population will to continue to decline as a share of the population. Yet white voters made up 63% of the electorate in California in 2008 even though they only make up 42% of the population. Simply put, as time passes, the electorate in California will continue to become less white, and more racially representative of the population as a whole. So there are really only two ways that the GOP can gain any ground (or avoid losing it) in California – they must either suddenly start getting support from minority voters, or they must start receiving levels of white support that they only now really get in parts of the South and a few other places. Given the GOP trend on issues like the confirmation of Sonia Sotamayor, it seems unlikely that the GOP can possibly pick up any meaningful sort of ground among minoritiesby 2020, assuming that the GOP does not suddenly transform into a very different party.
According to exit polls, the 2008 vote in California broke down by race as follows. White and black voters exceeded their share of the population, while the percentage of the electorate that was Asian American or Hispanic was only half the percentage of the population that was Asian American or Hispanic.
Actual 2008 Vote
|
% of Electorate |
Obama |
McCain |
Effective Obama Support |
White |
63.0% |
52.0% |
46.0% |
53.1% |
African American |
10.0% |
94.0% |
5.0% |
94.9% |
Latino |
18.0% |
74.0% |
23.0% |
76.3% |
Asian |
6.0% |
64.0% |
35.0% |
64.6% |
Other |
3.0% |
55.0% |
41.0% |
57.3% |
Total |
|
|
|
62.3% |
Now, what would the 2008 vote in California have looked like if the electorate had the same racial breakdown as the population as a whole? Assuming that each racial group gave the same % to Obama, he would have done 3 points better (7 on net). And that even includes cutting the African American percentage of the electorate by nearly HALF. This is what the future of the California electorate looks like, and it looks hopeless for Republicans.
What if the 2008 Electorate looked like the population?
|
% of Population |
Obama |
McCain |
Effective Obama Support |
White |
42.0% |
52.0% |
46.0% |
53.1% |
African American |
5.9% |
94.0% |
5.0% |
94.9% |
Latino |
36.6% |
74.0% |
23.0% |
76.3% |
Asian |
12.2% |
64.0% |
35.0% |
64.6% |
Other |
3.3% |
55.0% |
41.0% |
57.3% |
Total |
|
|
|
65.6% |
So what if the GOP were able to get a massive swing of white voters? With the 2008 electorate, McCain would have had to win white voters 2 to 1 to have pulled even in California (much less win it). In fact, he lost white voters 52-46. With the future electorate, things are naturally even bleaker for the GOP. In fact, with an electorate that looked like California’s population (the future electorate that CA is trending towards), Obama could have lost white voters 53-45 and still done better than he actually did in 2008.
What if the 2008 Electorate looked like the population?
|
% of Population |
Obama |
McCain |
Effective Obama Support |
White |
42.0% |
45.0% |
53.0% |
45.9% |
African American |
5.9% |
94.0% |
5.0% |
94.9% |
Latino |
36.6% |
74.0% |
23.0% |
76.3% |
Asian |
12.2% |
64.0% |
35.0% |
64.6% |
Other |
3.3% |
55.0% |
41.0% |
57.3% |
Total |
|
|
|
62.6% |
It would obviously take much more for Republicans to even come close to winning Statewide elections. In fact, for McCain to have won California without making gains with minorities and with the 2008 electorate, he would have needed to win white voters 66-32. If the electorate had broken down by race the same way as the population, he would have had to win white voters 83-15. And that only just barely gets a narrow GOP win.
Coming close to winning statewide elections is precisely what it would take for the GOP to start putting more than a handful of the D+10 seats in any danger at all. There’s just flat out no way that they can do that in California without appealing to a meaningful number of progressive voters in the Bay Area and in Los Angeles. And frankly, if the GOP starts appealing in places like Los Angeles and the Bay Area, then they will have rejected most of what they currently stand for and progressive Democrats will have already won (or failed spectacularly to the point of creating a GOP wave far exceeding 1994 or 2006). It would be foolishly Rovian to claim that is impossible, but it is a very high bar to hurdle, especially because the national GOP is so deeply averse to even the facade of quasi-moderation of exhibited by Republicans like Schwarzenegger, Crist, and Snowe.
Political Impact
The political impact of this map would be to increase the number of Democrats in Congress from California. Barring major scandal, California should have an approximately 40-13 Democratic delegation (including all 33 current Democratic incumbents). That’s likely to be at least 44-9. And in a best case scenario, in which all the swing seats turn blue, California even has a chance to send an overwhelming 49-4 Democratic delegation to Washington. Moreover, most of the new Democrats elected would likely be reasonably progressive Democrats.
The drawing of a Congressional map along these lines would also have the effect of neutering the net national partisan impact of Republican gerrymanders in states like Florida and Texas. While my personal preference would be to have all districts drawn by a non-partisan commission, it is no good if only Democrats do that in states where Democrats will control redistricting, while the GOP goes on a gerrymandering binge in states expected to gain seats like Florida, Texas, Georgia, and Utah. But with an aggressive redrawing of the lines California, Democrats can in one fell swoop come close to making sure that redistricting will not be a net negative on the national level. By carefully drawing the seats so that newly Democratic districts have strong progressive bases in areas like Los Angeles and the Bay Area, we can also increase the likelihood that better Democrats will be elected from those districts.
District Political Status
Dem |
39 |
Lean Dem |
5 |
Swing |
5 |
GOP |
4 |
Safe Democratic seats
I classify 39 seats as reasonably safe Democratic seats. All of these districts voted 60%+ for Obama (D+7), and 28 of them voted 63%+ for Obama (D+10).
Lean Democratic seats
There are 5 Lean Democratic seats (3, 20, 42, 45, 50). The 20th is already in Democratic hands (and could probably be made safer pretty easily), and there would be a very good chance of picking up the other 4 seats in 2012, especially if Obama again does well in California. These seats all voted 55-58% for Obama and are likely to become more Democratic – 3 of them are new majority Latino seats, and the others have substantial minority populations whose turnout should gradually rise).
Swing Seats
These are seats that voted from 51% to 53% for Obama (4, 40, 41, 44, 48, 49). 40, 41, and 48 all have white populations that make up less than 50% of the district’s population, and should continue to become more Democratic as minority turnout increases. There is no guarantee that Democrats will necessarily be able to pick up all (or any) of these seats, but strong candidates ought to be able to run competitive races and win in these districts.
GOP Seats
Finally, there are 4 safe GOP seats. These all voted about 32-41% for Obama and are designed to be completely unwinnable for Democrats. These districts all serve to suck in the maximum number of Republicans possible, making surrounding districts more Democratic.
In retrospect, if I were to redraw the map, I might consider conceding one more safe GOP seat in the Orange County/Riverside/San Bernadino area. If the most heavily GOP areas remaining were combined into one more district, it would be pretty easy to make a number of swing/lean Dem seats a bit more Democratic.
The Voting Rights Act
I endeavored to follow the requirements of the Voting Rights Act in full, and tried to even go a bit beyond its strict requirements. From the districts drawn in 2000, I managed to substantially increase minority voting strength for both Latinos and Asian Americans, while maintaining effective black control or at least substantial influence over 4 districts. :
VRA Status of New Districts
District Type |
# of Districts |
% of Districts |
% of Population |
Majority White |
19 |
35.8% |
42.3% |
Plurality White |
11 |
20.8% |
42.3% |
Total White |
30 |
56.6% |
42.3% |
|
|
|
|
Majority Latino |
15 |
28.3% |
36.6% |
Plurality Latino |
1 |
1.9% |
36.6% |
Total Latino |
16 |
30.2% |
36.6% |
|
|
|
|
Plurality Asian |
3 |
5.7% |
12.5% |
|
|
|
|
Effective Black |
4 |
7.5% |
6.7% |
Increase Latino voting strength
5 new Majority Latino seats are added. They are the the 18th, 21st, 25th, 42nd, and 45th. CA-32 also changes to an Asian plurality district, which is offset by the change of CA-26 to a Latino majority district. Factors such as how complete the census count of Latinos is and how concentrated Latino population growth actually is will have a big effect on the actual location and shapes of these districts, but in reality it ought to be possible to add a number of new Latino majority districts.
Increase Asian American voting strength
The 12th, 15th, and 32nd districts become Asian American plurality districts. Although Asians are not a homogeneous group politically or ethnically, and although Californians have sometimes elected Asian Americans in districts without a particularly large Asian community (like Doris Matsui in Sacramento), Asian voters will now have more of a guarantee that they can elect candidates of their choice.
Maintain African American voting strength
I tried to maintain African American voting strength as much as I could, but trends are working against the maintanance of the existing 4 districts which are effectively controlled by African American voters (CA-9, CA-33, CA-35, CA-37). Particularly in the 3 LA districts, Latino population growth is gradually overwhelming the African American population, particularly in CA-35. Additionally, population growth has not kept up with the state average in these districts, meaning that they will need to expand – and there are really no more concentrations of black voters nearby that can be added to the 3 districts. On the basis of population, one could probably justify merging the African American areas of the 3 existing districts into two districts with higher African American populations, but I did not do this in order to try and protect all incumbents. If a merger of these districts does not happen in 2010, the voters may well make it happen anyway, making a merger in 2020 a near certainty. But despite these difficulties, I managed to actually slightly increase the black population % in CA-9 and CA-33. In CA-35 and 37, the African American percentage drops, but the main threat to effective black control of these districts (Latino voters) are decreased as a share of the population. By making these districts more white and more Republican, Maxine Waters and Laura Richardson are probably actually safer, because the main threat to their incumbancy is a primary challenge from a Latino Democrat. While one could arge that this disenfranchises Latinos, there is really no other way to maintain black VRA districts that I can see, and the Latinos removed from CA-35 and CA-37 help make it possible to create other Latino majority districts in the LA area.
Breakdown of the Districts
Finally, let’s look at the new districts themselves, in aggregate and individually. Because I de-packed many overly Democratic districts, the average and median district becomes more Republican, while a greater number of districts become Democratic.
District Summary
District |
New Dist Est. Obama% |
Old Dist Obama % |
Change in Obama % |
Designation |
VRA Status |
Region |
1 |
63 |
67 |
-4 |
Dem |
Majority White |
Northern California |
2 |
39 |
44 |
-5 |
GOP |
Majority White |
Northern California |
3 |
57 |
50 |
7 |
Lean Dem |
Majority White |
Northern California |
4 |
53 |
45 |
8 |
Swing |
Majority White |
Northern California |
5 |
62 |
71 |
-9 |
Dem |
Plurality White |
Northern California |
6 |
72 |
78 |
-6 |
Dem |
Majority White |
Northern California |
7 |
63 |
73 |
-10 |
Dem |
Majority White |
Bay Area |
8 |
81 |
87 |
-6 |
Dem |
Majority White |
Bay Area |
9 |
83 |
90 |
-7 |
Dem |
Effective Black |
Bay Area |
10 |
63 |
66 |
-3 |
Dem |
Majority White |
Bay Area |
11 |
61 |
55 |
6 |
Dem |
Plurality White |
Bay Area |
12 |
79 |
76 |
3 |
Dem |
Plurality Asian |
Bay Area |
13 |
64 |
76 |
-12 |
Dem |
Plurality White |
Bay Area |
14 |
73 |
75 |
-2 |
Dem |
Majority White |
Bay Area |
15 |
69 |
70 |
-1 |
Dem |
Plurality Asian |
Bay Area |
16 |
66 |
71 |
-5 |
Dem |
Plurality Latino |
Bay Area |
17 |
65 |
74 |
-9 |
Dem |
Majority White |
Central California |
18 |
60 |
60 |
0 |
Dem |
Majority Latino |
Central California |
19 |
63 |
47 |
16 |
Dem |
Plurality White |
Bay Area |
20 |
56 |
61 |
-5 |
Lean Dem |
Majority Latino |
Central California |
21 |
67 |
43 |
24 |
Dem |
Majority Latino |
Central California |
22 |
32 |
39 |
-7 |
GOP |
Majority White |
Central California |
23 |
62 |
67 |
-5 |
Dem |
Majority White |
Central California |
24 |
63 |
51 |
12 |
Dem |
Majority White |
Greater LA |
25 |
65 |
51 |
14 |
Dem |
Majority Latino |
Greater LA |
26 |
62 |
52 |
10 |
Dem |
Majority Latino |
Greater LA |
27 |
62 |
68 |
-6 |
Dem |
Plurality White |
Greater LA |
28 |
76 |
78 |
-2 |
Dem |
Majority Latino |
Greater LA |
29 |
61 |
69 |
-8 |
Dem |
Plurality White |
Greater LA |
30 |
64 |
72 |
-8 |
Dem |
Majority White |
Greater LA |
31 |
73 |
82 |
-9 |
Dem |
Majority Latino |
Greater LA |
32 |
63 |
70 |
-7 |
Dem |
Plurality Asian |
Greater LA |
33 |
94 |
88 |
6 |
Dem |
Effective Black |
Greater LA |
34 |
65 |
76 |
-11 |
Dem |
Majority Latino |
Greater LA |
35 |
76 |
86 |
-10 |
Dem |
Effective Black |
Greater LA |
36 |
64 |
66 |
-2 |
Dem |
Plurality White |
Greater LA |
37 |
64 |
81 |
-17 |
Dem |
Effective Black |
Greater LA |
38 |
63 |
73 |
-10 |
Dem |
Majority Latino |
Greater LA |
39 |
62 |
67 |
-5 |
Dem |
Majority Latino |
Greater LA |
40 |
52 |
48 |
4 |
Swing |
Plurality White |
Greater LA |
41 |
53 |
45 |
8 |
Swing |
Plurality White |
Greater LA |
42 |
58 |
46 |
12 |
Lean Dem |
Majority Latino |
Greater LA |
43 |
63 |
69 |
-6 |
Dem |
Majority Latino |
Greater LA |
44 |
41 |
50 |
-9 |
GOP |
Majority White |
Greater LA |
45 |
55 |
52 |
3 |
Lean Dem |
Majority Latino |
Greater LA |
46 |
60 |
49 |
11 |
Dem |
Majority White |
Greater LA |
47 |
60 |
61 |
-1 |
Dem |
Majority Latino |
Greater LA |
48 |
52 |
50 |
2 |
Swing |
Plurality White |
Greater LA |
49 |
51 |
46 |
5 |
Swing |
Majority White |
San Diego |
50 |
57 |
52 |
5 |
Lean Dem |
Majority White |
San Diego |
51 |
62 |
64 |
-2 |
Dem |
Majority Latino |
San Diego |
52 |
38 |
46 |
-8 |
GOP |
Majority White |
San Diego |
53 |
63 |
70 |
-7 |
Dem |
Plurality White |
San Diego |
|
|
|
|
|
|
|
Average |
62.17 |
63.37 |
-1 |
|
|
|
Median |
63.00 |
66.88 |
-4 |
|
|
|
Northern California
I defined the Northern California region as pretty much everything from Sacramento northwards. It includes 6 districts. 4 Should be Democratic, while CA-2 is Republican and CA-4 is a swing district. This is the whitest part of the State, and therefore probably the part of the State where there is the greatest potential for the GOP to make gains (even if it seems improbable at best that they will make much headway in liberal areas like Sonoma County). For that reason I decided not get too overly aggressive here. It would be possible to avoid conceding a GOP district in the far North-East, but unless you did something like draw a tentacle from Nancy Pelosi’s district up into rural GOP areas, it would be very hard to then also avoid creating a strong or leaning GOP district in the Sierra Nevada’s East and South-East of Sacramento. So I didn’t even try. Instead, I took advantage of the opportunity to move Nancy Pelosi’s district north without endangering the 1st or 6th districts, giving her Marin County across the Golden Gate bridge, which, as we will see, makes it possible to squeeze a great deal out of the Eastern side of the San Francisco Bay.
Northern California


Sacramento Area


San Francisco Bay Area
Every single seat based in the San Francisco Bay area is safely Democratic. A number of these districts also extend outwards to the east, in order to avoid wasting too many votes in ultra-Demacratic districts. But many districts remain entirely within the Bay area, and if one were willing to draw pinwheels flowing out from San Francisco and the San Mateo Peninsula to places like Bakersfield, Fresno, and Barstow, you could pretty easily squeeze out another one or two utterly safe Democratic districts.
Northern Bay Area


Southern Bay Area


Central California
Given the GOP lean of much of this region, having only 1 GOP district is not bad. Latino voting strength is greatly increased in this area. Although it might not be at all certain that all of the Latino districts will immediately have an effective Latino voting majority, they will with time. This is the most obviously gerrymandered part of the state, but that is necessary in order to increase Latino voting strength and to increase Democratic strength in less heavily Latino areas. The actual lines in this area will be greatly affected by the actual distribution of Latino population growth within counties.
Central Coast


Central Valley


LA Area
I am using a broad definition of the LA area, including areas beyond the city of Los Angeles proper, including Orange, Riverside, San Bernadino, and Ventura counties. In this area, and especially in LA County, some of the districts are better thought of as general ideas than specific exact proposals. I am fairly certain that someone who knows the area better than I do could draw the urban lines a bit more sensibly while maintaining or increasing all the political benefits and fully complying with the Voting Rights Act (a major cause of strange district shapes). Additionally, the 2008 Population Estimates are only available on the County level – so the actual population will be distributed somewhat differently than in the lines I drew. The exact lines should not be taken too literally, but it should be possible to draw roughly similar districts with the same basic demographic and political results. I may have mistakenly drawn some Democratic incumbents’ houses out of their district, but in reality that would probably be easy to avoid, if it matters. The greater LA area also has the greatest concentration of minorities in California.
That is the chief reason why I was more willing to draw some districts that were only lean Democratic or swing seats – because of their high but still relatively low turnout Latino and Asian American populations, many districts are safe bets to become more Democratic as that turnout increases. So even if these seats do not all flip Democratic in 2012, there is a great chance that they will flip some time between 2014 and 2020. Still, you can make a good argument for either conceding another seat to the GOP (or sending another district or 2 deep into the heart of LA), and if I were redrawing the map I would probably concede a third safe GOP seat in the Orange/Riverside/Burnadino area in order to make the surrounding districts more Democratic. But the overall point is that there is no reason for any district in LA County to be Republican, and from LA County, a number of districts can be safely extended outwards to make even more Democratic seats. It also ought to be possible to create more Latino majority seats and an Asian American plurality seat.
Southern California


Northern LA area


Southern LA area


Eastern LA area


San Diego
Last but not least, the San Diego area. Democrats currently hold only 2 of 5 seats in this area, while Obama won 54-44. With the exception of CA-51, the minority population in San Diego is relatively small. But even without relying on votes from Los Angeles, it should be possible to make 3 fairly strong Democratic districts, one heavily GOP district, and a swing district out of this area.


Breakdown of the Districts
And now to all 53 of the individual districts, one by one.
CA-1
Incumbent: |
Mike Thompson (Blue Dog D) v. Wally Herger (R) |
Previous District PVI: |
D+13 |
New District estimated Obama/McCain: |
60% Obama, D+7 |
Current District 2008 (Est.) Demographics: |
63% White |
New District Demographics: |
66% White |
CA-1 pairs Napa Blue dog Mike Thompson with Butte County (which narrowly voted for Obama) Republican Wally Herger. The district basically consists of Napa, Yolo, Colusa, Sutter, ande Butte counties, along with the section of Sonoma County previously in CA-1. Those areas combined voted 60% for Obama, and that is the basic partisan orientation of this district. If that’s not Democratic enough, it could easily be made stronger by trading some Sonoma area territory with CA-6. Some relatively unpopulated parts of Yolo and Sutter Counties are cut out to provide a path for CA-4 to connect Yolo and Placer counties, and the city of Marysville in Yuba County is thrown in to equalize the population.
In the event that Herger decided to actually run in this district, he would almost certainly lose. Half of the districts population lives in Napa, Yolo, and Sonoma counties, and would vote heavily for Thomson. In the other half of the district, Herger might win, but would have a lot of trouble winning by enough to offset the heavily Democratic Napa/Yolo/Sonoma margin. It is also easier to imagine Thomson appealing to voters in Butte County than it is to imagine Herger appealing to San Francisco Bay area liberals.
But more than likely this is a moot point, because Herger would almost certainly take one look at CA-1 and opt to run in CA-2 instead, which includes a lot of his rural GOP base areas.
CA-2
Incumbent: |
?Wally Herger? (R), ?Tom McClintock? (R) |
Previous District PVI: |
R+11 |
New District estimated Obama/McCain: |
39% Obama, R+14 |
Current District 2008 (Est.) Demographics: |
72% White |
New District Demographics: |
78% White |
CA-2 serves to pack as many rural Northern California Republicans as possible into one district. It is the whitest district in California, and is very strongly Republican. CA-2 includes compact rural counties in Northern California, and snakes down through Placer, El Dorado, and Amador counties to pick up rural/exurban GOP areas, leaving closer in Sacramento suburbs in Placer County to CA-4, and leaving the more Democratic Lake Tahoe area to CA-10.
As discussed with CA-1, Wally Herger would probably run in this district, even though he lives in the new CA-1. Tom McClintock would also probably want prefer to run in this district than in a swing district, even though he lives in the new CA-5. In the event of a primary between Herger and McClintock, Herger would probably prevail because slightly more of the new CA-2 comes from Herger’s old district than from the old CA-4, and Herger has longer standing actual ties to the area than McClintock.
CA-3
Incumbent: |
Dan Lungren (R) |
Previous District PVI: |
R+6 |
New District estimated Obama/McCain: |
57% Obama, D+4 |
Current District 2008 (Est.) Demographics: |
65% White |
New District Demographics: |
56% White |
CA-3 is now entirely within Sacramento County, and is substantially more Democratic than the old CA-3, which voted narrowly for Obama. There is a delicate balancing act here between hurting Lungren and keeping Matsui secure. It would be possible to make CA-3 even more Democratic, but not without dragging CA-5 under roughly D+10, which I wanted to avoid. It is not a complete certainty that Lungren would lose in this district, but it is a certainly that he would face very competitive elections every 2 years until he does.
CA-4
Incumbent: |
None |
Previous District PVI: |
R+10 |
New District estimated Obama/McCain: |
53% Obama, D+0 |
Current District 2008 (Est.) Demographics: |
79% White |
New District Demographics: |
57% White |
The new CA-4 is a bona fide suburban swing district, combining 99% of Democratic Solano County (4/7 of the district) with GOP leaning Sacramento Suburban part of Placer county, and sparsely populated areas in between to connect them. There is no real incumbent in this district, but Charlie Brown would be well positioned to win here. This district is much less Republican than the old version, which he only barely lost in 2008. If not, a Democrat from Solano County would have a good chance of winning here. The only potential hitch is the fast pace of growth in Placer County. If that tends to increase GOP margins, this district will become more Republican with time. On the other hand, if the Sacramento suburbs liberalize as they grow, this district will stay roughly even or move slightly more Democratic. It would be pretty easy to make this district more Democratic by extending it further into the Bay Area, but I kept it more compact and suburban based.
CA-5
Incumbent: |
Doris Matsui (D) |
Previous District PVI: |
D+15 |
New District estimated Obama/McCain: |
62% Obama, D+9 |
Current District 2008 (Est.) Demographics: |
39% White |
New District Demographics: |
46% White |
CA-5 becomes more Republican, but not Republican enough to put Doris Matsui in any realistic danger. It now crosses over (barely) into Yolo County to pick up West Sacramento, but otherwise is based very much in Sacramento proper.
CA-6
Incumbent: |
Lynn Woolsey (D) |
Previous District PVI: |
D+23 |
New District estimated Obama/McCain: |
72% Obama, D+19 |
Current District 2008 (Est.) Demographics: |
70% White |
New District Demographics: |
71% White |
CA-6 ditches highly progressive Marin County to pick up less-progressive-but-still-progressive areas further North along the coast. Lynn Woolsey still has absolutely nothing to worry about, and could easily take on some more GOP turf or donate some heavily Democratic areas to CA-1. Alternatively, CA-2 could be sucked into CA-6/Marin and become a swing or Democratic district rather than being conceded to the GOP, but that would make it much more difficult to make CA-4 a swing district, and much more difficult to turn CA-10 into a Democratic district with a strong base in the Sierra Nevadas, and would also necessitate some more county splitting.
CA-7
Incumbent: |
George Miller (D) |
Previous District PVI: |
D+19 |
New District estimated Obama/McCain: |
63% Obama, D+10 |
Current District 2008 (Est.) Demographics: |
39% White, 27% Latino |
New District Demographics: |
50% White, 31% Latino |
CA-7 moves out of Solano County, and into San Joaquin where it picks up Lodi, Tracy, and Manteca (most of the county other than Stockton). The district also cedes areas around Richmond to CA-10 and CA-9, resulting in a more Republican District. My intention was to bring it down to about D+10, but it could be a couple points off in either direction. If it is too Republican, it would be very easy to fix that and make this district more Democratic. CA-7 isn’t D+19 any more, but it does not really need to be. Long time incumbent George Miller, who has been in Congress since 1974, will not be in any danger of suddenly now losing his seat simply becase it becomes a bit less Democratic.
CA-8
Incumbent: |
Nancy Pelosi (D) |
Previous District PVI: |
D+35 |
New District estimated Obama/McCain: |
81% Obama, D+28 |
Current District 2008 (Est.) Demographics: |
45% White, 30% Asian |
New District Demographics: |
61% White, 18% Asian |
Nancy Pelosi’s CA-8 plays a very important but subtle role in this overall map. By crossing the Golden Gate Bridge and taking in Marin County, her district becomes slightly less Democratic. But that’s not the main point. By taking in Marin County, it allows CA-6 to push northwards, and just as importantly, it sucks CA-12 into San Francisco (making it Asian plurality in the process), and sucks all the districts to the South-East of it towards San Francisco. This dominoes through the districts and ultimately provides the impetus to pull more Republican districts in the Central Valley further in towards areas like Santa Cruz, San Jose, and Alameda.
CA-9
Incumbent: |
Barbara Lee (D) |
Previous District PVI: |
D+37 |
New District estimated Obama/McCain: |
83% Obama, D+30 |
Current District 2008 (Est.) Demographics: |
36% White, 20% Black, 17% Asian, 23% Latino |
New District Demographics: |
37% White, 22% Black, 16% Asian, 21% Latino |
The percentage of African Americans in Barbara Lee’s new 9th District is not just maintained, but actually increased, even while the district becomes a little bit less Democratic. I did this by trading ultra-liberal but predominantly white areas of her district (principally Berkeley) for predominantly white liberal areas in Contra Costa County, along with Richmond, which has a fairly high black population. So the district now consists of Oakland, Richmond, and areas of Contra Costa county like Orinda, Walnut Creek, and Pleasantville.
CA-10
Incumbent: |
?John Garamendi? (D) |
Previous District PVI: |
D+11 |
New District estimated Obama/McCain: |
63% Obama, D+10 |
Current District 2008 (Est.) Demographics: |
56% White |
New District Demographics: |
60% White |
This new version of CA-10 is rather different from the previous CA-10, and is drawn under the assumption that John Garamendi wins the CA-10 special election. This district is probably the most bizarrely shaped of all the districts I drew, but it makes sense, at least from the perspective of drawing a distrcit that would be good for Garamendi. Republican George Radanovich also lives here (in Mariposa), but he wouldn’t have much chance if he ran in this district.
Nearly 4/7 of the population of CA-10 live in Contra Costa or Alameda Counties, and those areas are all very heavily Democratic (Berkeley – where Garamendi went to college, El Cerrito, San Pablo, Pinole). From there, it snakes through sparsely populated parts of Solano, Amador, and Sacramento counties, picking up Garamendi’s home along the way. Then it enters the Sierra Nevada mountain range through Calaveras county, where Garamendi was born and has a ranch. It picks up Republican leaning areas near Yosemite National Park (Garamendi was Deputy Secretary of the Interior), and picks up a mixture of Rural Republicans and more liberal Lake Tahoe/ski areas up and down the Nevada border, stretching from Inyo County in the south to Nevada County in the north. I have to say, I was sorely tempted to cross into Fresno and Tulare counties to pick up Sequoia and King’s Canyon National park, and into San Bernadino to take in all of Death Valley, but I restrained myself.
Alpine, Calaveras, Inyo, Mariposa, Mono, Nevada, and Toulumne counties collectively voted McCain 52% to Obama 48%. If you assume that liberal areas around Lake Tahoe (parts of Placer and El Dorado counties) roughly cancel out extraneous GOP areas, and that the Contra Costa/Alameda county parts of the district voted about 75% for Obama, then you end up with a district that voted about 63% for Obama, litte changed from the current partisan stance of CA-10. And there we have it – a district that takes care of some hard to deal with GOP areas in the Sierras, avoids wasting Democratic votes along the Nevada border on a GOP district, that opens up space in eastern Contra Costa County for CA-7 to dilute GOP votes in San Joaquin county, and that John Garamendi should be able to effectively represent despite the district’s bizarre geographic shape, given his background. Whew!
As a more compact alternative to this, instead of reaching all the way to Berkeley, the district could combine the Sierras with a different and nearer Democratic area, such as the city of San Joaquin. But then this district would not include Garamendi’s home, would be only weakly Democratic rather than safe, would be less progressive, and would really be more like a reconfigured 19th than the 10th.
CA-11
Incumbent: |
Jerry McNerney (D) |
Previous District PVI: |
R+1 |
New District estimated Obama/McCain: |
61% Obama, D+8 |
Current District 2008 (Est.) Demographics: |
51% White, 26% Latino |
New District Demographics: |
45% White, 27% Latino |
CA-11 is altered significantly to make it more Democratic. It now takes in all of the city of Stockton, in exchange for which it gives up some relatively conservative areas to CA-7. It also expands a bit more in Alameda County, taking on Livermore as well as a bit of territory from Pete Stark and Barbara Lee. The end result is a much safer district for McNerney. I guesstimate that it voted roughly 61% for Obama, but that could be off by a few percentage points. If it is too Republican, that is easy to fix.
CA-12
Incumbent: |
Jackie Speier (D) |
Previous District PVI: |
D+23 |
New District estimated Obama/McCain: |
79% Obama, D+26 |
Current District 2008 (Est.) Demographics: |
45% White, 31% Asian |
New District Demographics: |
35% White, 38% Asian |
CA-12 moves further into San Francisco to accomadate Pelosi’s shift into Marin County. In the process, it turns into a district with a slight Asian American plurality.
CA-13
Incumbent: |
Pete Stark (D) |
Previous District PVI: |
D+22 |
New District estimated Obama/McCain: |
64% Obama, D+11 |
Current District 2008 (Est.) Demographics: |
29% White, 35% Asian, 23% Latino |
New District Demographics: |
37% White, 26% Asian, 28% Latino |
CA-13 is still primarily based in Alameda County, where 2/3 of the district is located, retaining Pete Stark’s home town of Fremont, along with Union City, Newark, and most of Hayward. It then crosses through unpopulated mountains to the east and reappears on the outskirts of Modesto, where it basically picks up the parts of Stanislaus County that were formerly in the 19th district. The end result is a district which is still strongly Democratic, but not packed as full of progressive Alameda County voters as before.
CA-14
Incumbent: |
Anna Eshoo (D) |
Previous District PVI: |
D+21 |
New District estimated Obama/McCain: |
73% Obama, D+20 |
Current District 2008 (Est.) Demographics: |
53% White, 21% Asian, 19% Latino |
New District Demographics: |
52% White, 22% Asian, 20% Latino |
Like CA-12 before it, CA-14 is sucked towards San Francisco because of CA-8’s trip across the Golden Gate Bridge. In San Mateo County, it adds San Carlos, Foster City, and San Mateo. Saratoga in Santa Cruz County along with CA-14’s old section of Santa Cruz County are removed. This has no real political impact, and CA-14 remains a veritable Democratic fortress.
CA-15
Incumbent: |
Mike Honda (D) |
Previous District PVI: |
D+15 |
New District estimated Obama/McCain: |
69% Obama, D+16 |
Current District 2008 (Est.) Demographics: |
39% White, 36% Asian |
New District Demographics: |
35% White, 39% Asian |
Moving parts of CA-9 and CA-13 out of Alameda County has left some people there that need to go somewhere. They go into Mike Honda’s 15th district, which is now up to 39% Asian American. No real partisan effect, except CA-15 may get a bit more Democratic.
CA-16
Incumbent: |
Zoe Lofgren (D) |
Previous District PVI: |
D+16 |
New District estimated Obama/McCain: |
66% Obama, D+13 |
Current District 2008 (Est.) Demographics: |
28% White, 26% Asian, 40% Latino |
New District Demographics: |
29% White, 19% Asian, 45% Latino |
60% of CA-16 remains within Santa Clara County. To get to the rest of the district, it crosses the mountains and ends up in Stanislaus County, where it takes in the city of Modesto. strengthening the Latino plurality in the process. This only makes the district 3 or 4 points more Republican, and Zoe Lofgren has nothing to worry about.
CA-17
Incumbent: |
Sam Farr (D) |
Previous District PVI: |
D+19 |
New District estimated Obama/McCain: |
65% Obama, D+12 |
Current District 2008 (Est.) Demographics: |
41% White, 48% Latino |
New District Demographics: |
60% White, 19% Latino |
Sam Farr’s district becomes much whiter than before, principally because it gives up predominantly Latino areas inland (Salinas, Hollister, Watsonville) to the 21st district in order to help give that district a strong Latino majority. In exchange, Farr adds the rest of Santa Cruz county (except for Watsonville), parts of Santa Clara county (Saratoga, Campbell, Los Gatos, Monte Sereno), as well as some conservative inland areas in San Luis Obispo and Kern counties. But 78% of the population lives in Monterrey, Santa Clara, and Santa Cruz counties, all of which are strongly Democratic, so Farr’s district remains strongly Democaratic even while becoming much whiter. As a rough estimate, this district probably voted about 65% for Obama.
CA-18
Incumbent: |
Dennis Cardoza (Blue Dog D) |
Previous District PVI: |
D+4 |
New District estimated Obama/McCain: |
60% Obama, D+7 |
Current District 2008 (Est.) Demographics: |
32% White, 50% Latino |
New District Demographics: |
28% White, 52% Latino |
In order to keep CA-18 majority Latino while also making CA-21 and CA-19 into 70% Latino districts, CA-18 dumps its sections of Stanislaus and San Joaquin counties. Instead, it takes in all of Merced county, then runs south through Madera County and then into Fresno, where it takes just about every precinct in the city that voted for Obama. This makes the district a couple of percentage points less white and more Latino, which also makes it a few points more Democratic.
CA-19
Incumbent: |
None |
Previous District PVI: |
R+9 |
New District estimated Obama/McCain: |
63% Obama, D+10 |
Current District 2008 (Est.) Demographics: |
52% White, 5% Asian, 36% Latino |
New District Demographics: |
47% White, 16% Asian, 30% Latino |
This new CA-19 is the prime beneficiary of Nancy Pelosi’s shift northwards. It is radically different from the old CA-19, and shares no constituents with it at all. Whereas the old version was safely GOP, the new one is safely Democratic. 5/7 of the district is in San Jose, and it is an effective certainty that this district will elect another progressive San Jose Democrat. The other 200,000 people are mostly white Republicans in the Central Valey, running through farmland to pick up as many GOP voters as possible in the Visalia/Hanford/Tulare area. It is a measure of just how large the Latino population is now in the Central Valley that even though these 200,000 people are the least Latino leftover areas from after making 2 70% Latino districts, 40% of the people here are still Latino, and only 50% are white. In the end, near 70% support from Santa Clara county combined with 40% support from the Central Valley should end up with a district that voted about 63% for Obama.
CA-20
Incumbent: |
Jim Costa (Blue Dog D) |
Previous District PVI: |
D+5 |
New District estimated Obama/McCain: |
56% Obama, D+3 |
Current District 2008 (Est.) Demographics: |
17% White, 68% Latino |
New District Demographics: |
21% White, 70% Latino |
If it is possible for a district that is 70% Latino to vote Republican, it will be this new, more rural version of CA-20 that leads the way. The cities of Fresno and Bakersfield are cut out entirely, and the district becomes focused on the small towns and farms of the Central Valley.
Jim Costa should be well positioned to win in this district even if it is not as immediately Democratic as one might wish, because of his background in farming, and because he has previously represented much of it. I am guessing that this district voted about 56% for Obama, but that could be way off in either direction. If it is too Republican, it should be fairly easy to make it more Democratic by rearraning the division of territory amongst the 18th, 20th, and 21st districts (the Central Valley Latino districts, possibly returning Bakersfield or Fresno). Regardless of how Democratic this district is now, over time it will steadily become more Democratic as Latinos gradually come to make up a share of the electorate closer to their share of the population. Who knows, eventually this district might elect a latter day Cesar Chavez.
CA-21
Incumbent: |
None |
Previous District PVI: |
R+13 |
New District estimated Obama/McCain: |
67% Obama, D+14 |
Current District 2008 (Est.) Demographics: |
40% White, 49% Latino |
New District Demographics: |
20% White, 70% Latino |
This new CA-21 has absolutely nothing in common with the old CA-21. It is mainly carved out of the old CA-17 and CA-20. It is fully 70% Latino, which might be high enough for Latino voters to actually have effective control over the district. A number of the white voters in urban Bakersfield and in the Salinas area are Democrats, which should make this district solidly Democratic and progressive. I estimate that it voted about 67% for Obama, but there is a high margin of error to that estimate, and much depends on exactly how high Latino turnout in this district will be.
CA-22
Incumbent: |
?Kevin McCarthy? (R), ?Devin Nunes? (R), ?George Radanovich? (R) |
Previous District PVI: |
R+16 |
New District estimated Obama/McCain: |
32% Obama, R+21 |
Current District 2008 (Est.) Demographics: |
57% White, 49% Latino |
New District Demographics: |
62% White, 30% Latino |
This new CA-22 is a dumping ground for Republicans from Fresno to Bakersfield and everywhere in between. About 1/7 of this district is carved from the old 19th, 1/3 from the old 21st, and half from the old 22nd. It should have voted somewhere in the low 30s for Obama. This is the only solidly Republican district left in the Central Valley, and it is very, very solid. Even so, it is only 62% white!!! This district should make for an interesting GOP primary, as fully 3 GOP Reps have the potential to run in this ultra-GOP district.
CA-23
Incumbent: |
Lois Capps (D) |
Previous District PVI: |
D+12 |
New District estimated Obama/McCain: |
62% Obama, D+9 |
Current District 2008 (Est.) Demographics: |
43% White, 47% Latino |
New District Demographics: |
51% White, 39% Latino |
CA-23 is no longer confined entirely to the coast, and now includes the entirety of Santa Barbara county. In San Luis Obispo county, it retains the same areas along the coast, but now takes in all of the city of San Luis Obispo. That shouldn’t hurt her, because essentially every precinct in the city voted for Obama. It still extends into Ventura County, but no longer picks up all of Oxnard. This makes CA-23 slightly less Democratic, but not by enough to endanger Lois Capps.
CA-24
Incumbent: |
Elton Gallegly (R) |
Previous District PVI: |
R+4 |
New District estimated Obama/McCain: |
63% Obama, D+10 |
Current District 2008 (Est.) Demographics: |
64% White, 26% Latino |
New District Demographics: |
62% White, 25% Latino |
The racial demographics of CA-24 remain virtually the same. But politically, it is a district transformed. 38% of the population is now in LA County, and in liberal parts of LA County – Malibu, Santa Monica, and some other parts of West LA. It should now be about 63% Obama, give or take a percentage point. Elton Gallegly, who does not even live in the district any more, would have a tough time in this new iteration, if he bothered even running.
CA-25
Incumbent: |
?Howard McKeon? (R), ?Howard Berman? |
Previous District PVI: |
R+6 |
New District estimated Obama/McCain: |
65% Obama, D+12 |
Current District 2008 (Est.) Demographics: |
44% White, 38% Latino |
New District Demographics: |
29% White, 55% Latino |
CA-25 contracts entirely within LA County, and becomes much more Democratic. It is transformed into a 55% Latino Majority district, composed mainly of Lancaster, Palmdale, and areas around San Fernando taken from both the old 27th and 28th districts. Santa Clarita, where McKeon lives, is cut out of the district. For that reason, it is probably more likely that McKeon would run in the 27th, if he runs at all. Howard Berman (D) could also potentially opt to run in either the 25th or the 28th, both of which contain substantial chunks of his old district (but he’ll probably prefer the more strongly Democratic 28th). The 25th district is strongly Democratic, probably somewhere in the mid-60s for Obama.
CA-26
Incumbent: |
?David Dreier? (R) |
Previous District PVI: |
R+3 |
New District estimated Obama/McCain: |
62% Obama, D+9 |
Current District 2008 (Est.) Demographics: |
44% White, 30% Latino |
New District Demographics: |
18% White, 63% Latino |
David Dreier doesn’t really have anywhere to run, as fully 7 districts now include pieces of his old district. His best shot would probably actually be CA-40. The district numbered 26, which includes Dreier’s home in San Dimas, turns into a district with a strong 63% Latino majority. Only GOP leaning Glendora and San Dimas are retained from the old 26th, while predominantly Latino areas like West Covina, La Puente, El Monte, and Irwindale are added from the old 32nd and 38th districts. It probably voted somewhere in the general range of about 62% for Obama, which ought to be enough to doom Dreier here.
CA-27
Incumbent: |
Brad Sherman (D) v. Howard McKeon (R) |
Previous District PVI: |
D+13 |
New District estimated Obama/McCain: |
62% Obama, D+9 |
Current District 2008 (Est.) Demographics: |
38% White, 43% Latino |
New District Demographics: |
48% White, 35% Latino |
The new 27th district adds Santa Clarita, where Howard McKeon lives, and which makes up 2/7 of the new district. To try and avoid making the 27th too Republican, I tried to get rid of the relatively less Democratic parts of his old district in exchange, keeping the more Democratic areas around Northridge. This causes the 27th to become less Democratic, but not much. Sherman should be strongly favored to take out McKeon in this district. It would also be easy to make this district a bit more Democratic if necessary.
CA-28
Incumbent: |
Howard Berman (D) |
Previous District PVI: |
D+23 |
New District estimated Obama/McCain: |
76% Obama, D+23 |
Current District 2008 (Est.) Demographics: |
30% White, 59% Latino |
New District Demographics: |
27% White, 55% Latino |
The new 28th district shifts a bit to the south, picking up part of Burbank and some Latino areas to the east of Hollywood from the 31st district. I’ll just say that it in partisan terms it remains about the same as it is, and may even have become more Demacratic. The 28th should have voted about 76% for Obama – the least Democratic precincts in the district (in Burbank) still voted 65% for Obama! So if any other districts nearby need to become more Democratic, the 28th could be modified to lend a hand without breaking a sweat.
CA-29
Incumbent: |
Adam Schiff (D) |
Previous District PVI: |
D+14 |
New District estimated Obama/McCain: |
61% Obama, D+8 |
Current District 2008 (Est.) Demographics: |
42% White, 26% Asian, 26% Latino |
New District Demographics: |
46% White, 7% Asian, 33% Latino |
Adam Schiff’s 29th district takes on the role of diluting GOP votes in San Bernadino County. The San Bernadino portion of the 29th takes in vast expanses of San Bernadino County taken from the former 25th and 41st districts, including Hesperia, Victorville, and Barstow, which make up just under half the population of the district. In The LA County portion, heavily Democratic areas around Pasadena are combine with strongly Democratic areas around Schiff’s home in Burbank to make this district Democratic – the parts of his old district that he gives up are the relatively more GOP parts. Even given that the San Bernadino part of the district voted for McCain by several points, the LA County part (especially Pasadena) is strongly enough Democratic that the district overall voted about 61% for Obama.
CA-30
Incumbent: |
Henry Waxman (D) |
Previous District PVI: |
D+18 |
New District estimated Obama/McCain: |
64% Obama, D+11 |
Current District 2008 (Est.) Demographics: |
75% White |
New District Demographics: |
68% White |
The white voters in Henry Waxman’s district are liberal enough that redistricting Waxman’s district to make it more Republican actuall actually ends up making it less white. The base of Waxman’s district remains in Beverly Hills/West Hollywood, and then snakes up through the hills towards Ventura County. It crosses over, taking in Simi Valley, Moorpark, and some smaller areas surrounding. In sum, the Ventura component of the district makes up a third of the total population. Waxman remains very much safe.
CA-31
Incumbent: |
Xavier Becerra (D) |
Previous District PVI: |
D+29 |
New District estimated Obama/McCain: |
73% Obama, D+20 |
Current District 2008 (Est.) Demographics: |
12% White, 68% Latino |
New District Demographics: |
20% White, 62% Latino |
CA-31 becomes less overwhelmingly Democratic and less overwhelmingly Latino by giving up some Latinos (indirectly to the 25th) to turn that district into a Latino majority district. In exchange, Nevertheless, it retains a very strong Latino majority (62%). Becerra picks up some less Democratic (but not really GOP) areas in Glendale and La Canada Flintridge from the old 26th and 29th districts. These new areas only make up 1/4 of the district, which remains heavily Democratic. It should be something like 73% for Obama now, which could easily be off a couple points depending on Latino turnout. Not that it matters – Becerra is utterly safe.
CA-32
Incumbent: |
Judy Chu (D) |
Previous District PVI: |
D+15 |
New District estimated Obama/McCain: |
63% Obama, D+10 |
Current District 2008 (Est.) Demographics: |
12% White, 20% Asian, 65% Latino |
New District Demographics: |
24% White, 44% Asian, 28% Latino |
CA-32 is transformed from a Latino majority district into a strong Asian-American plurality district (with Dreier’s 26th becoming a Latino majority district to offset the change). I will say up front that Asian Americans are not a monolithic group, and I have no real idea how the “Asian” population breaks down. I just tried to make the district as “Asian” as possible. The best I could figure out how to do while keeping it relatively compact was 44%. With an earlier version I was able to get the Asian population higher, but that district was a true monstrosity, stretching here and there all over the place and even had a tentacle reaching into Irvine in Orange County.
The district is substantially reworked, combining areas within the old 32nd with areas from the 26th, 29th, 38th, and 43rd. It includes in the north/west Sierra Madre, Monrovia, Arcadia, San Marino, South Pasadena, Temple City, Gabriel, Alhambra, Monterey Park, and Rosemead. Then it crosses through Whittier and La Habra Heights to pick up substantial Asian populations in Diamond Bar and Walnut. This district is definitely Democratic – it contains only a few McCain precincts – but it is hard to say how much without actually taking the time to calculate partisanship on the precinct level, because it takes from so many different old districts and I don’t know much about the voting patterns or turnout of Asian Americans in this area. I’d guesstimate it is in the low 60s for Obama, but someone that knows the area could probably make a better estimate.
CA-33
Incumbent: |
Diane Watson (D) |
Previous District PVI: |
D+35 |
New District estimated Obama/McCain: |
94% Obama, D+41 |
Current District 2008 (Est.) Demographics: |
21% White, 27% Black, 13% Asian, 37% Latino |
New District Demographics: |
10% White, 29% Black, 11% Asian, 47% Latino |
In order to try and keep the African American percentage in this district relatively high, I cut out some white areas of the district and added some Black/Latino areas. CA-35 has a lot of precincts that voted near unanimously for Obama, and becomes even more Democratic than it already was.
CA-34
Incumbent: |
Lucille Roybal-Allard (D) |
Previous District PVI: |
D+22 |
New District estimated Obama/McCain: |
65% Obama, D+12 |
Current District 2008 (Est.) Demographics: |
8% White, 81% Latino |
New District Demographics: |
21% White, 65% Latino |
In order to increase Latino voting power in other districts while simultaneously diluting GOP votes, this district shifts, while retaining its base in the general area of Vernon. From Vernon/Maywood, the 34th now stretches east through Downey, La Mirada, and then into Orange County, where it adds Fullerton. The Orange County portion makes up only 20% of the district, which is now only 65% Latino. Even given low turnout in Latino LA County areas relative to in Fullerton, this district probably also voted about 65% for Obama – and that will go up with time as Latino turnout gradually increases.
CA-35
Incumbent: |
Maxine Waters (D) |
Previous District PVI: |
D+31 |
New District estimated Obama/McCain: |
76% Obama, D+23 |
Current District 2008 (Est.) Demographics: |
10% White, 28% Black, 6% Asian, 54% Latino |
New District Demographics: |
17% White, 26% Black, 11% Asian, 43% Latino |
What to do with the McCain precincts in South-West LA County around Palos Verdes/Rolling Hills? Why, give them to Maxine Waters, of course! Doing this makes it possible to preserve African American voting strength (by decreasing the Latino percentage) and dilute GOP votes all at once. So this district becomes substantially more White, Asian, and GOP, without becoming much less Black. It is brought down to about 76% for Obama.
CA-36
Incumbent: |
Jane Harman (Blue Dog D) |
Previous District PVI: |
D+12 |
New District estimated Obama/McCain: |
64% Obama, D+11 |
Current District 2008 (Est.) Demographics: |
44% White, 15% Asian, 33% Latino |
New District Demographics: |
44% White, 16% Asian, 33% Latino |
There are no real changes to Harman’s district, I only altered a tiny fraction of the district in the North. At most this might make CA-36 1 point more Republican, with emphasis on “might.”
CA-37
Incumbent: |
Laura Richardson (D) |
Previous District PVI: |
D+26 |
New District estimated Obama/McCain: |
64% Obama, D+12 |
Current District 2008 (Est.) Demographics: |
13% White, 22% Black, 13% Asian, 48% Latino |
New District Demographics: |
31% White, 18% Black, 11% Asian, 36% Latino |
The 26th district is altered to become less overwhelmingly Democratic. In LA County, the 37th retains Compton and its immediate environs, then approaches the county line through Long Beach. It extends in Orange County through inland parts of Seal Beach, Huntington Beach, Westminster, and Fountain Valley, up until it reaches the Santa Ana river. 40% of the district is in Orange County, while 60% is in LA county. Although the OC part voted for McCain, the LA part, rooted around Compton, is enough to make the district about a 64% Obama district that preserves African American political influence.
CA-38
Incumbent: |
Grace Napolitano (D) |
Previous District PVI: |
D+10 |
New District estimated Obama/McCain: |
63% Obama, D+10 |
Current District 2008 (Est.) Demographics: |
10% White, 76% Latino |
New District Demographics: |
28% White, 58% Latino |
The 38th district has to change a good deal in order to accomodate the transition of CA-32 to an Asian plurality district. It sits south of the 32nd, following it as it loops around from the Pico Rivera area through La Habra and Brea in Orange County, and through Chino Hills in San Bernadino County in order to cross back into LA and get to Pomona. At Pomona, it expands further North and West into predominantly white areas (like Claremont) that voted for Obama. The Latino percentage drops more than one might like, but Latinos still make up a strong 58% majority of the district that will be a dominant political force, and with time that majority will increase. The drop also enables the 26th to have a strong 63% Latino majority. This district definitely gets more Republican, but I am not sure precisely how much. I estimate it is something close to D+10 now.
CA-39
Incumbent: |
Linda Sanchez (D) |
Previous District PVI: |
D+9 |
New District estimated Obama/McCain: |
62% Obama, D+9 |
Current District 2008 (Est.) Demographics: |
18% White, 65% Latino |
New District Demographics: |
20% White, 63% Latino |
CA-39 now extends into Orange County, where it picks up 3/7 of the district in the Buena Park/Anaheim area. But the section of Orange County that is added is 40% Latino, 20% Asian, and voted for Obama. The area of LA County retained, which stretches all the way to Southgate, is heavily Latino and heavily Democratic. So the change should have relatively little political effect, with the district becoming maybe a few points more GOP friendly. Linda Sanchez’s district also now borders with her sister’s district (CA-47).
CA-40
Incumbent: |
?Ed Royce? (R), ?John Campbell? (R) ?David Dreier? (R) |
Previous District PVI: |
R+8 |
New District estimated Obama/McCain: |
52% Obama, R+1 |
Current District 2008 (Est.) Demographics: |
42% White, 18% Asian, 34% Latino |
New District Demographics: |
43% White, 15% Asian, 35% Latino |
The new CA-40 retains only a small portion of its old constituents around Anaheim. CA-40 has a very sinuous shape because it is an attempt to hobble together one last winnable Democratic district out of the leftovers from neighboring districts with inflexible shapes (because they are majority minority or are made as heavily GOP as possible). From Irvine, the 40th reaches north through Anaheim, and then through a verynarrow strip of Yorba Linda to cross into San Bernadino County, where it includes Chino, Montclair, and Upland. Most precincts in this district voted for Obama, although not by huge margins. Areas of Democratic strength are Irvine, Anaheim, and Montclair. Areas of GOP strength are included as well, including Upland and Lake Forest at the far Northern and Southern edges of the distict. This district is more a swing district than a Democratic district, but with its large minority population it can probably be expected to continue trending Democratic. Theoretically this is Ed Royce’s district, but he does not live in it any more, and as mentioned earlier it is very different. It bears more in common with the 48th, and GOPer John Campbell lives in this district (in Irvine). But Campbell might rather try his luck in the new 48th or attempt to prevail in a GOP primary in the 44th rather than run here.
CA-41
Incumbent: |
Jerry Lewis (R) |
Previous District PVI: |
R+10 |
New District estimated Obama/McCain: |
53% Obama, D+0 |
Current District 2008 (Est.) Demographics: |
55% White, 6% Black, 33% Latino |
New District Demographics: |
40% White, 11% Black, 39% Latino |
CA-41 contracts entirely within San Bernadino County due to population growth. At first blush, this might seem to be a good thing for Jerry Lewis, because the San Bernadino portion of his district voted more strongly for McCain than the Riverside county portion. But within San Bernadino county, there are some substantial shifts. Conservative areas around Hesperia are shorn off and given to the Pasadena-Burbank based 29th district, and the 41st expands into strongly Democratic San Bernadino city (about half of the district’s population), taking most of the city except the heavily Latino south-west of the city, which remains in the 43rd to maintain the Latino percentage in CA-43 high.
This causes the white population percentage of the district to plummet 15 points to 40%, with about equal parts of the drop made up for with increased Black and Latino populations. Moreover the white voters in the district become more progressive as the population center shifts towards the City of San Bernadino. In the short term, the doubling of the African American population is more politically significant than the Latino increase, because of higher turnout and greater Democratic support than Latinos. But over the long term, the Latino population is likely to drive a continuing Democratic trend as turnout increases. It is at least conceivable that Lewis could survive in the short term in this district, but if he does, he’ll have great difficulty continuing to hold it. But this district is more a swing district than a Democratic district, and probably gave Obama about 53%, which could be off by a few points either way. This district would have a good chance of electing a progressive San Bernadino Democrat, especially after a few more years of Latino population growth.
CA-42
Incumbent: |
None |
Previous District PVI: |
R+10 |
New District estimated Obama/McCain: |
58% Obama, D+5 |
Current District 2008 (Est.) Demographics: |
48% White, 2% Black, 17% Asian, 29% Latino |
New District Demographics: |
32% White, 7% Black, 6% Asian, 51% Latino |
CA-42 disappears from Orange County and reappears in Riverside County. This district consists of the city of Riverside, Perris and parts of Corona and Moreno Valley. This new district has nothing in common with the old 42nd, and most of the district is carved out of the Riverside County portion of the old CA-44. It also has no real incumbent (Ken Calvert lives in Corona, but would almost certainly much prefer to run in the heavily GOP 44th, where he would be well positioned to win the GOP primary).
CA-43
Incumbent: |
Joe Baca (Blue Dog D) |
Previous District PVI: |
D+13 |
New District estimated Obama/McCain: |
63% Obama, D+10 |
Current District 2008 (Est.) Demographics: |
17% White, 65% Latino |
New District Demographics: |
23% White, 62% Latino |
CA-44 shifts slightly to the west, away from the city of San Bernadino and into Rancho Cucamonga, making it just slightly more Republican. But Baca is in no trouble, and his district retains a strong Latino majority.
CA-44
Incumbent: |
?Ken Calvert? (R) ?Darrell Issa? (R), ?Gary Miller? (R) |
Previous District PVI: |
R+6 |
New District estimated Obama/McCain: |
41% Obama, R+12 |
Current District 2008 (Est.) Demographics: |
44% White, 42% Latino |
New District Demographics: |
60% White, 25% Latino |
CA-44 is another one of the few, the proud, the California GOP districts. It combines McCain’s best parts of Orange County (stretching through the North-East of OC, from eastern Anaheim to San Clemente) with some more GOP areas in Riverside County – Norco, part of Corona, Lake Elsinore, and Hemet.
CA-45
Incumbent: |
Mary Bono (R) |
Previous District PVI: |
R+3 |
New District estimated Obama/McCain: |
55% Obama, D+2 |
Current District 2008 (Est.) Demographics: |
42% White, 45% Latino |
New District Demographics: |
35% White, 51% Latino |
CA-45 has to contract due to population growth. It does this by giving up GOP Hemet, while keeping Moreno Valley. This makes a district that Obama won as it was just a bit more Democratic, making it just a bit more difficult for Mary Bono to survive here and actually more sensible geographically as well. CA-45 now has a slight Latino majority, which should continue to make CA-45 more Democratic. Bono faces the choice of struggling to hold on in an increasingly Democratic district, retiring and moving to Florida, or losing the GOP primary in CA-52.
CA-46
Incumbent: |
Dana Rohrabacher (R) |
Previous District PVI: |
R+3 |
New District estimated Obama/McCain: |
60% Obama, D+7 |
Current District 2008 (Est.) Demographics: |
59% White, 18% Asian, 18% Latino |
New District Demographics: |
50% White, 10% Asian, 29% Latino |
CA-46 is changed dramatically. The LA County part of the district is altered to become much more Democratic, while the Orange County bit stays pretty competitive. Just under half of the population in CA-46 is now in Los Angeles County, now taking in most of Long Beach. In Orange County, CA-46 stretches along the coast until it gets to Newport Beach and then inland to Aliso Viejo/Laguna Niguel/Laguna Hills, where it most of the districts’ Orange County population base now lives. CA-37 has more of Rohrabacher’s old constituents, but he does not have any chance at winning there, and he does not have much chance of continuing to win in this new 46th district either.
CA-47
Incumbent: |
Loretta Sanchez (Blue Dog D) |
Previous District PVI: |
D+4 |
New District estimated Obama/McCain: |
60% Obama, D+7 |
Current District 2008 (Est.) Demographics: |
12% White, 16% Asian, 69% Latino |
New District Demographics: |
15% White, 15% Asian, 65% Latino |
CA-47 changes little from the existing district, only really changing by adding all of Santa Anna. It becomes slightly less Latino and a bit more white, but only about a point more Republican. CA-47 is now the only district contained entirely within Orange County.
CA-48
Incumbent: |
?John Campbell? (R) |
Previous District PVI: |
R+6 |
New District estimated Obama/McCain: |
52% Obama, R+1 |
Current District 2008 (Est.) Demographics: |
61% White, 17% Asian, 18% Latino |
New District Demographics: |
44% White, 19% Asian, 29% Latino |
CA-48 is something of a gerrymandered monstrosity, stretching thinly all the way from Santa Margarita in the eastern part of Orange County all the way to South-Central LA around Lynwood. 4/7 of the population is in Orange County, and that part of the district is demographically quite similar to the current 48th but a bit more Republican. The rest of the district, in LA County, is only 23% white, is carved mostly out of the old 39th, and is strongly Democratic. The result is a swing district that probably voted for Obama, but not by that much.
CA-49
Incumbent: |
?Darrell Issa? (R) |
Previous District PVI: |
R+10 |
New District estimated Obama/McCain: |
51% Obama, R+2 |
Current District 2008 (Est.) Demographics: |
52% White, 35% Latino |
New District Demographics: |
54% White, 34% Latino |
CA-49 is an attempt to squeeze one last winnable district out of San Diego County, after drawing 3 safely Democratic districts (CA-50, CA-51, and CA-53), and one extremely Republican district (CA-52). It is Darrell Issa’s district, but because substantial portions of the heavily GOP 52nd come from his old district, there is a good chance he would run there instead – where he would be in a good position to beat Duncan Hunter the younger in a GOP primary. The vast majority of the population is based in San Diego County, including Carlsbad, Vista, and Oceanside. Parts of Encinitas and Escondido are also included. To the north, all of Camp Pendleton is included, and then CA-49 crosses into Orange County, picking up competitive to Democratic leaning areas along a sliver of the coast, running up to Laguna Beach (only 10% of the district is in Orange County, though). This district is something of a hedge – if the swing to Obama in the San Diego area was merely a one time event, especially around Camp Pendleton (a one time Iraq War effect?), this district will likely stay Republican. But if it is a continuing trend, Democrats will have a good shot at picking this district up.
CA-50
Incumbent: |
?Brian Bilbray? (R) |
Previous District PVI: |
R+3 |
New District estimated Obama/McCain: |
57% Obama, D+4 |
Current District 2008 (Est.) Demographics: |
60% White, 22% Latino |
New District Demographics: |
61% White, 15% Latino |
All but a small portion of CA-50 is dragged within the city limits of San Diego (with the remainder in the Democratic Del Mar/Solana Beach/Encinitas area). The most Republican parts of the district are excised and donated to CA-52, while some relatively swingy areas in the north go to the 49th. Given the close races Bilbray has run in the past, a strong Democratic candidate should have a very good chance of defeating him in this district.
CA-51
Incumbent: |
Bob Filner (D) |
Previous District PVI: |
D+8 |
New District estimated Obama/McCain: |
62% Obama, D+9 |
Current District 2008 (Est.) Demographics: |
17% White, 60% Latino |
New District Demographics: |
18% White, 58% Latino |
CA-51 stays basically the same, but becomes marginally more Republican as it adds population (although the PVI gets more Democratic, the Obama vote decreases because there was a large swing to Obama from Bush). Filner will have no difficulty here against the GOP. It’s possible he might one day face a Latino primary challenger, but this is after all a Latino majority district.
CA-52
Incumbent: |
?Duncan Hunter Jr?, (R) ?Darrell Issa?, (R) ?Brian Bilbray? (R) |
Previous District PVI: |
R+9 |
New District estimated Obama/McCain: |
38% Obama, R+15 |
Current District 2008 (Est.) Demographics: |
63% White, 22% Latino |
New District Demographics: |
73% White, 17% Latino |
The new CA-52 is 2/3 in San Diego county and 1/3 in South-West Riverside County. It takes the most heavily Republican precincts it can find in the area, resulting in a very very conservative district. The question is not whether it will elect a Republican, but which Republican will win the GOP primary – it takes GOP heavy parts from CA-45, CA-49, CA-50, and CA-52. It may well actually be even more Republican than I estimated it was (38% Obama).
CA-53
Incumbent: |
Susan Davis (D) |
Previous District PVI: |
D+14 |
New District estimated Obama/McCain: |
63% Obama, D+10 |
Current District 2008 (Est.) Demographics: |
51% White, 30% Latino |
New District Demographics: |
46% White, 35% Latino |
CA-53 stretches to the east, adding competitive areas from CA-52, so that CA-50 can stretch down further into Democratic San Diego. It becomes a bit more Republican in order to make CA-50 a bit more Democratic.
That’s all, folks!
If you liked this diary, do me a favor and contact your Representative and Senators and tell them to support strong Health Care Reform. A strong public option, no trigger, no opt-in, no opt-out. Strong subsidies to make the mandate affordable, open the exchange to everyone, and for crying out loud there’s no reason we should have to wait all the way until 2013 to have it go into effect!


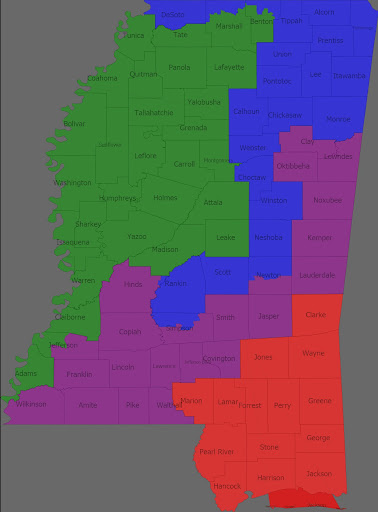