CA: Columbia Law Plans Mapped and Reviewed

Columbia Law School announced last week that they were releasing state-by-state redistricting plans that would include Non-Partisan, Legally Defensible Maps That States Can Use.  These maps were released and Redistricting Partners dove right in to see how useful or legally defensible they were.

The results were a mixed bag.  Some districts showed interesting choices of how to pair communities of interest, and some addressed real problems already being discussed at commission hearings.  However there were significant data shortcomings – mirroring some concerns raised the last time a group outside of California tried to draw our districts.

visit http://redistrictingpartners.c… to see the maps.


Ethnic Concerns

The greatest concern with the Columbia Plan is the lack of sophistication when dealing with Latino VRA concerns.  Instead of using the Citizen Voting Age Population (CVAP) figures they used the more readily available 18+ Latino numbers.  This, however, artificially inflates the eligible voter population within districts that require preclearance or could be the subject of lawsuits.  In fact, the Department of Justice has already released a federal register stating that they will consider a district to have retrogressed if they fail to maintain the same minority percentage of overall population, 18+ population, and CVAP.

The Columbia Law media release boasted 14 majority minority seats under their plan.  In fact, they have 17 districts with more than 50% overall Latino population, but looking at CVAP the number plummets to 3 with an additional two more within the margin of error.[1]

While the Latino concern is a significant flaw, the Columbia Plan did reconnect communities that had been divided in previous decades and create a single majority-minority African American Congressional seat in Los Angeles.  This could be a double-edged sword as creating this seat could cause another African American held seat to move into more Latino territory.

Incumbent Displacement

In this plan 18 incumbents are paired in districts creating 9 newly vacant seats.  Without residency restrictions these members are portable, but the larger question for them is finding a nearby vacant district with an appealing partisan advantage.  Incumbent Republicans Lungren, Gallegly, Calvert and Hunter find themselves in seats with a new Democratic majority, while Loretta Sanchez finds herself in a Republican seat.

In the attached data table the incumbent who lives within the district is listed, but an “ALT” field shows the likely member of Congress who will move into this district.  This is done only in cases where the member has been moved out of a majority of their current district and that district is now vacant.

County / City Choices

While it is inevitable that the final plan will include city and county splits, this plan seems to avoid splits as long as possible, resulting in fewer splits.  However, when splits are made they are horrific.  Long Beach is split into three parts (it is less than one district in population).  The Ventura County border is crossed in three districts.  There are a few seats that include multiple districts in the area of LA, Orange, Riverside, San Diego and San Bernardino.  Because of the unavoidable population patterns, a line drawer could chose to make a nice plan with a couple really ugly districts, or make all districts a tiny bit ugly and avoid any major violations of the Prop11 and Prop 20 principles.  This plan chose the former, creating a few districts that do not pass the smell test.

Numbering

The ability to understand these maps is slightly undercut by the sometimes random numbering.  This, however, could give us practice before the commission plan is revealed as they could number in a completely different fashion.  For these maps and district tables it is best to think of the incumbent or cities in the plan, not the district number.

Maps and Data

The first set of maps are overviews of each region of the state.  The data tables go through the demographics and political data for each district.

to view the maps visit: http://redistrictingpartners.c…

CA :: Cook Uncooked, Part Deux

The latest release of the Political Data Inc.  redistricting package allows us to look at the 2010 election results by contest.  So, using the congressional results from last election cycle I was able to construct election results as if the Cook plan had been implemented.

An obvious caveat is that these elections never happened.  Incumbents who had an easy ride in the existing lines would be fighting a different battle.  But it’s also true that the challengers – many of which were unimpressive and unfunded – would be cut from a different mold in a newly competitive seat.

Cook Uncooked Part Deux

CA Maps by Cook Report – Analyzed

At the end of last week the Cook Political Report came out with a set of district lines as an approximation of what the Citizens Redistricting Commission would create.    The lead to their story reads:

What happens when politicians who have grown accustomed to the luxury of choosing their voters are forced to cede redistricting authority to a group of amateur citizen commissioners? In this gigantic laboratory of reform, more than a handful of incumbents are rightfully fearful they will be sacrificed for science. House Editor David Wasserman maps out some of the most talked-about speculative scenarios and outlines who could be in trouble. A “blank slate” commission map could endanger up to 15 incumbents and create as many as five new opportunities for Hispanic candidates

The Cook report identifies a number of Congressional members who are in the most gerrymandered seats and need to be concerned about redistricting.  These include:


Republicans

Dan Lungren (CA-03)

Elton Gallegly (CA-24)

David Dreier (CA-26)

Gary Miller (CA-42)

Ken Calvert (CA-44)

Democrats

Jerry McNerney (CA-11)

Sam Farr (CA-17)

Dennis Cardoza (CA-18)

Jim Costa (CA-20)

Brad Sherman (CA-27)

Howard Berman (CA-28)

Laura Richardson (CA-37)

Grace Napolitano (CA-38)

Bob Filner (CA-51)

and whoever wins the CA-36 special election in June.

Criticizing maps is easy, while drawing them can be a challenging task.  Some of the shortcomings we identify in the Cook Plan could be a function of them not having access to the same data tools.  However, given that this is the first widespread release of a legitimate plan from a trustworthy source, it requires some honest analysis.

Overall there are several things that are right and wrong with the plan.

What’s right about the Cook Maps:

1)    The shift from the coastal area to the Central Valley and Inland Empire reflect a current reality – and an unavoidable result of the redistricting process.

2)    Bay Area districts don’t cross the Bay Bridge or Golden Gate.  This preserves county/city lines and communities of interest, but would weaken the city of San Francisco if the same rule was applied to the Senate districts.

3)    The plan appears to keep more cities and counties intact than the 2001 plan.

4)    While competitiveness is not an official criteria, it is meaningful in the public’s eye, and this plan makes several districts more competitive.

What’s wrong:

1)    The plan plays way too loose with the Voting Rights Act, retrogressing several Section 2 districts, splitting the Section 5 county of Merced, and putting Kings County into a totally different seat.  In fact, it appears to water down the Citizen Voting Age Latino Population in every Section 5 district except Herger (which is only 10% Latino CVAP currently).

2)    Several districts, particularly the Dreier (CD 26) seat, cross county lines unnecessarily and oddly so that they run afoul with several criteria, including geographic compactness and maintaining communities of interest.

3)    The City of LA does not seem to be preserved at all.  Several little cities are merged with the larger city.  This could be due to the inability to truly see the city lines in the application they were using.

The data tables on my page go through each district to review ethnic and partisan changes in the districts.  The analysis was done only after redrawing the lines in Maptitude, the database/mapping software that is being used by the Commission.

The data used in this analysis comes from the latest US Census release and the Beta release of data from Political Data Inc. which allows census-block level analysis of party affiliation, voter turnout, results and electoral modeling.

Ethnic Breakdown Tables

The charts on my site provide ethnic breakdown of the 53 districts in the Cook plan.  Section 5 and Section 2 Majority-Minority districts are highlighted in red.  A Majority-Minority district for the purposes of this analysis is the most liberal interpretation – one that is majority Latino in 18+ Population or Citizen Voting Age Population.

Of the 11 Majority-Minority Latino or Section 5 seats in California, all but three of them have retrogressed under the Cook Plan.

Several other interesting seats are highlighted in orange.  These include the Barbara Lee and Laura Richardson seats, both of which lose African American voting strength, while Mike Honda and Doris Matsui see slight increases in Asian populations.

Partisan/Voting Behavior Breakdown

The the second set of data charts voter registration and partisan turnout.  This is built from census-block level geocoded County voter files and only available through Political Data Inc.

The double digit shifts AWAY from the party in control of that seat are noted in red.  The only double-digit improvements are for Billbray and Royce, however the Billbray improvement could have to do with a district number-switch that was uncorrected from the Cook Plan.

Note on Data: Ethnic totals are 2010 official Census release for redistricting.  Citizen Voting Age Population (CVAP) is estimates from the Census Department released in February 2011.  Voter registration data is directly from the current statewide voter file managed by Political Data Inc.

This Memo availalable in PDF: Cook Uncooked

Maps and Charts: Cook Uncooked

By what margin will Bob Shamansky win?

View Results

Loading ... Loading ...

CA Majority Minority Districts using CVAP

The US Census release last month of Citizen Voting Age Population allowed me to run all the Assembly, Senate and Congressional districts to find their estimated CVAP Latino, CVAP African American and CVAP Asian.  

The news that stands out is that there are 20 districts, 9 Assembly, 5 Senate and 6 Congressional, that are Majority-Minority – and ALL are Latino.  

See all the numbers here: Http://www.redistrictingpartners.com/PDI

Here are the highlights for Congressionals:

Highest Latino CVAP

38 (D) Napolitano 65.3%

34 (D) Roybal-Allard 64.8%

32 (D) Chu 53.6%

39 (D) Sanchez 51.8%

43 (D) Baca 51.7%

20 (D) Costa 50.5%

31 (D) Becerra 49.9%

51 (D) Filner 47.8%

Highest African American CVAP

35 (D) Waters 43.6%

33 (D) Watson 35.7%

37 (D) Richardson 31.2%

9 (D) Lee 25.3%

Highest Asian CVAP

12 (D) Speier 31.8%

13 (D) Stark 31.3%

15 (D) Honda 29.1%

16 (D) Lofgren 28.0%

8 (D) Pelosi 27.0%

29 (D) Schiff 24.1%

32 (D) Chu 23.5%

Even though California has a commission process with its own set of rules, the first rule is “follow the VRA” which would suggest that they would first work to keep these districts from retrogressing.

This strategy, in fact, was exactly what the Republican-leaning Rose Institute suggested: Start with the VRA seats, then draw the rest of the state with the new rules.

By what margin will Bob Shamansky win?

View Results

Loading ... Loading ...

CA CD36 – Open Seat, two big candidates

Potentially the hottest California Congressional race in a decade, a matchup between Secretary of State Debra Bowen and Los Angeles City Councilwoman Janice Hahn provides a great opportunity to show how mapping can inform each campaign.

Hahn is in. Activists on Twitter are saying that Bowen will decide by Tuesday. Marcy Winograd, who ran unsuccessfully in 2010 is mulling a run, and Republicans Mattie Fein and Nathan Mintz could still be in the mix. The following uses Maptitude to explore what the candidates are going to face.


CD36 Registration [PDF]

This coastal area has elected Republicans in the past, and it can be seen how in this map. Many of the higher income portions are either Republican leaning or narrowly Democratic. However the northern part of the district, including the city of LA portions makes this a safe Democratic seat.


CD36 Latino Density [PDF]

The Latino density is greatest inland and in the southern area where Hahn is most well known. Latinos could be a Hahn strength provided that these communities show up in a low-turnout election.


CD36 African American Density [PDF]

African American residents are more inland than CD 36, with only a small representation, mostly in the West Carson and LA portions of the district. Normally the African American vote would be a strong factor for Hahn as she and her father have strong support within that community. There has been some discussion that the district would have a larger African American base if the Commission made the coastal lines East/West rather than North/South. This would create two South Bay seats in which African Americans could be influential, however do so potentially at the expense of coastal communities of interest.


Asian Density [PDF]

Asian Voters could be a key voting bloc in this contest with the densest concentrations inside Torrance. Clearly this is a race where Ted Lieu would have been formidable, if he weren't in the middle of his own race for State Senate.


Hahn v. Newsom in CD36 [PDF]

Janice Hahn ran for Lieutenant Governor in June 2010, and this map shows where she won and lost, by precinct. A sitting councilmember with massive Name ID losing to a mayor from San Francisco in her LA backyard shows a major point of vulnerability.


Harman v. Winograd in June 2010 [PDF]

Marcy Winograd ran against Congresswoman Jane Harman in the June 2010 primary. Her campaign was primarily fueled by a progressive backlash to Harman who has been hawkish on middle east issues. As this map shows, a number of the most progressive precincts, particularly those up in the Venice area preferred her over Harman.


Bowen v. Ortiz 2006 Primary [PDF]

The 2006 primary election for Secretary of State was a low-interest down ballot race with Ortiz performing strongly among Latinos. This can be seen in this map where the West Carson portion of the district is strongly supportive of Ortiz. However, Bowen wins the vast majority of the district, ultimately winning by a large margin.


Hahn Results in Districts 31 – 39 [PDF]

We know from the maps below that in the 2010 Democratic Primary for Lieutenant Governor Janice Hahn lost a chunk of precincts to San Francisco Mayor Gavin Newsom. But how does this relate to her performance in other parts of LA? As this map shows, Hahn won Congressional Districts 31-39. But of those CD 36 was her worst performance. In the districts mapped, Hahn beat Newsom by an average of 31 points, but in CD 36 she only beat him by 9 points. The heavy lift for the Hahn campaign will be confronting the fact that she is extremely popular in the city core, but had her worst election night performances along the coast. 


Hahn and Bowen Races – side by side [PDF]

This compares the 2006 Bowen v. Ortiz race to the 2010 Hahn v. Newsom race, showing something local activists may already understand: Bowen is strongest in the most liberal and white portions of the district, while Hahn is strongest in the more urban LA and West Carson portions. This should be very concerning to Hahn as her base of support is also the lower registration and turnout part of the district.

California Redistricting Patterns by Region

The coming redistricting in California will see two significant forces working to give the new lines.  The first is population, how it has grown and shifted since the last maps were drawn.  The second is the commission process that will follow set rules around keeping cities and counties together, compactness, communities of interest, and drawing lines without considering where candidates live.

To survey the political landscape I put together this chart showing population growth in each congressional district.  While the commission does not need to start from the existing lines, this does show the disparity in population growth among current districts.

Swing State readers should quickly realize that districts with the greatest overages are Republican.  This is seen statewide where Republican congressional seats are on average 42,000 over target population, and Democrat-held seats are 28,000 under.

Tightly packed Democratic seats like those in Los Angeles will have to geographically expand, stealing population from other neighboring Democrats to gain the requisite number of residents.  Conversely, Republican districts will be contracting as they give up voters, and could provide more opportunity to other Republicans.

Current Congressional Districts and Variation from 2010 Projected Targets

Member Residence Variation

1 Mike Thompson D St Helena Under By 19,552

2 Wally Herger R Chico Over By 23,927

3 Dan Lungren R Gold River Over By 52,873

4 Tom McClintock R Elk Grove Over By 78,971

5 Doris Matsui D Sacramento Over By 21,151

6 Lynn Woolsey D Petaluma Under By 82,302

7 George Miller D Martinez Under By 47,071

8 Nancy Pelosi D San Francisco Under By 28,457

9 Barbara Lee D Oakland Under By 47,004

10 John Garamendi D Walnut Grove Under By 4,079

11 Jerry McNerney D Pleasanton Over By 68,602

12 Jackie Speier D Hillsborough Under By 73,416

13 Pete Stark D Fremont Under By 59,603

14 Anna Eshoo D Atherton Under By 47,104

15 Mike Honda D San Jose Under By 17,541

16 Zoe Lofgren D San Jose Under By 7,756

17 Sam Farr D Carmel Under By 63,360

18 Dennis Cardoza D Merced Over By 27,745

19 George Radanovich R Mariposa Over By 49,586

20 Jim Costa D Fresno Over By 18,060

21 Devin Nunes R Tulare Over By 75,114

22 Kevin McCarthy R Bakersfield Over By 71,524

23 Lois Capps D Santa Barbara Under By 54,321

24 Elton Gallegly R Simi Valley Under By 29,472

25 Howard McKeon R Santa Clarita Over By 4,084

26 David Dreier R San Dimas Over By 10,372

27 Brad Sherman D Sherman Oaks Under By 41,458

28 Howard Berman D Los Angeles Under By 37,913

29 Adam Schiff D Burbank Under By 39,041

30 Henry Waxman D Los Angeles Under By 31,871

31 Xavier Becerra D Los Angeles Under By 55,157

32 Judy Chu D Monterey Park Under By 54,149

33 Diane Watson D Los Angeles Under By 36,444

34 Lucille Roybal-Allard D Los Angeles Under By 47,705

35 Maxine Waters D Los Angeles Under By 39,585

36 Jane Harman D Los Angeles Under By 34,005

37 Laura Richardson D Long Beach Under By 36,943

38 Grace Napolitano D Norwalk Under By 51,103

39 Linda Sanchez D Lakewood Under By 44,407

40 Ed Royce R Fullerton Under By 37,637

41 Jerry Lewis R Redlands Over By 100,829

42 Gary Miller R Diamond Bar Under By 10,593

43 Joe Baca D Rialto Over By 57,355

44 Ken Calvert R Corona Over By 191,982

45 Mary Bono Mack R Palm Springs Over By 200,712

46 Dana Rohrabacher R Huntington Beach Under By 40,074

47 Loretta Sanchez D Anaheim Under By 43,323

48 John Campbell R Irvine Over By 437

49 Darrell Issa R Vista Over By 65,129

50 Brian Bilbray R Carlsbad Over By 13,076

51 Bob Filner D San Diego Over By 7,693

52 Duncan Hunter R Lakeside Under By 25,845

53 Susan Davis D San Diego Under By 25,626

The following shows variations for congressional districts by region, however they do not match county growth perfectly as several Congressional districts overlap counties and skew the numbers.

Variation from Ideal 2010 Population, by Congressional Districts in Regions

.: Northern California +4.5% 4 districts over by 175,000, 1 under

.: San Francisco Bay -5.8% 11 districts are under by 415.000

.: Central Valley +6.9% 5 districts over by 240,000

.: Los Angeles -5.5% 13 districts under by 550,000

.: Orange County +1.4% 1 district is over, 4 are under

.: San Diego +1% 2 districts are under, 3 over

.: Inland Empire +11.4% 8 districts are over by 640,000

Regional Differences…

San Francisco Bay Area

Bay Area congressional districts have largely not kept up with statewide growth, putting them under the required population by about 4.5%.  The only exception is the Jerry McNerney district, but the growth in this district is primarily within the San Joaquin portion.  Excluding McNerney, the remaining ten districts need to expand to capture another 415,000 residents.  

Excluding the McNerney district the remaining Bay Area seats have to grow 6% on average.  This does not seem significant when looked at for an individual district where it is like adding the city of Pacifica.  However, as each district takes from the next, the impact is added up.  In the end the last district is going to shift by the equivalent of gaining or losing a city the size of Oakland.

Central Valley and Norcal

Tightly packed urban Democratic seats like those in the Bay Area will have to geographically expand, stealing population from other neighboring Democrats to gain the requisite number of residents.  Conversely, Republican districts like these in the Central Valley and Northern California will be contracting as they give up voters, and could provide more opportunity to other Republicans as these regions add a district.

Aside from population, the requirements for geographic compactness and keeping cities and counties together will wreak havoc on the current districts.

Los Angeles

As can be seen above, the cumulative impact of shrinking population is that LA districts have to go searching for an additional 540,000 residents.   In a redraw that follows the new commission rules this should cause the loss of one congressional seat for the region.

The greatest volatility could come in the San Gabriel Valley where population growth has been slowest. The districts of Grace Napolitano (CD 38), Judy Chu (CD 32) and Xavier Becerra (CD 31) have only had growth of 2-2.5% – putting them under the state average by approximately 8%.  Furthermore, South and West facing beaches limit the ability for districts in the City of LA to move in either of those directions, meaning that expanding districts must shift North and East – likely toward the Inland Empire that has seen the highest growth rate in the state.

The only district in Los Angles with an overage is also the only district held by a Republican.

Orange County

Orange County congressional districts have largely not kept up with statewide growth putting them under the required population by about 5%.  The only exception is the Ken Calvert district, but the growth in this seat is primarily within the Riverside portion of the district.  Excluding Calvert, the remaining five districts need to expand to capture another 130,000 residents.

While Orange County currently has six congressional members, it only has four who live within the county.  The districts held by Miller and Calvert extend from Orange County into Riverside and San Bernardino where those members live.  Given Orange County population estimates, the county should have 4.25 members of congress.  

San Diego

Overall growth in San Diego is just 1% above the state average.  Yet that shifts to about 1% under the state average after accounting for the Issa District that overlaps with Riverside and the Filner district that takes in the Inland Empire.  As can be expected, it is the southern, more densely populated portion of San Diego that has had the least growth.

Inland Empire

Past redistricting efforts have not done a good job of keeping the Inland Empire intact or creating lines that benefit this growing portion of the State.  The area has eight congressional seats with only three districts entirely within its boundaries and five that overlap from Los Angeles, San Diego and Orange Counties.   Half of the Inland Empire’s congressional representatives live outside of the three-county area.

In a redraw that respects city and county lines and pays no regard to where current members live, it can be expected that the three Congressional districts entirely within the Inland Empire would increase to five, and the districts that only dip into the Inland Empire would be stopped at the county lines.  This would be an increase in the region’s true representation, but a decrease in the number of representatives that have any part of the Inland Empire.

California Congressional Redistricting if Prop 20 passes

In just a few days California voters will make final decisions on redistricting that will either expand the public commission process, or eliminate it entirely.  These competing ballot measures, Prop 20 and 27 respectively both have intensely waged campaigns with big bucks from conservative backers taking on incumbent legislators and congressional members.

The latest polling has Proposition 20 passing and 27 losing.  But what will that do for the state’s congressional delegation?

Using Dave’s Redistricting App I was able to draw these lines based on the criteria for the commission.  These include geographic compactness, maintaining city and county lines, working to preserve communities of interest.  What this avoids is looking at where incumbents live (the commission can’t know) or trying to draw lines based on any partisanship or competitiveness goal (the commission can draw no line to advantage or disadvantage a party).

Dave’s App is a bit dated in terms of its population estimates, so using current data the urban districts would likely expand a bit and rural districts would likely shrink.  This is only an approximation and presents some of the challenges if a commission were to handle the redraw.

The numbering is not relevant and can really serve to confuse.  Often times I will hear from a legislator or congressman “my district 18 is going to pick up this city” but under the commission both the numbering and the communities in a district will be determined by scratch.  This fallacy diminishes the extraordinary impact of California’s decision to go to a lay board for political redistricting and give them the rules/restrictions that we have.

For the purposes of reviewing this plan I am describing districts by their core city or county, and where there are arbitrary numbers I may reference them, but it is a waste to get caught up into a discussion of why the 11th is in Southern California… that doesn’t matter.
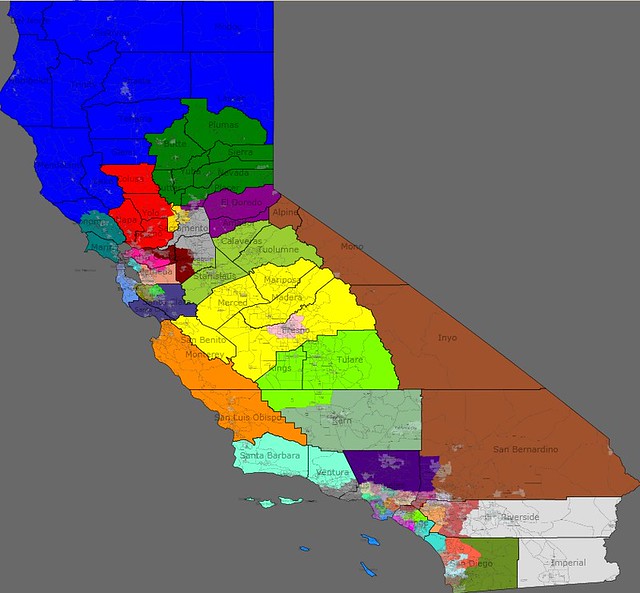
Statewide Map

Population Shifts

The biggest factor in redrawing California (either through the legislature, commission or courts) is the uneven growth between rural and urban communities.  Growth statewide for the past 10 years has been approximately 10%, with 5% growth in San Francisco, 3.5% growth in Los Angeles, and 35% growth in Riverside (inland southern California).  That means urban districts expand as they reach to gobble up 1/53rd of the state’s population, while rural districts contract for the same reason.

Boxed In

Aside from the obvious borders with Oregon, Nevada, Arizona and Mexico, plus a huge ocean, there are also two mountain ranges that provide some relatively impenetrable boundaries for map drawers.  In this map the central coast is drawn vertically because it doesn’t make sense to cross mountain ranges.  The central valley is more “boxy” then the high desert is again vertical and long to take in population.  San Francisco is in a way the easiest part to draw because map makers can start with an assumption that they will not cross a body of water and county/city lines in order to merge two communities (Marin and San Francisco) that do not share a lot of interests.  So, the Bay Area map is first constrained by this factor, and population within the city pushes districts southward.

The Channel

One of the most interesting parts of the state is the Central Valley, specifically San Joaquin County.  If mapmakers were to start in San Joaquin they could easily draw one congressional seat that would take it’s 687,000 residents.  But this is not possible when looking at the whole state.  

As the Bay Area gets drawn there are leftover residents in Alameda and Contra Costa Counties, and as the Northern districts are drawn there has to be an outlet for those excess residents.  San Joaquin is perfectly located at the confluence of these two streams, and as overflow comes down the entire central valley acts as a channel for districts that need to expand to gain required population.  

Neatness

Overall the new congressional map is going to look neater.  Districts will take on odd shapes where that is the underlying geography or county / city lines, but where two cities or counties are combined they are adjacent.  Based on the new rules line drawers are not going to purposefully capture one community by going around or past another closer similar community.

This map gets the state’s 53 districts into sets of approximately 690,000 with a variation of +/- 2%.  Getting them perfect using projected 2009 data seemed an unnecessary headache.  When the 2010 census information becomes available the lines will be redrawn in real GIS software using the new data.
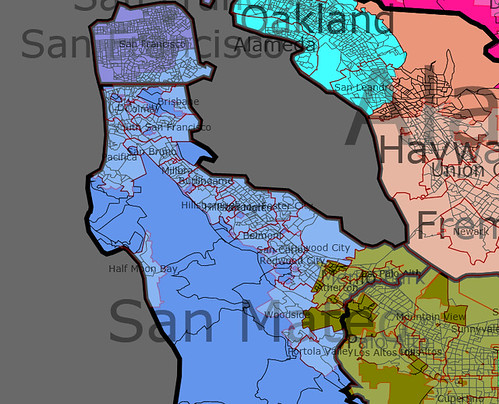
Bay Area Map

The Bay area begins in San Francisco, both figuratively and in this case literally.   Lines for the legislature and congress have crossed bodies of water, but under the commission rules it is extremely unlikely that they would draw a congressional district that crossed either the Bay Bridge or Golden Gate.  The political geography starts at the top of San Franciso and counts south until you run out of residents.  In this map I have favored geographic compactness, placing the south eastern portion of San Francisco into the San Mateo district.  Without any emphasis on drawing districts that are neat or compact the better choice would be to draw the San Francisco district as a crescent, with the south-eastern part of the city becoming part of the seat to the south.  

The San Mateo seat would take in 90% of San Mateo – and depending on the final census this district could grow to take more of San Mateo.  

Also seen in this picture are the Northern Santa Clara seat to include a number of smaller cities like Cupertino, Mountain View, Los Altos and Sunnyvayle.  This district goes up to the border of San Jose but should be able to avoid crossing that city line.  

The map also gives a peek at the Alameda seats – one that neatly places Oakland, the city of Alameda and Albany into one district, and Hayward, Fremont and Union City into another.  The casualties in Alameda County are San Leandro that is nearly impossible to keep whole, and Dublin and Livermore that have to be shipped into a Contra Costa district.  Keeping Alameda County together is impossible and Contra Costa became a pass thru for Alameda’s excess population.

Los Angeles Map

Los Angeles is a tough part of the state to draw.  There are long simmering changes in the core of the city where African Americans are being displaced by Latinos, conservative pockets of voters in the South Bay and San Gabriel Valley, extremely liberal white voters in Santa Monica, a strong LGBT population in West Hollywood, and a San Fernando Valley community that has sought to secede from the city.  

In addition to the principles of geographic compactness, preservation of city lines and traditional communities of interest, I have also followed some of the flow of the city as I understand it from living there most my life.  In the end I found that freeways were a significant geographic factor – which is appropriate or poetic for Los Angeles, the birthplace of freeway commuters.  There is a district along the 210 freeway, another along the 10, one that follows the 405.

I tried to avoid totally dividing the San Fernando valley, with an interest in treating it almost as if it was a city itself.   However, this had significant negative consequences in other parts of the County.  I may try to address this with different lines when new data is available.

South Bay and South LA districts

The driving factor in drawing the South Bay is Long Beach.  The city of LB plus a portion of LA that comes into the port, Wilmington, Harbor City and part of San Pedro makes a strong district with shared interests and neat following of city lines.

After drawing these lines there are several obvious districts to follow.  North/northeast of Long Beach is a strong Latino district (61% Latino) with small cities, to the North/northwest are is a traditionally African American base of Compton, Carson, Inglewood (30% African American), then to the west is a good coastal district.  

Santa Monica is a major LA area city and there are two options for drawing its congressional seat.  Mapmakers could take it up to Malibu and Ventura county based on a coastal community of interest, or it can draw the district into LA and absorb the strongly LGBT city of West Hollywood.  I chose the latter option.

Downtown LA districts

The LA city districts are shaped by the contours of the LA basin and some spillover population needs from the neighboring districts.  Both are over 60% Latino and the southern one is just 2% white.  Just to the east of downtown is a district that brings together several small cities, including the now world famous city of Bell.  This district is 87% Latino.  

San Fernando Valley districts

This map gives the San Fernando valley two congressional seats, one of which takes in the City of Burbank that is not technically part of LA city’s San Fernando Valley, but is often considered a “Valley” community.  Under this plan the Valley suffers from encroachment on all sides.  If the plan was started in the San Fernando Valley three congressional districts could be drawn, but that could be at the expense of other parts of the city.

San Gabriel Valley

The San Gabriel Valley is drawn horizontally, following the 210 freeway and foothills from Glendale to Pasadena and other smaller communities, then continues along the same plane to reach into San Bernardino.  Below the foothills there are districts that follow the 10 freeway and 60.  

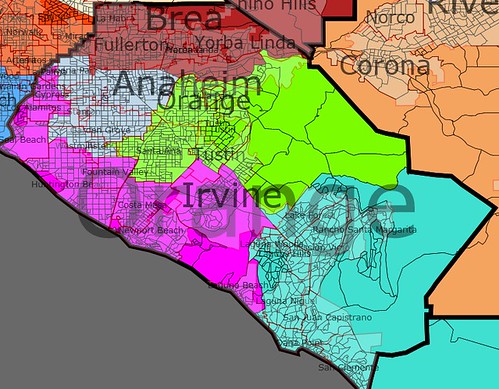
Orange County districts

The conservative base of California, Orange County has in the last 20 years grown a strong Latino community of Democratic voters in and around Santa Ana and an adjoining conservative base of Vietnamese voters in and around Garden Grove.

The district begins in the south with the encroachment from Northern San Diego county.  This puts Laguna Niguel and southern Orange County in with Oceanside, following the 5 and 405 freeways and the new toll highway 73.  

The coastal district brings in Huntington and Newport beaches, and reaches up to Cypress in an attempt to go inland without dividing a major portion of the Vietnamese community.  

Inland Orange County has one district where Vietnamese will be an influence community, and another where Latinos will have a strong voice.  The Northern Orange County district bleeds out into San Bernardino and toward the Ontario airport.

I am happy to answer questions about any other parts of the state and discuss the challenges facing the commission if they are charged with drawing congressional lines.  Doing a from-scratch new map provides them with a huge opportunity and challenge.

Please leave comments and I will monitor/respond.