I wanted to take a look at what redistricting might look like in three Southern states (Alabama, Louisiana, and Maryland) with large black populations if, within each state, three VRA districts were created. Right now, Alabama has one VRA district, Louisiana has one, and Maryland has two; this diary has maps that raise that number to three in each state. I also wanted to take a look at what the political implications of this would be on a state-by-state basis; would Democrats be hurt or helped by such plans? Please read on to find out more and leave your comments and feedback as well. Thanks!
Alabama
Statewide Map
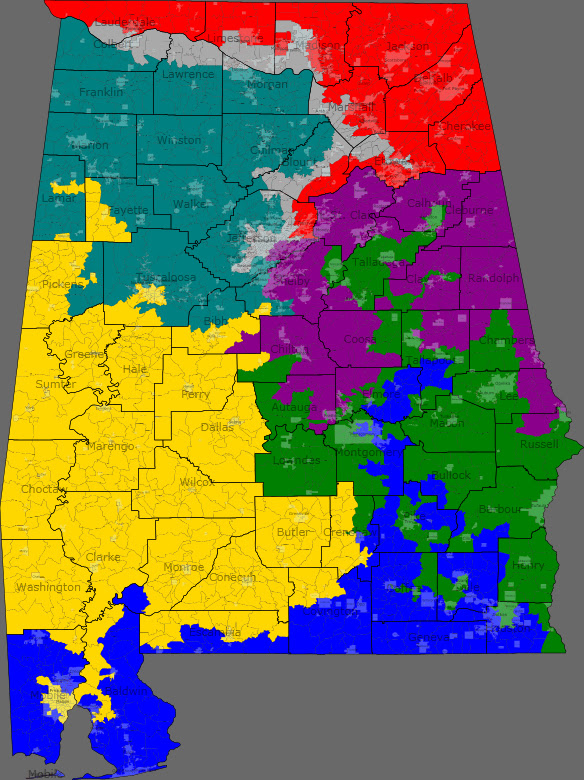
District 1 (Blue): South Alabama-Mobile, Dothan, Montgomery
Demographics: 83% white, 11% black
This is a strongly Republican district that picks up the white parts of South Alabama and then snakes up north past Montgomery. Incumbent 1st district GOP Rep. Jo Bonner would easily win in this district.
District 2 (Green): South/East Alabama-Dothan, Montgomery, Troy, Auburn
Demographics: 48% black, 48% white (black plurality)
This district picks up black areas in South Alabama and Montgomery, and then goes northward all the way to Anniston. This district should be Democratic due to a slight black plurality. While current 2nd district Democratic Rep. Bobby Bright would probably love to have a district like this, he might be vulnerable to a black challenger in a Democratic primary.
District 3 (Purple): East Alabama and Birmingham suburbs/exurbs-Birmingham
Demographics: 85% white, 10% black
This is a very Republican district that essentially combines the eastern half of the current 6th district (Birmingham suburbs and exurbs) with the mostly-white and rural northern areas of the current 3rd district. The homes of two incumbent GOP congressmen, 6th district Rep. Spencer Bacchus (from Vestavia Hills in Jefferson County) and 3rd district Rep. Mike Rogers (from Saks in Calhoun County) are both in this district so they would likely face off in a primary that I think Bacchus would be favored to win.
District 4 (Red): North Alabama-Florence, Madison, Huntsville, Albertville, Gadsden
Demographics: 87% white, 6% black
This is an extremely Republican district in North Alabama that has some of Obama’s worst areas and would be easily won by the probable congressman for the current 5th district after the 2010 elections, Republican Mo Brooks of Huntsville.
District 5 (Yellow): Southwest Alabama-Mobile, Selma, Greenville, Tuscaloosa
Demographics: 51% black, 46% white
This district takes in many of the non-Birmingham areas of the current 7th district in what is known as the Black Belt, and it now reaches down all the way into Mobile. This district has a black majority and would be an open seat almost certainly won by a black Democrat.
District 6 (Teal): Northwest Alabama, Birmingham suburbs/exurbs-Birmingham, Tuscaloosa, Cullman
Demographics: 88% white, 6% black
This would be a safe GOP district that merges the western halves of the current 4th and 6th districts and would likely be won by Republican Congressman Robert Aderholt, who lives in Winston County.
District 7 (Gray): Urban Birmingham and North Alabama-Birmingham, Gadsden, Huntsville, Florence
Demographics: 53% black, 41% white
This black-majority district brings the number of VRA districts in Alabama to three by picking up urban Birmingham and then snaking through North Alabama into Gadsden, Huntsville, and Florence. It will be represented by a black Democrat, probably either Teri Sewell or Shelia Smoot.
So overall, Democrats will likely gain from this map. While it essentially closes the door on ever winning any of the 4 white majority districts (all of which are now at least 85% white), it creates 3 districts that should easily fall into Democratic control, unlike the current map, which really only has one safe district for Democrats (the 7th district). So we would see a likely change from either 5R-2D (Bright wins in 2010) or 6R-1D (Bright loses in 2010) to 4R-3D.
Louisiana
Statewide Map
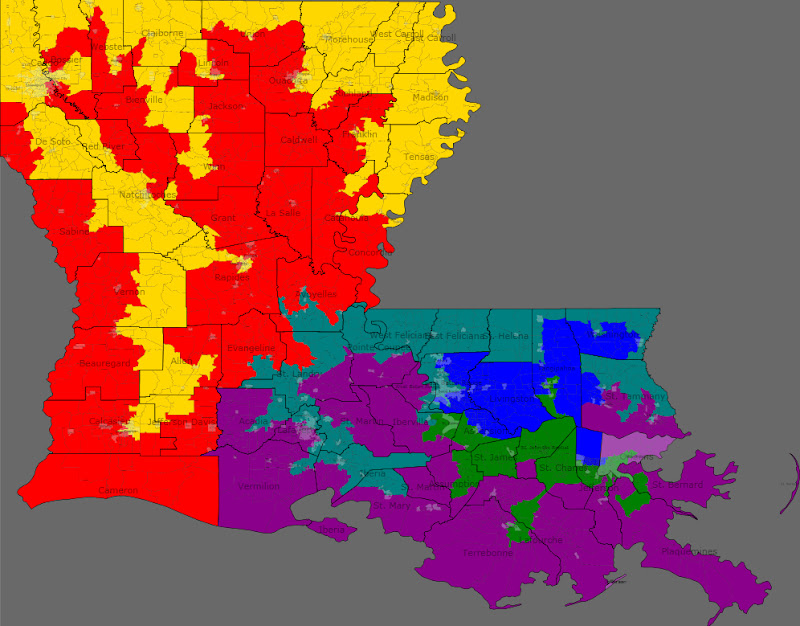
District 1 (Blue): East Louisiana-Baton Rouge, Hammond, Kenner, New Orleans
Demographics: 80% white, 11% black, 6% Hispanic
This is a very conservative and Republican district that picks up white areas between New Orleans and Baton Rouge. Incumbent GOP Reps. Bill Cassidy and Steve Scalise would face off in this district’s Republican primary, and it is about half and half of each of their old districts so neither would really have the advantage of incumbency.
District 2 (Green): South Louisiana and New Orleans-New Orleans, Hammond, Houma
Demographics: 52% black, 39% white
This is essentially a successor to the current black-majority 2nd district, although it must expand south and west to make up for severe population loss from Hurricane Katrina. It retains a black majority, and will easily elect a black Democrat, probably either Cedric Richmond or Juan LaFonta, to Congress.
District 3 (Purple): South Louisiana-New Orleans, Houma, Lafayette
Demographics: 80% white, 12% black
This district has many of the white Cajun areas in the current 3rd district, but now extends to the west to pick up much of Lafayette. This district would likely elect a Republican simply due to its overwhelming whiteness, although there would be a fight in the Republican primary between Hugh Downer of Houma, who will likely be the GOP Rep. for the 3rd district following the 2010 elections, and 7th district Rep. Charles Boustany, whose Lafayette base is now in the 3rd district.
District 4 (Red): West and North Louisiana-Lake Charles, Alexandria, Shreveport, Monroe
Demographics: 82% white, 12% black
This district is intertwined with the new black-majority 5th district, taking up white areas in Western and Northern Louisiana and ending up with only 3 whole parishes, the rest of the parishes in the district being shared with neighboring districts. GOP congressmen Rodney Alexander of Alexandria and John Fleming of Minden (in Webster Parish near Shreveport) would have to battle it out in a Republican primary that Alexander would be favored to win, although either would easily hold the seat in a general election in this heavily white and Protestant district.
District 5 (Yellow): West and North Louisiana-Lake Charles, Alexandria, Nachitoches, Shreveport, Monroe
Demographics: 51% black, 45% white
This new black-majority district snakes around the Mississippi and Arkansas borders and then stretches down all the way to Lake Charles, picking up many black precincts along the way. Perhaps former Congressman Cleo Fields would give it a try in this district, although any black Democrat would be favored to win.
District 6 (Teal): East and South Louisiana-New Iberia, Lafayette, Baton Rouge, Slidell
Demographics: 52% black, 44% white
This is the third black-majority district in the state, taking the black areas of Baton Rouge and Lafayette and the snaking along the border with Mississippi and then all the way down to St. Tammany Parish. It would probably be won by a black Democrat from Baton Rouge or Lafayette.
So Louisiana is another state where Democrats would benefit from having 3 black-majority districts. The balance of power would shift from 6R-1D to 3D-3R, a three seat loss for the Republicans and a two seat gain for the Democrats.
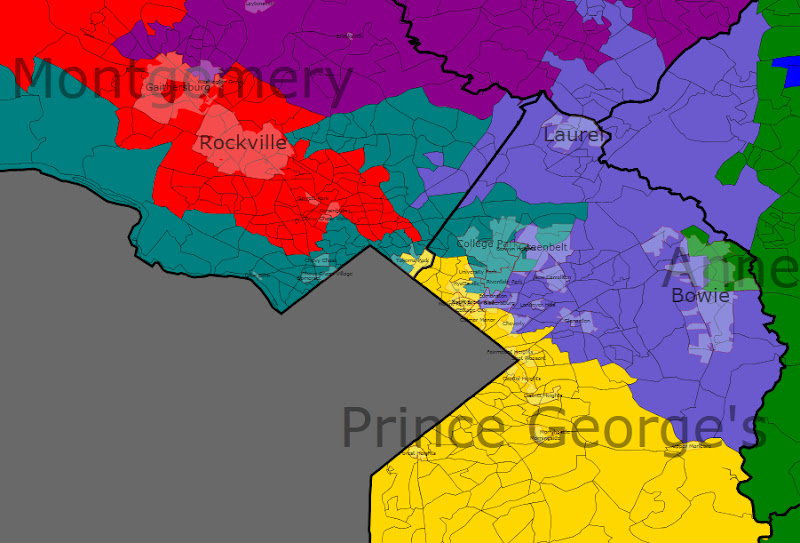
Maryland
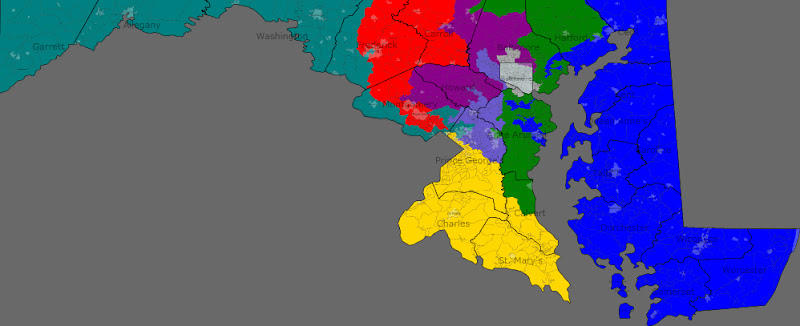
Statewide Map
Baltimore Area Map
D.C. Area Map
District 1 (Blue): Eastern Shore and Baltimore, Harford, and Anne Arundel Counties-Annapolis, Aberdeen, Eaton, Salisbury
Demographics: 74% white, 19% black
2008 pres. results: 50% McCain-48% Obama
By trading heavily Republican suburban areas in Baltimore and Harford Counties with the 2nd district for Democratic areas in Baltimore and Anne Arundel Counties, this district becomes much more Democratic. While John McCain still narrowly won this district, Frank Kratovil would have no trouble winning this district as it is now mostly limited to Democratic areas and his base on the Eastern Shore.
District 2 (Green): Anne Arundel, Calvert, Harford, and Baltimore Counties-Annapolis, Bowie, Dundalk, Bel Air
Demographics: 86% white, 7% black
2008 pres. results: 59% McCain-39% Obama
This is now a heavily Republican district around Annapolis and Baltimore, a result of the creation of a third black-majority district. It was simply not possible to maintain a Democratic 2nd district and still have the three black-majority districts without threatening Democratic control of the 3rd district. As a result, this district was disproportionately packed with Republicans and gave John McCain a 20% margin of victory. We might finally say hello to Congressman Andy Harris, although he would likely be the only GOP member of Congress from Maryland.
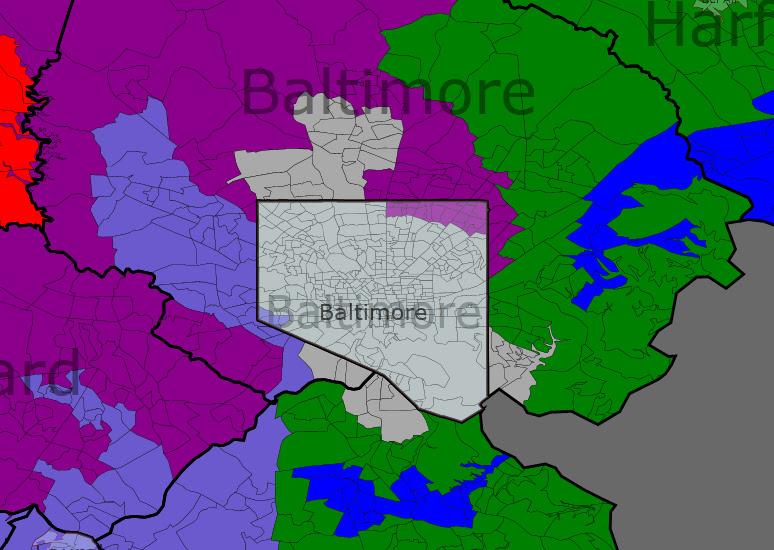
District 3 (Purple): Baltimore, Howard, Montgomery, and Carroll Counties-Gaithersburg, Columbia, Westminster, Towson, Baltimore
Demographics: 69% white, 15% black, 8% Asian, 5% Hispanic
2008 pres. results: 56% Obama-42% McCain
This is a new district that stretches from Montgomery County all the way up to the Pennsylvania border. Both John Sarbanes and Dutch Ruppersberger would likely run in the Democratic primary in this district in order to stay in Congress, although they might split the Baltimore vote, allowing someone from Montgomery or Howard Counties to slip through. A Democrat should win here nonetheless.
District 4 (Red): Frederick, Carroll, and Montgomery Counties-Frederick, Westminster, Rockville, Gaithersburg
Demographics: 66% white, 12% Hispanic, 10% Asian, 10% black
2008 pres. results: 58% Obama-40% McCain
This map is not all bad news for Democrats, as GOP Rep. Roscoe Bartlett sees his Republican district split in half and replaced with two districts where Obama received 59% of the vote. The new 4th district combines most of the current 8th district’s portion of very Democratic Montgomery County with parts of Frederick and Carroll Counties. It has 8th district Rep. Chris Van Hollen’s home in Kensington and Van Hollen could easily defeat the very conservative Bartlett (who would also be 86 years old by Election Day 2012) in this Democratic district.
District 5 (Yellow): Montgomery, Prince George’s, Charles, Calvert, and St. Mary’s Counties-La Plata, Waldorf, Clinton
Demographics: 55% black, 33% white, 7% Hispanic
2008 pres. results: 78% Obama-21% McCain
The first of Maryland’s black majority districts, half of this super-Democratic district is made up of areas from Democratic Rep. Donna Edwards’ current 4th district and Chris Van Hollen’s 8th district, while the other half of the district comes from Democratic Rep. Steny Hoyer’s current 5th district. This new district is 56% black and contains Edwards’ base in Prince George’s County, although it also has Steny Hoyer’s base in Southern Maryland and the House Majority Leader would no doubt be difficult to topple in a primary. I think a primary would be very competitive between the two incumbents, so Edwards might decide to instead run in the new black-majority 8th district.
District 6 (Teal): Panhandle and Frederick, Montgomery, and Prince George’s Counties-Cumberland, Hagerstown, Frederick, College Park
Demographics: 65% white, 14% black, 12% Hispanic, 6% Asian
2008 pres. results: 59% Obama-39% McCain
This district is the second nail in the coffin for Roscoe Bartlett. The conservative rednecks living in the Panhandle are placed in the same district as liberal voters in Prince George’s and Montgomery Counties, and the University of Maryland’s campus in College Park is placed in the district as well. While Van Hollen’s home is in the 4th district, he could easily run here and win, even against Roscoe Bartlett. Former 8th liberal Republican Rep. Connie Morrella would have likely defeated Van Hollen here in 2002 though. I really don’t know which of these two districts Van Hollen and Bartlett would run in, but I think they would both elect Democrats.
District 7 (Gray): Baltimore City and Baltimore and Anne Arundel Counties-Baltimore
Demographics: 55% black, 38% white
2008 pres. results: 80% Obama-18% McCain
This black-majority district takes up nearly all of Baltimore City and some surrounding areas. It is very Democratic and would retain Democratic Rep. Elijah Cummings as its representative.
District 8 (Lavender): Baltimore City and Baltimore, Howard, Anne Arundel, Prince George’s, and Montgomery Counties-Baltimore, Columbia, Laurel, Bowie, Greenbelt
Demographics: 55% black, 29% white, 8% Hispanic, 6% Asian
2008 pres. results: 84% Obama-15% McCain
This is the third black-majority district in the state as well as Obama’s best district, picking up black areas in between Prince George’s County and Baltimore. While Democratic Rep. Donna Edwards might choose to run here rather than face Steny Hoyer in a primary, it would likely be an open seat won by a black Democrat.
So it is definitely possible to make three black-majority districts in Maryland. However, would this plan necessarily result in three black representatives being elected? Districts 7 and 8 would easily elect black congressmen, although Steny Hoyer might continue to win in the 5th district despite its new black-majority due to significant establishment support. The three black-majority districts are not an obstacle to toppling Roscoe Bartlett, although they must sacrifice either John Sarbanes or Dutch Ruppersberger. The change after redistricting would be minimal, going from a 7D-1R (Kratovil wins in 2010) or 6D-2R (Kratovil loses in 2010) split to a probable 7D-1R split (assuming Kratovil wins the 1st district seat). Despite the lack of a change in partisan balance under this map, Democrats would probably want to avoid forcing Hoyer into a tough primary and losing Sarbanes or Ruppersberger, so this is one state where three black-majority districts would be a bad thing for Democrats.
Thanks for reading and please leave your comments and feedback!


