Louisiana with 2 “VRA” districts?

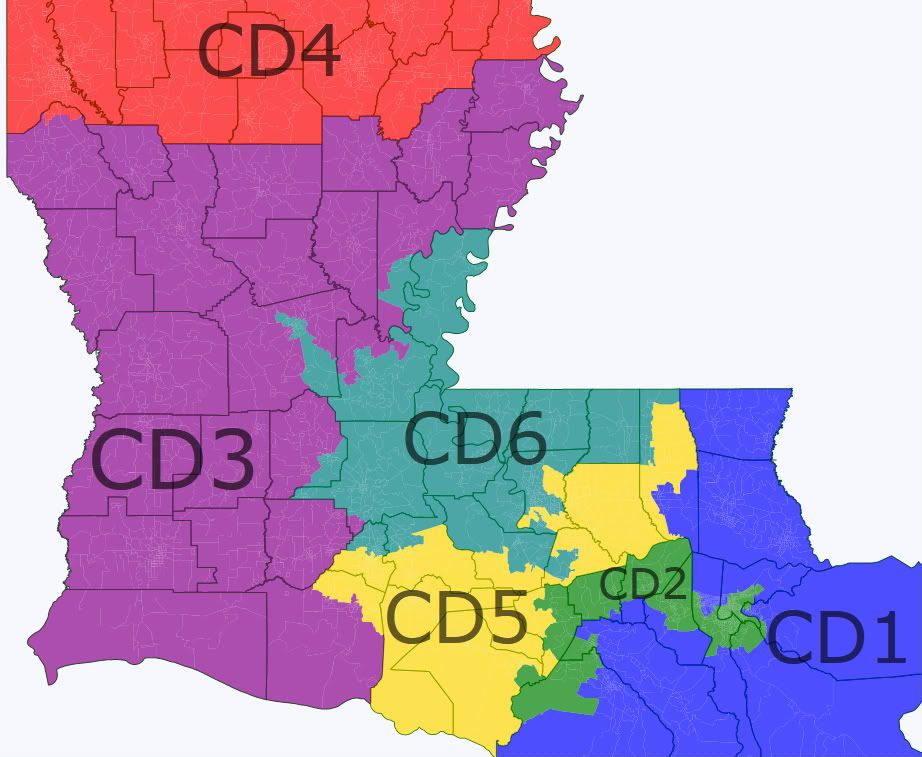
A few days ago in the discussion of the proposed Louisiana map someone drew a map with two majority-black districts but nothing else filled in. I drew this map to see (a) if I could get the New Orleans district to be more compact and (b) what the other districts would look like. As it turns out, the answer to (a) is yes, but it’s plurality black as opposed to majority black, and the answer to (b) is ugly.

Here’s the map.

louisiana

In district descriptions, the percentages are for voting age population. w is non-Hispanic white, b is black, h is Hispanic, and a is Asian.

LA1 (blue): 77.6w-12.3b-6.0h-1.7a. Still mostly a suburban New Orleans seat, but it was forced to move into the Thibodaux-Houma area by the positions of the VRA districts. Safe R.

LA2 (green): 41.7w-46.5b-7.3h-3.0a. Because of the depopulation of New Orleans, this district has to extend west and then south to pick up some heavily black areas. Probably likely D to safe D, as it’s still 58% minority and its white population is probably relatively moderate compared to the rest of the state. While less compact than a typical district, it’s far more compact than either its current or proposed versions.

LA3 (purple): 74.0w-20.7b-2.4h-0.9a. Ugh. It’s geographically impossible for it to take all of Cajun country, so it has to extend much further north. It wasn’t possible for it to take everything along the west side of the state up to and including Shreveport so I had to take it practically to the northeast corner of the state to avoid splitting up the Shreveport area. The result is a sprawling, incoherent mess that takes up maybe 40% of the state’s land area. Safe R.

LA4 (red): 59.8w-35.6b-2.4h-1.0a. The one clean district, the I-20 district. Likely R.

LA5 (yellow): 79.6w-13.9b-3.5h-1.7a. This ugly district with nodes in Baton Rouge and Cajun country connected by a narrow strip was necessary because the two VRA districts pass so close to each other. Safe R.

LA6 (teal): 44.6w-50.2b-2.6h-1.3a. The Baton Rouge-based majority-black district is nice and compact, but it has some community-of-interest issues as it takes pieces of Lafayette, Ville Platte, and Alexandria in addition to part of the capital city. Probably close to safe D even though it’s likely only D+6 or so: it looks like it would be easy for a Republican to get to 40% but nearly impossible to get over the hump. Compare it to Sanford Bishop’s current district, which is probably about as polarized as this LA6 would be but has black-white percentages that are basically the reverse of what this district has. It’s D+1.

I’m pretty sure that a court would accept this proposed LA6 if the state submitted it, as courts have accepted some really ugly and incoherent districts.  But here’s the question: would a court compel a state to draw something like the proposed LA6–which looks ok but slices and dices some widely separated cities–if the state isn’t inclined to draw it in the first place? Perhaps someone with a better understanding of the VRA can weigh in on this. Thoughts?

By what margin will Bob Shamansky win?

View Results

Loading ... Loading ...

Florida with cold turkey districts

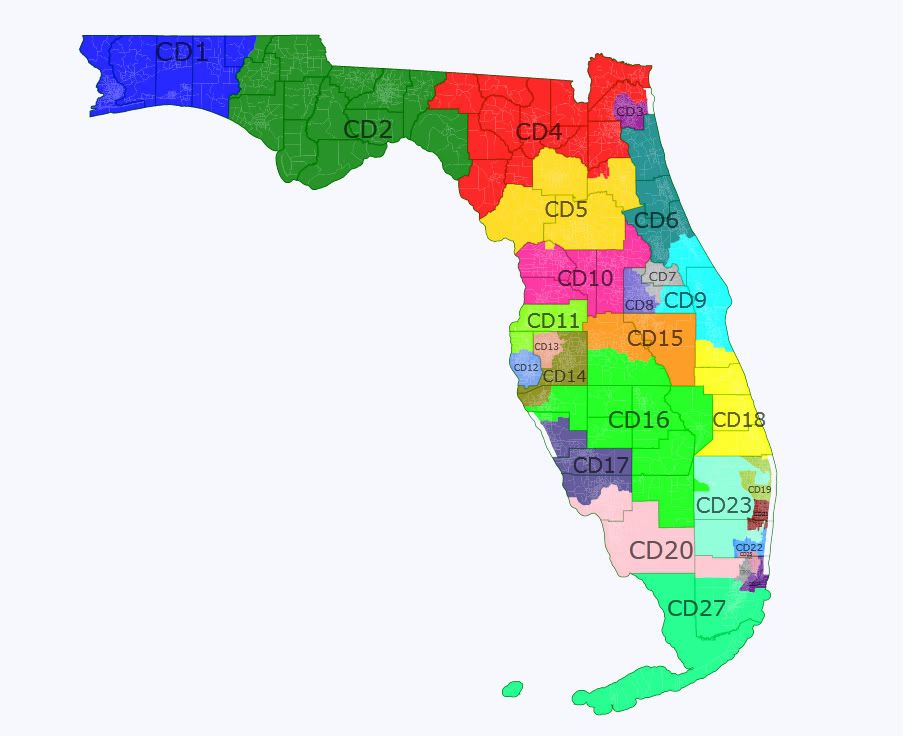
This is an attempt to draw new Florida districts based on the initiative they just passed prohibiting gerrymandering. There are three majority-Hispanic, one majority-black, and one plurality-black district all in the state’s south end, but beyond that the lines are just geography. I tried to keep counties and metropolitan areas together, and to a lesser extent cities. This map is what I think a neutral Iowa-type commission might come up with, but in practice I think the new map is likely to end up more like Michigan in that the districts will be fairly clean but more subtly drawn to favor Republicans.  

Anyway, for the districts w = Anglo, b = black, h = Hispanic, a = Asian. O = Obama, M = McCain. Numbers are voting age pop.

State map:

florida

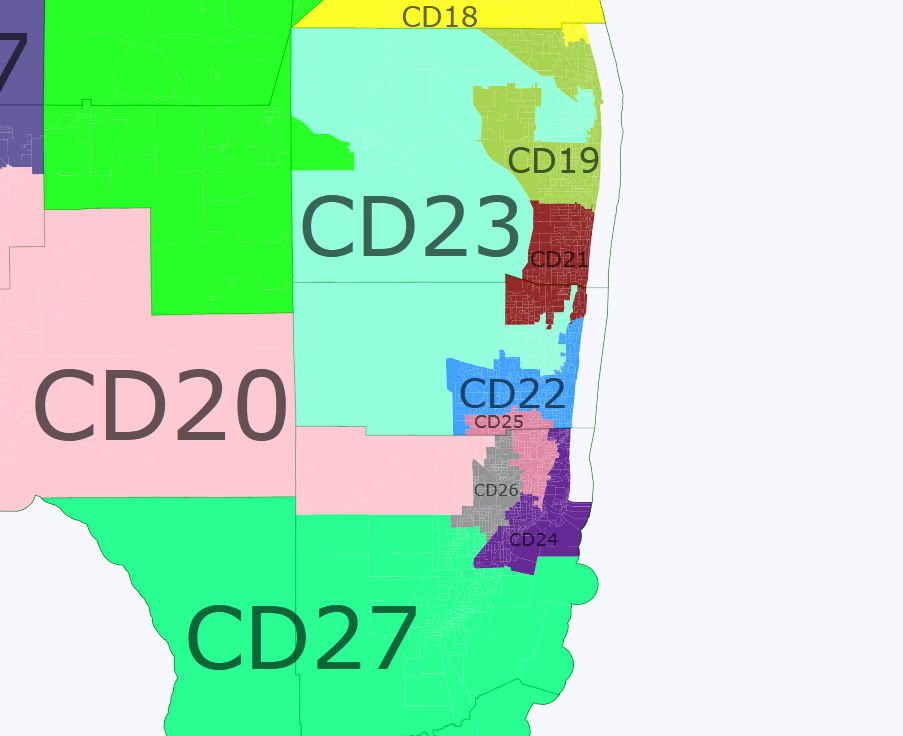
Miami closeup:

miami

FL1 (blue): 77.5w-12.5b-4.6h-2.7a. Deep red. Jeff Miller (current FL1) lives here.

FL2 (green): 68.6w-23.0b-4.8h-2.8a. Should still be likely R. Steve Southerland (current FL2) lives here.

FL3 (purple): 59.2w-27.6b-7.0h-4.2a. This is nothing like the current FL3, which is plurality-black but not remotely compact. This proposed FL3 is about 1 point more black than Duval county as a whole, which is about R+4. This new version is maybe R+2 or R+3 (lean R). Corrine Brown (current FL3) probably lives here but would be too liberal to win this version.

FL4 (red): 75.9w-14.9b-5.4h-2.1a. Also deep red, not too far off the current FL4. Ander Crenshaw (current FL4) probably doesn’t live here but could run here.

FL5 (yellow): 73.8w-13.4b-8.5h-2.8a. This would be a competitive district as it includes the college town of Gainesville. It’s basically Levy (M12-O7), Alachua (O73-M47), Marion (M90-O71), and Putnam (M19-O13). Collectively that’s roughly M168-O164 or about R+4. Cliff Stearns (current FL6) lives here but could potentially lose this to a blue dog.

FL6 (teal): 79.3w-8.9b-8.7h-1.8a. Has St Johns (M69-O36), Flagler (O25-M24), and most of Volusia (O127-M113). Resembles the current FL7 whose rep John Mica does not live here. Probably likely R.

FL7 (gray): 65.2w-8.5b-20.9h-3.7a. Orlando area district with Seminole (M105-O99) and generally whiter parts of Orange (O272-M186). Lean R? Mica and Dan Webster (current FL8) both live here, and Sandy Adams (current FL24) probably does too.

FL8 (blue-gray): 43.7w-25.0b-23.3h-5.4a. Western Orange. The whole county is D+6 and this end has more minorities so it’s probably likely D to safe D. Even Alan Grayson could hold this.

FL9 (toothpaste blue): 77.1w-7.5b-10.7h-3.0a. Southern Volusia, eastern Orange, and most of Brevard (M157-O127). Should be lean R to likely R. Adams could probably run here as it overlaps with most of her current district. Bill Posey (current FL15) also lives here.

FL10 (pink): 83.4w-6.2b-7.8h-1.3a. Four very red counties containing much of the current FL5. There isn’t going to be any free for all here, because Richard Nugent has a stranglehold on this district. Safe R.

FL11 (pea soup green): 84.9w-3.3b-8.5h-2.1a. Pasco (M110-O102) and north Pinellas (O244-M207). Lean R?  Gus Bilirakis (current FL9) lives here.

FL12 (light blue): 77.6w-10.6b-7.1h-3.1a. South Pinellas, mostly St Pete. Lean D? The county is D+0 to D+1 and this is probably the more liberal end of it. I think Bill Young (current FL10) lives here.

FL13 (pink-gray): 52.3w-16.8b-25.4h-3.6a. Mostly Tampa, lots of overlap with current deep-blue FL11 whose rep Kathy Castor probably lives here. Lean D to Likely D?

FL14 (olive): 67.3w-10.7b-17.8h-2.7a. East Pinellas, north Manatee. No incumbent. Lean R to likely R?

FL15 (orange): 59.1w-12.0b-25.3h-2.0a. Maybe 2/3 of Polk (M129-O114) and Osceola (O59-M39). Toss up? Dennis Ross (current FL12) lives here.

FL16 (garden hose green): 72.5w-8.2b-16.6h-1.5a. This spacious hinterland district had to take a chunk of the coast because there weren’t quite enough people in the interior counties. No incumbent. McCain won all of these counties. Likely R to safe R.

FL17 (indigo): 85.1w-3.7b-8.9h-1.2a. Most of Sarasota, Charlotte, north Lee. Likely R? Connie Mack (current FL14) appears to live just outside.

FL18 (yellow): 74.8w-10.8b-11.7h-1.4a. South Brevard, Indian River (M40-O30), St Lucie (O67-M52), Martin (M44-O33), a little bit of northeast Palm Beach. Lean R to likely R? I think Tom Rooney (current FL16) lives in the little bit.

FL19 (money green): 64.1w-11.2b-20.9h-2.4a. Mostly the less-black parts of north Palm Beach, and  takes a contorted shape in order to make FL23 plurality-black. Probably lean D to likely D. The whole county is D+8, although the bluest parts are in FL23. Apparently no incumbent. Lois Frankel, who plans to run against West, probably lives here.

FL20 (pale pink): 70.5w-6.6b-20.7h-1.3a. Collier, much of Lee, a bit of Miami-Dade. Safe R. Mack lives here.

FL21 (red-brown): 72.2w-9.7b-13.6h-2.8a. South Palm Beach, north Broward. Ted Deutch (current FL19) lives here. Likely D to safe D?

FL22 (sky blue): 58.8w-9.1b-27.2h-3.2a. Much of southern and eastern Broward, which is D+14 overall. Probably safe D. Debbie Wasserman Schultz (current FL20) lives here, and probably Allen West (current FL22) also does. That would be entertaining, although it wouldn’t be close.

FL23 (light blue-green): 32.0w-46.0b-17.6h-2.3a. This plurality-black district would probably produce a black rep so I would guess it would be VRA compliant. It looks compact, but it’s really a big cluster in the middle of Palm Beach, another big cluster in the middle of Broward, and the smaller Pahokee and Belle Glade areas on lake Okeechobee connected together by lots and lots of empty space. No incumbent either, unless West lives here. Safe D.

FL24 (purple): 28.8w-4.9b-63.6h-1.8a. After you carve out a majority-black district, what’s left of Dade will necessarily be majority-Hispanic. This overlaps with much of Ileana Ros-Lehtinen’s current FL18. Lean R?

FL25 (raw hamburger): 12.1w-52.6b-31.0h-2.4a. You can carve out a nice majority-black district that looks sort of like a mini-Florida from interior north Dade and the south end of Broward. Frederica Wilson (current FL17) and Alcee Hastings (current FL23) both live here. Safe D.

FL26 (gray): 6.1w-2.1b-90.6h-1.0a. Ninety percent! Seems to overlap with much of Mario Diaz-Balart’s current FL21. Lean R?

FL27 (sea foam green): 22.7w-11.1b-63.1h-1.9a. This overlaps with much of David Rivera’s current FL25 which is R+5, but loses a piece of Collier county that is 9% black and 43% Hispanic (the rest of the county is just 3% black and 11% Hispanic) so it probably isn’t anywhere near the county’s overall PVI of R+15. Probably still lean R to likely R if its new areas in Dade county aren’t much different from its old ones.

If my estimates of these districts are correct, this map is 18-8-1 considering only the partisan lean of the districts, but about half of the “red” districts would be competitive whereas the only really competitive “blue” district is probably FL12 in St. Pete. In practice I think this map would be in the range of 17R-10D to 15R-12D in most years. The current map has just 5 districts with a PVI of +4 or less one way or the other. I think this map would have considerably more, which should make for the more competitive elections the voters said they wanted this past November.

Thoughts? I don’t know this state well at all and would appreciate any pointers about these proposed districts.  

By what margin will Bob Shamansky win?

View Results

Loading ... Loading ...

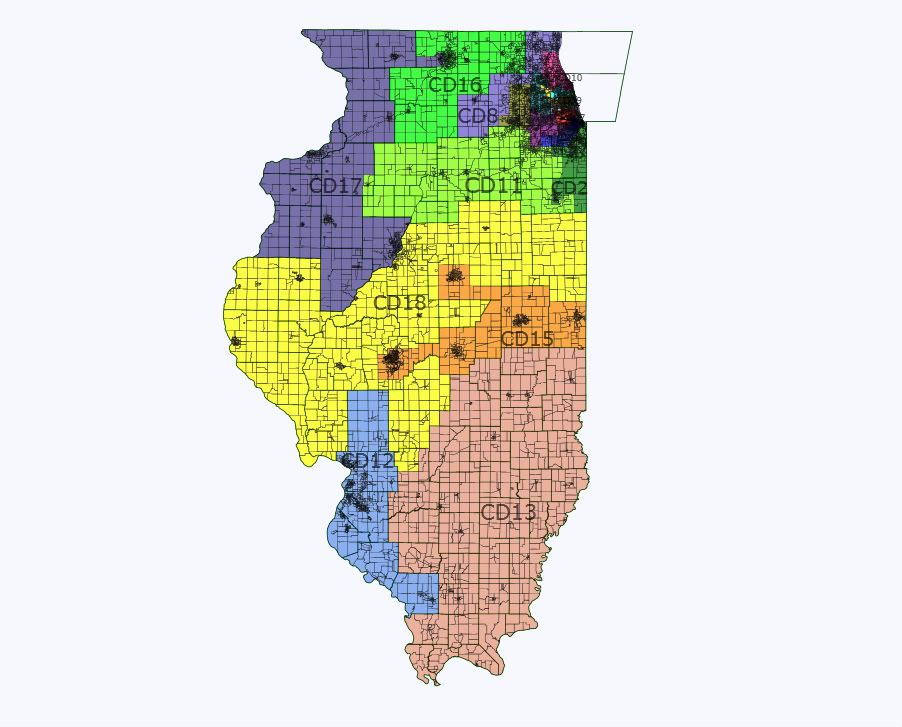
Illinois with 2 Hispanic* districts

This map is intended to favor Dems as they control both houses and the governor’s office. I tried to avoid any egregious gerrymanders, and I suspect that some of the suburban Chicago districts could be made more favorable. The only really ugly districts are IL5 (Quigley) and IL9 (Schakowsky). IL5 had to take a pretty strained shape to get a voting-age Hispanic plurality, although it still isn’t nearly as bad as the current Hispanic-majority IL4 (Gutierrez). IL9 had to pick up the vacated IL5 precincts that didn’t have enough Hispanics, as IL7 (Davis) has just a 50.1% voting-age black majority and could not pick anything up.  

State map:

Photobucket

Chicago area map:

Photobucket

Notes on districts, with voting-age populations. w = Anglo, b = black, h = Hispanic, a = Asian.

IL1 (blue, Rush): 38.2w-52.1b-7.4h-1.2a. Underpopulated and has to expand to the west. Safe D.

IL2 (green, Jackson): 36.0w-50.8b-11.2h-0.9a. Underpopulated and has to expand to the south to pick up most of Kankakee. The southernmost area is Pembroke, an 85% black semi-rural area which is unusual outside the south. Safe D.

IL3 (purple, Lipinski?): 77.2w-6.1b-8.9h-6.6a. This district has more of the current IL13 (Biggert) than the current IL3, as it really had nowhere else to go. It’s probably competitive. Tossup?

IL4 (red, Gutierrez): 31.3w-6.1b-58.3h-3.6a. One of the ugliest districts in the nation is now one of the cleanest. Safe D.

IL5 (yellow, Quigley): 43.2w-4.8b-44.4h-6.1a. I don’t think it’s possible to draw a second Hispanic-majority district without using really tortured lines. As is I think this proposed district as pushing it as far as “compact” goes, although obviously it isn’t nearly as screwy as the current IL4. Safe D

IL6 (teal, Roskam): 73.3w-3.1b-11.4h-11.1a. It picks up the Palatine and Schaumburg areas, and loses its heavily Hispanic area in the east and some of its western end. It may be slightly more red now, but I know very little about the political leanings of Chicago suburbs. Tilt R?

IL7 (gray, Davis): 31.0w-50.1b-9.8h-7.5a. There probably will not be 3 black-majority districts after 2020. Black plurality, maybe. Safe D.

IL8 (blue-gray, Walsh): 69.2w-6.4b-18.1h-5.1a. Dumps its piece of reddish McHenry county and some Cook suburbs, and picks up Waukegan, much of swingy Kane county, and bluish DeKalb county. This is intended for Melissa Bean to return to DC. Walsh doesn’t live here. Tilt D?

IL9 (toothpaste blue, Schakowsky): 73.1w-6.4b-10.0h-8.7a. Moves south and much more into Chicago proper. Safe D.

IL10 (pink, Dold!): 72.6w-4.1b-8.9h-12.9a. Moves south into IL9’s vacated areas, taking most of the college town of Evanston along with neighboring suburbs that are heavily Asian. This would probably be one of the most Asian districts outside California or Hawaii. The intent is to ensure that Dold! serves one term! Likely D?

IL11 (pea soup green, Kinzinger): 80.1w-5.8b-11.3h-2.0a. Loses some of its eastern end including Kinzinger’s house, picks up northwest Kendall county and some western rural areas. Lean R?

IL12 (light blue, Costello): 80.5w-14.7b-2.4h-1.2a. The St. Louis area district sheds most of its southern end but keeps the college town of Carbondale, and adds Macoupin county and the rest of Madison county. Obama got 57.3% of the two-party vote here. Lean D.

IL13 (pink-gray, Shimkus): 93.5w-3.6b-1.6h-0.5a. Renumbered from IL19. Downstate Republican sink. Safe R.

IL14 (brown-green, Hultgren): 61.4w-5.5b-24.1h-7.9a. Loses most of its western rural areas (which are actually swingy for the most part) and exurbs and picks up the Naperville and Hanover areas. Tossup?

IL15 (orange, Johnson):  80.5w-10.6b-3.0h-4.4a. This is my concept of the “midstate cities swing district” that jsramek mentioned on an earlier Illinois thread. It has Springfield, Decatur, Bloomington-Normal, Champaign, and Danville. Obama got 52.8% of the two-party vote in the 6 counties within the district, although it’s missing some (probably red) rural and exurban areas within these counties. Toss up, but it would likely take a very strong candidate to beat Johnson.

IL16 (garden hose green, Manzullo): 85.9w-2.7b-8.4h-2.0a. The north state Republican “sink”. It picks up the rest of McHenry and loses its western end and the bluest parts of Rockford. Walsh also lives here. Likely R?

IL17 (indigo, Schilling): 82.0w-9.6b-5.7h-1.5a. Moves north from its current fugly-mess configuration to take in purple or blue areas of the state’s northwest, including Peoria and the bluest parts of Rockford. Obama got 58.2% of the two-party vote here without any of Rockford, so his overall share here was probably closer to 60%. Lean D/likely D.

IL18 (yellow, Schock): 94.1w-2.6b-1.9h-0.5a. Mid-state Republican sink. Schock actually lives in IL17 but would probably run here. Likely R/safe R.

Under this map, the Dems would easily hold districts 1, 2, 4, 5, 7, and 9. They should (finally) take 10 and retake 8 and 17, and Costello shouldn’t have too much trouble in 12. Reeps will hold 13, 16, and 18. Then you have 3, 6, 11, 14, and 15 which appear to all be competitive and all of which could conceivably be held by Republicans. Given that 3, 6, 11, and 14 occupy a contiguous block of western and southwestern suburbs, I suspect it would be possible to draw them such that one of them is lean-R or even likely-R and the other 3 are tossup or tilt-D. (I would leave this for someone who knows more about Chicago-area politics.) As is, I would say this is a 10-3-5 map but probably 11-7 or 12-6.

Thoughts? In particular, thoughts about how the Dems might draw the lines in the western and southwestern Chicago suburbs?

By what margin will Bob Shamansky win?

View Results

Loading ... Loading ...

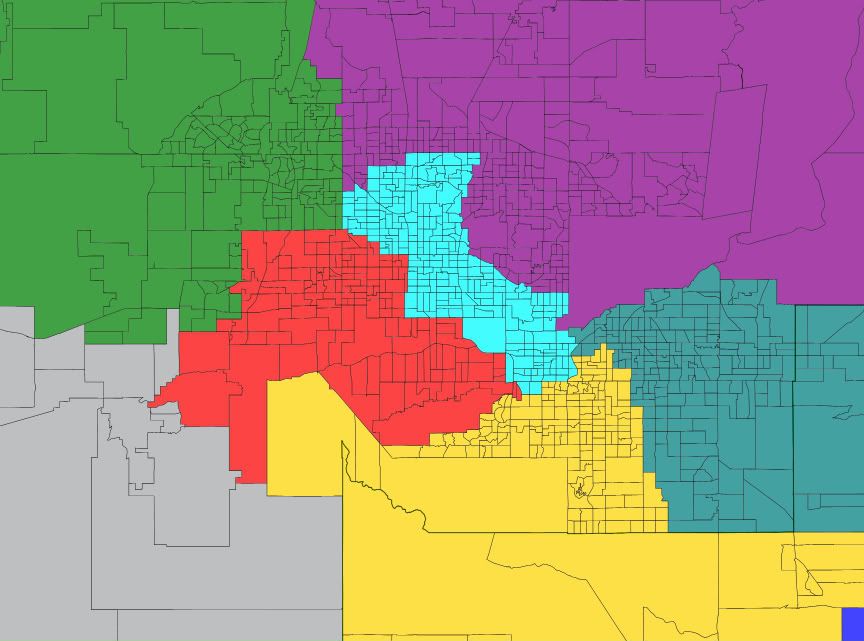
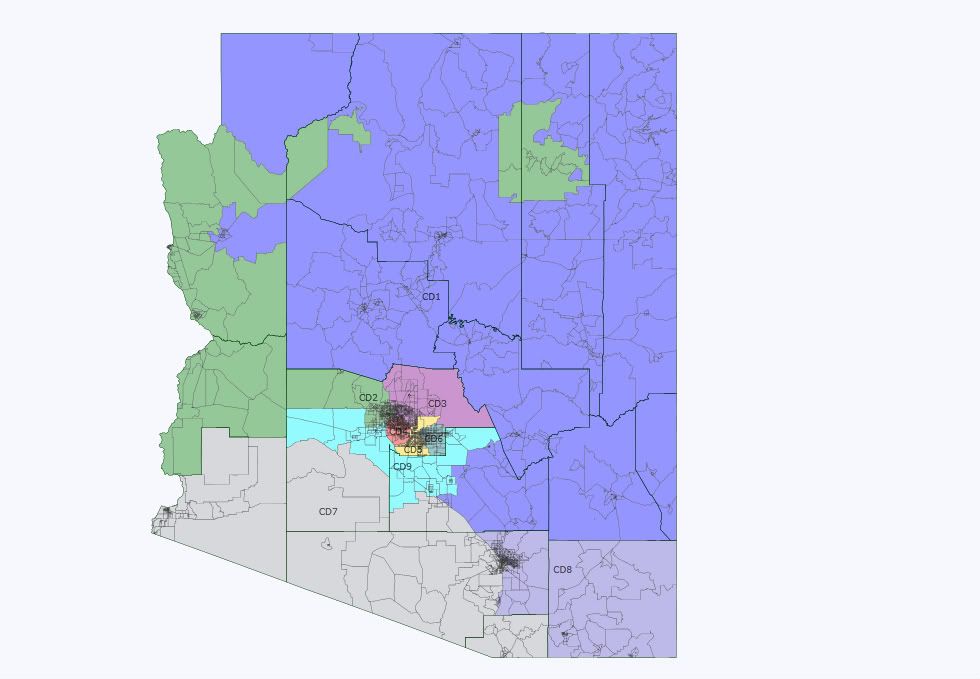
Arizona 4 different ways!

Despite the colossal housing bust, Arizona ended the decade with a lot more people than it started with and thus earned a 9th congressional district. Here are the stats for the 8 current congressional districts. For the ethnic shares, W is Anglo, B is black, H is Hispanic, A is Asian, and N is Native American.

AZ1 (Gosar, R): 774.3k, 57.1W–1.5B–19.5H–0.9A–19.1N

AZ2 (Franks, R): 972.8k, 69.3W–3.5B–20.8H–2.5A–1.7N

AZ3 (Quayle, R): 707.9k, 70.7W–3.1B–19.3H–3.4A–1.3N

AZ4 (Pastor, D): 698.3k, 21.5W–8.6B–63.9H–2.2A–2.1N

AZ5 (Schweikert, R): 656.8k, 70.3W–3.8B–16.5H–4.4A–2.5N

AZ6 (Flake, R): 971.7k, 69.3W–3.1B–20.7H–3.6A–1.0N

AZ7 (Grijalva, D): 855.8k, 32.6W–3.7B–56.0H–1.8A–4.3N

AZ8 (Giffords, D): 754.3k, 68.2W–3.3B–22.7H–2.7A–0.8N  

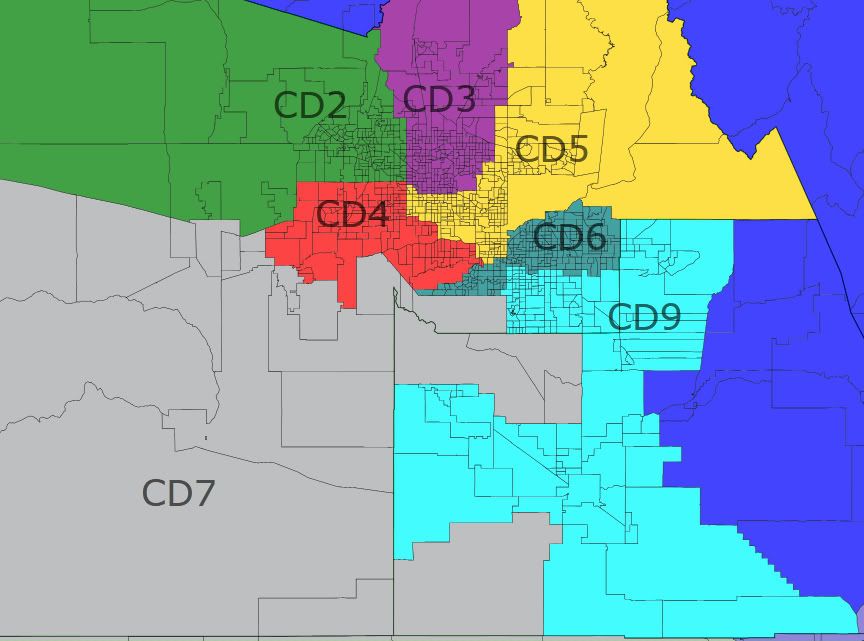
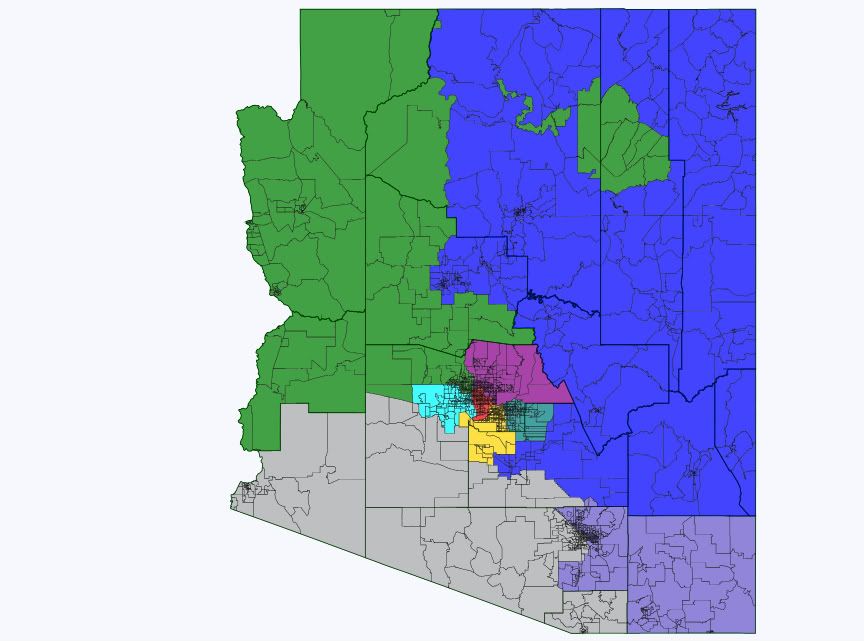
The target population is about 710k, so AZ2 and AZ6 will have to lose more than 25% of their people. AZ7 will also have to shed a lot, and the AZ1 and AZ8 will have to shed a little. AZ5 needs to add people. The big question: where does the new 9th go? Most of the growth was on the edges of the Phoenix area so it seems natural to put the new district somewhere on the fringe, but it isn’t immediately obvious where it should go. The southeast valley and the southwest valley both saw explosive growth, but these two areas are separated by a lot of still-empty desert. Here I show four different possibilities, but these are just four among many. M Riles just drew a plausible map that looks very different from any of these. Anyway…

Map 1: AZ9 takes new exurbs on east and west sides

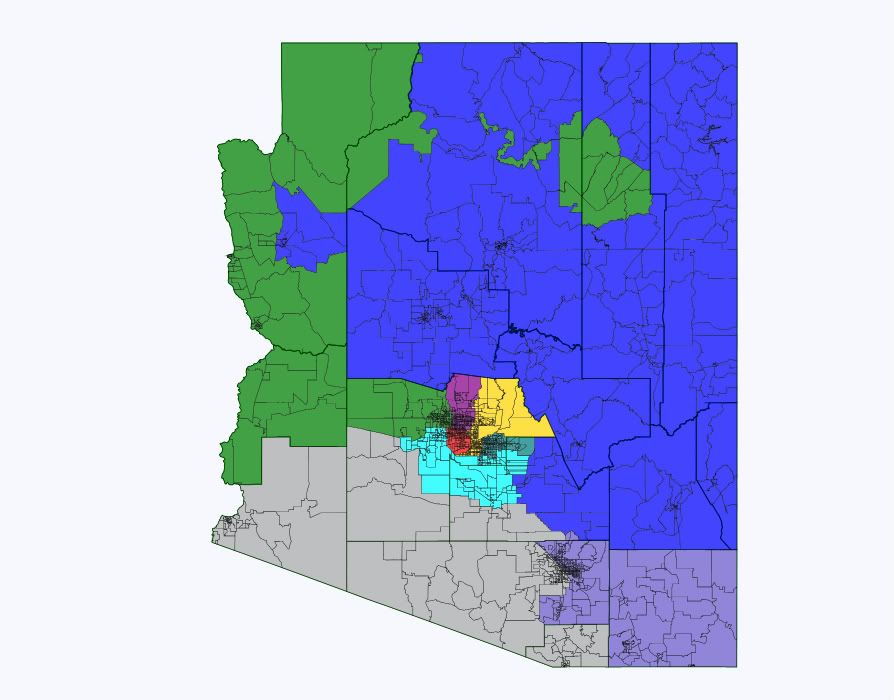
State map:

az9 east-west

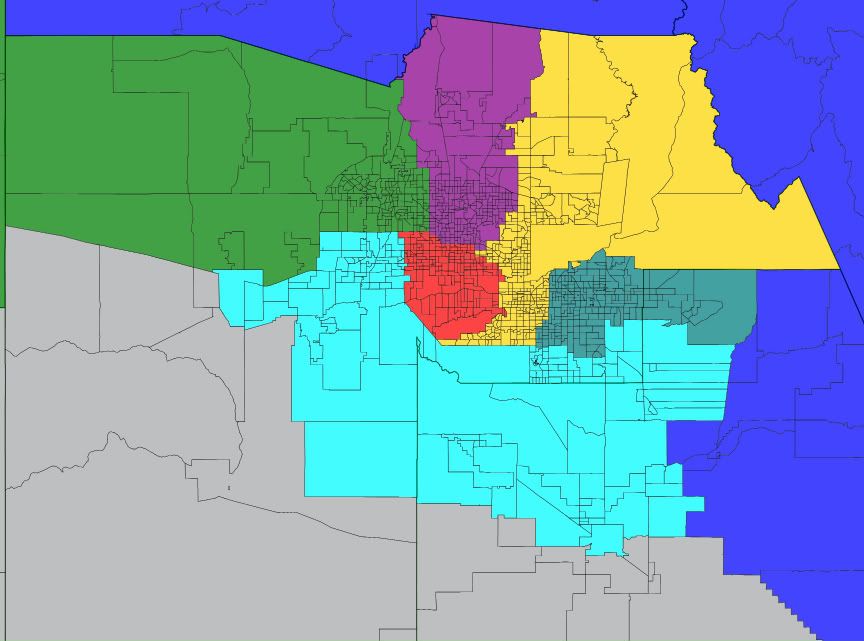
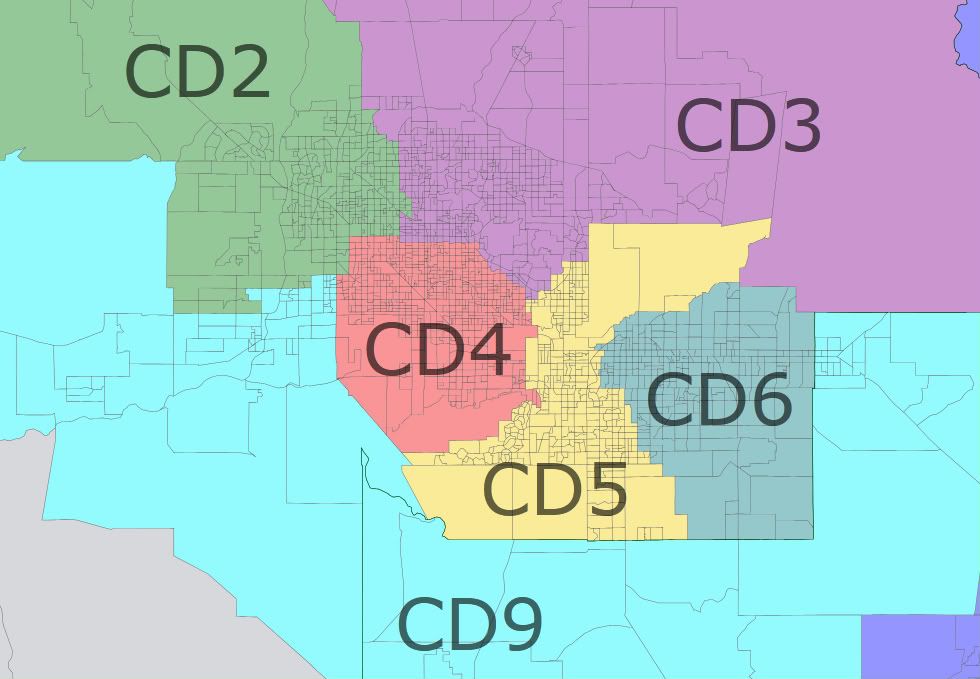
Phoenix closeup:

az9 west-east

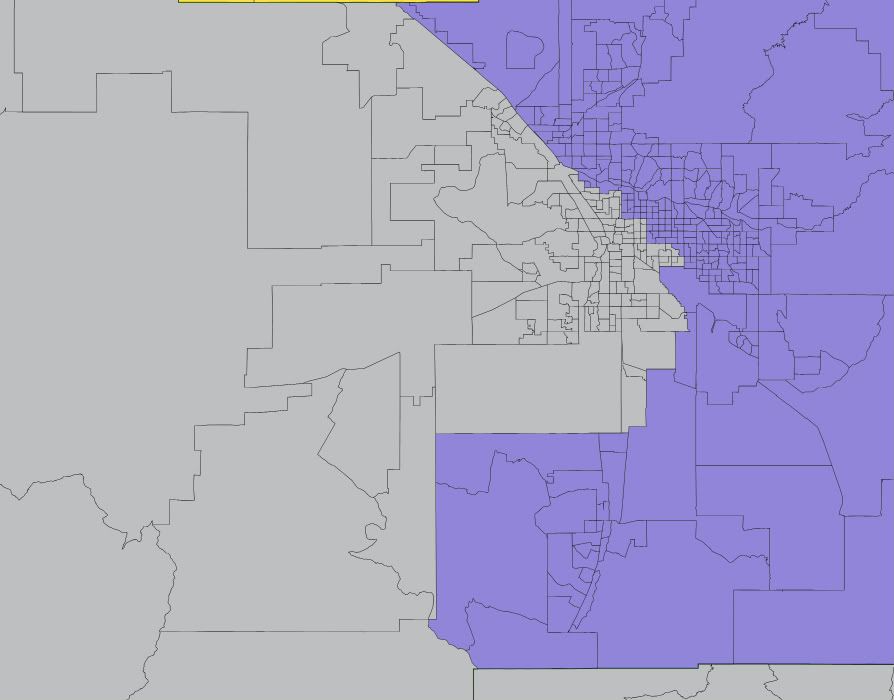
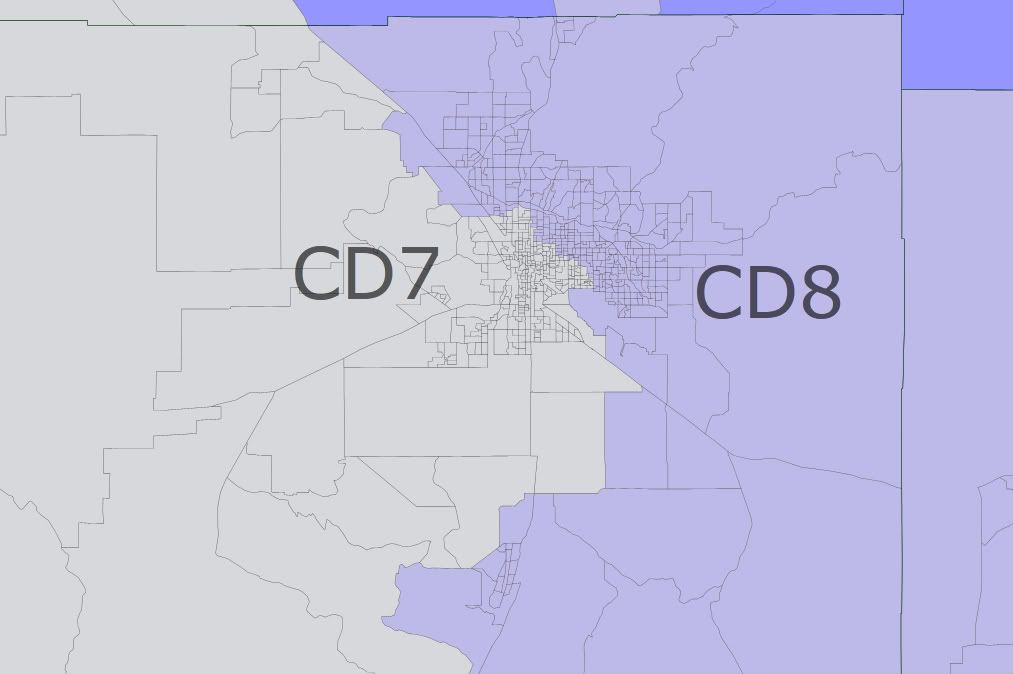
Tucson closeup (same in all 4 maps):

tucson

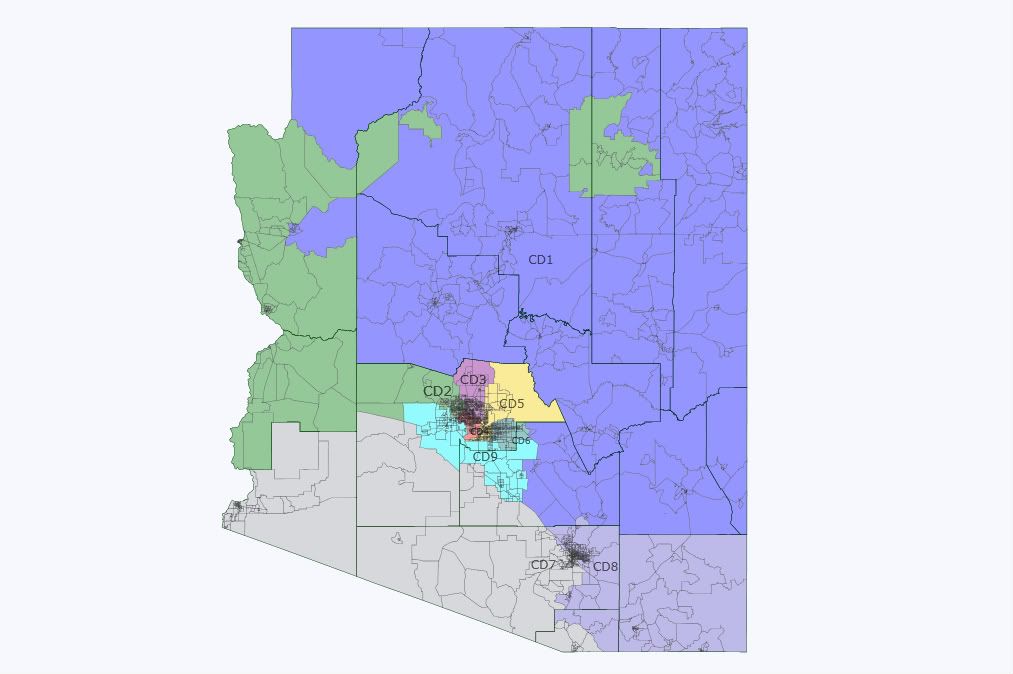
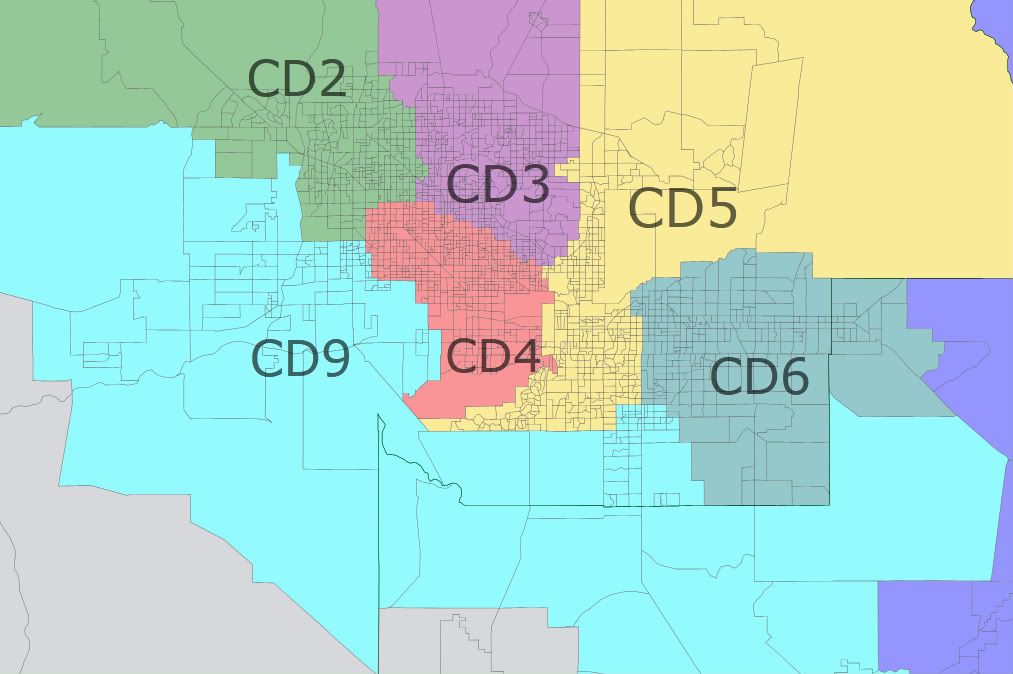
Here the new district is formed almost entirely from the areas of AZ2, AZ6, and AZ7 that were mostly empty 10 years ago and as such, almost every building in the state that stood 10 years ago will remain in its old district. This helps continuity, as the current reps will not have to get accustomed to new areas. A drawback: AZ9 is nice and compact but as mentioned above it has two densely populated areas separated by a lot of empty space. New ethnic numbers and notes for the districts:

AZ1 (blue): 61.0W–1.0B–15.6H–0.9A–19.9N Drops much of Pinal but retains the mining-dominated eastern parts. Picks up Kingman in Mohave county. Probably a bit more red now but still competitive.

AZ2 (green): 72.4W–2.8B–17.7H–2.4A–2.8N Picks up La Paz in all 4 maps. It’s dominated by retirees, ultra-red, and really doesn’t fit in AZ7. AZ2 is still deep red.

AZ3 (purple): 70.1W–3.2B–19.8H–3.6A–1.3N Loses part of east Phoenix to AZ5, picks up part of east Glendale from AZ2. Probably little impact.  

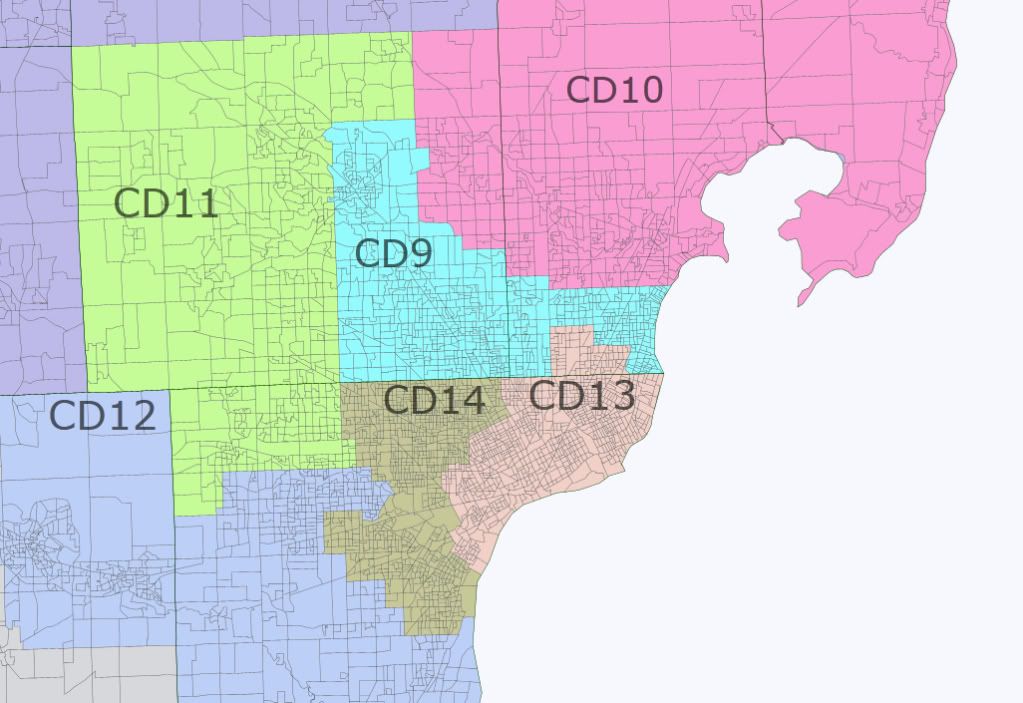
AZ4 (red): 21.7W–8.6B–63.7H–2.4A–2.1N Negligible changes. Safe D.

AZ5 (yellow): 70.6W–3.7B–16.5H–4.5A–2.4N Probably still lean R.

AZ6 (teal): 68.8W–2.8B–22.0H–3.2A–1.1N Loses Queen Creek and south end of Gilbert and Chandler to AZ9 but retains Apache Junction which is really an extension of east Mesa. Still safe R.

AZ7 (gray): 34.0W–2.6B–56.9H–1.8A–3.3N Losing both La Paz and most of its Maricopa piece is about a wash. Drops much of Pinal where Grijalva did poorly in 2010, but picks up some reddish parts of the northwest Tucson area. That may also be about a wash overall. Slightly more Hispanic now, but also slightly more white. Still likely D.  

AZ8 (blue-gray): 68.3W–3.4B–22.5H–2.8A–0.8N This district is the same in all 4 maps. I don’t expect Cochise to be broken up or thrown into AZ1 when it has historically been much more tied to Tucson. It loses its Santa Cruz piece and Pima sections west of I-10 and north of AZ-86 to AZ7. Its ethnic mix doesn’t change. Of the 15 lost Pima precincts it appears that Giffords won 4 and lost 11, so it may be slightly more blue now. Still tilt R overall.

AZ9 (toothpaste blue): 53.3W–5.6B–32.4H–3.9A–2.6N Its west valley section mostly went for Grijalva and should lean D, but its east valley piece should lean R. Overall it should be competitive, maybe tilt R. On the one hand it’s much less white than the swingy AZ1, AZ5, and AZ8, but on the other it doesn’t have a large public university like they do.  

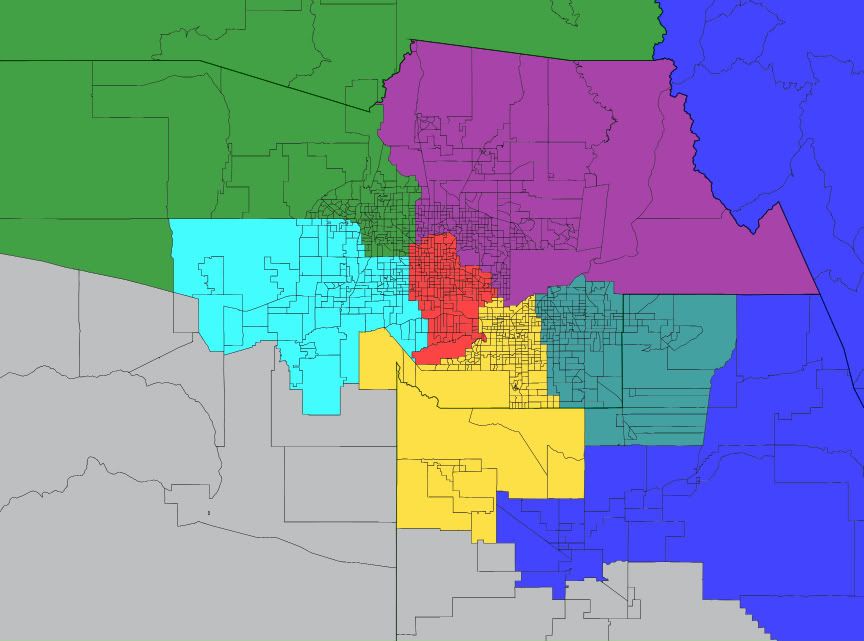
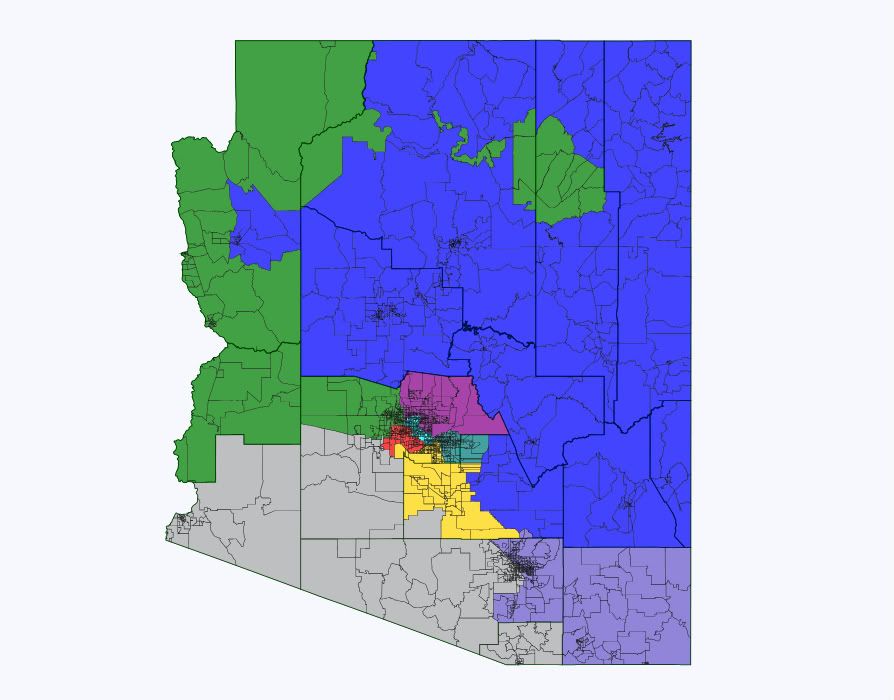
Map 2: AZ9 in the east valley

Here the new district takes most of Pinal, all of Chandler, most of Gilbert, and Queen Creek. As a result AZ6 is forced to take Ahwatukee and west Mesa from AZ5, forcing AZ5 deep into Phoenix and AZ4 out into the west valley boom areas. Unlike map 1, I think this map creates 3 clearly blue districts so it might be less likely to be adopted. It’s hard to put AZ9 entirely in the east valley without endangering AZ5 and/or AZ3.

State map not shown, as everything outside Maricopa and Pinal is the same as in map 1.

Phoenix closeup:

Photobucket

AZ1: 61.0W–1.0B–15.6H–0.9A–19.9N No change from map 1.

AZ2: 72.4W–2.8B–17.7H–2.4A–2.8N No change from map 1.

AZ3: 70.3W–3.2B–19.6H–3.5A–1.3N Negligible change from map 1.

AZ4: 26.7W–8.9B–58.5H–2.7A–2.4N Not quite as Hispanic now but still very blue.

AZ5: 56.0W–4.4B–31.9H–3.3A–2.5N The white population here is fairly liberal with north Tempe and the older parts of Phoenix. The district is basically Scottsdale and a bunch of blue areas, and Schweikert would probably lose to Kyrsten Sinema in 2012.

AZ6: 67.5W–3.4B–21.8H–3.6A–1.6N Still safe R.

AZ7: 33.7W–2.5B–56.4H–1.6A–4.4N Keeps the Gila River rez in this version.

AZ8: 68.3W–3.4B–22.5H–2.8A–0.8N No change from map 1.

AZ9: 64.4W–4.2B–23.1H–4.6A–1.5N Probably at least likely R, but look what happened to AZ5.

Not shown here, but it would be possible to keep both AZ5 and AZ3 red by having AZ5 take the eastern part of AZ3, which would then take the eastern part of AZ2 (and probably Trent Franks’ house). In this case the chain reaction would push AZ2 into Yavapai, forcing AZ1 to take Cochise by elimination and pushing AZ8 into the bluer parts of Pima. This would likely make AZ1 a bit more competitive, and AZ8 very unfavorable for Republicans. I don’t like this because I think Cochise and its military base belong with Tucson, not with Flagstaff. In practice this would give the Reeps the best chance at a 6-3 map, because the district that’s getting weakened the most (AZ8) is already held by an entrenched Dem.

Map 3: AZ9 in the west valley

The west valley boom areas by themselves are not nearly big enough to sustain a district, so the new AZ9 pushes into AZ2 and deep into AZ4. This in turn pushes AZ3 well to the east and AZ5 deep into Pinal county. AZ2 keeps Kingman and is pushed into Yavapai, and AZ1 retains much more of Pinal here. Under this map only AZ7 would be above 50% Hispanic voting age population, but AZ4 would be at 43.4% and AZ9 at 44.7%. I doubt the Dems would object to this map: they should be favored in AZ4, AZ7, and AZ9 and the swing districts AZ1, AZ5, and (to a much lesser extent) AZ8 are all more Dem-friendly than their current versions. I didn’t try to rig this map to favor Dems, but it almost has to work out that way when you plop the new district entirely in the west valley and try to keep clean lines with communities of interest.

State map:

az9 west

Phoenix closeup:

az9 west

AZ1: 57.3W–1.3B–18.5H–0.9A–20.2N Loses a good chunk of Yavapai which is the real red base in AZ1. Gosar would have trouble here.

AZ2: 76.5W–2.0B–14.5H–2.3A–2.9N R+16 now?

AZ3: 78.6W–2.1B–12.6H–3.5A–1.4N Schweikert would wax Quayle in the primary here, and hold this as long as he wants.

AZ4: 35.4W–7.4B–50.4H–2.5A–2.5N Not nearly as Hispanic now but nearly as blue, as it picks up a lot of white liberals.

AZ5: 59.7W–4.9B–24.0H–5.7A–3.2N Scottsdale’s gone, replaced with swingier parts of Chandler, west Mesa, and Pinal. You want this back, Harry?

AZ6: 73.3W–2.7B–18.0H–3.0A–0.9N This is one r-e-d district.

AZ7: 34.0W–2.6B–56.9H–1.8A–3.3N Very similar to map 1.

AZ8: 68.3W–3.4B–22.5H–2.8A–0.8N No change from map 1.

AZ9: 36.9W–7.2B–49.9H–3.0A–1.0N Probably lean D to likely D. Not sure who the new rep would be, as the Dem state legislators from this area appear to have districts more liberal than the new AZ9 as a whole.

Map 4: AZ9 in the middle

The commission might just do what they did last time, and counterintuitively put the new district in the middle instead of on the fringe. The new districts last time were effectively AZ4 and AZ5. Here AZ9 ends up looking an awful lot like AZ5 from map 2, but with parts of north Phoenix and Glendale instead of Scottsdale.

State map:

az9 center

Phoenix closeup:

az9 center

AZ1: 61.0W–1.0B–15.6H–0.9A–19.9N No change from map 1.

AZ2: 71.1W–3.1B–18.9H–2.3A–2.8N Ho hum.

AZ3: 80.7W–1.9B–10.5H–3.7A–1.3N Pushed into Scottsdale again for Schweikert.

AZ4: 20.9W–8.9B–64.5H–2.6A–1.5N Pushed west again.

AZ5: 59.6W–4.8B–24.7H–5.4A–3.1N The reddest (Scottsdale) and bluest (north Tempe) areas are both gone, and what’s left is Ahwatukee, Chandler, south Tempe, little bits of Mesa and Gilbert, and most of Pinal. Probably still lean R, but swingy. And once again, no incumbent.

AZ6: 71.3W–2.7B–20.1H–2.8A–1.1N Safe R again.

AZ7: 34.8W–2.6B–56.4H–1.7A–3.2N Keeps more of Maricopa and less of Pinal than the other maps, which suits Grijalva just fine.

AZ8: 68.3W–3.4B–22.5H–2.8A–0.8N Still no change from map 1.

AZ9: 52.8W–5.4B–33.7H–3.4A–2.5N Don’t let the numbers fool you, this thing is blue. The white population here is mostly moderate to liberal. I suspect Pastor would run in the new AZ4 even if he lives here, so Sinema would likely hold this without too much trouble.

If the commission had to pick from these four maps, I suspect they might pick the first with its somewhat disjointed 9th district because it does the least to upset the current balance. The other three were all at least marginally favorable to Dems. I think that making the new district anything but an east-west mix will lead to this if the commission lets the other districts sort out into their most “natural” configurations, but in practice they might find it politically easier to sacrifice compactness and communities of interest a bit in order to keep the current balance of power.

By what margin will Bob Shamansky win?

View Results

Loading ... Loading ...

Michigan redistricting: rolling the dice?

The Michigan Republicans are in the enviable position of controlling the governor’s office and both houses of the legislature, as they were back in 2001. The state has a fairly restrictive redistricting law that stresses respecting city and county boundaries and forbids really abusive gerrymanders, so the state’s districts will probably look more or less like they do on the current map, which is Republican-friendly but has nothing outrageous.

The state will lose one of its seats, and like most people I assume that they will throw Dem incumbents Gary Peters and Sander Levin into one district. Most of the population losses have been in the inner Detroit area, and they probably can’t mess with Hansen Clarke’s MI13 or John Conyers’ MI14  too much as it is easy to draw two compact majority-black districts for them. The Republicans must face a major decision: do they try to hold all 9 seats they currently have and risk losing a bunch of them in a blue wave year, or do they sacrifice one of them to shore up some of the others? They have one glaring problem: Ingham county. As in Ohio, the seat of state government and a huge public university create a big blue menace in the middle of a bunch of Republican-held districts. Obama won it by 50k votes, about 2-1. Michigan Reeps attached it to Republican areas further east in Mike Rogers’ MI8, thus creating two swing districts instead of one red one and one blue one. This worked out for them except in 2008 when Mark Schauer took MI7 south of Lansing from Tim Walberg. Maximizing the number of winnable districts worked well for the Reeps for most of the 00s, and for that reason I expect them to try it again. However, the state as a whole has been trending blue for some time and I think they would have an easier time holding the House if they try to push up their floor instead of their ceiling. So here are two scenarios: one in which they sacrifice a seat in the Lansing area and one in which they try to hold everything.

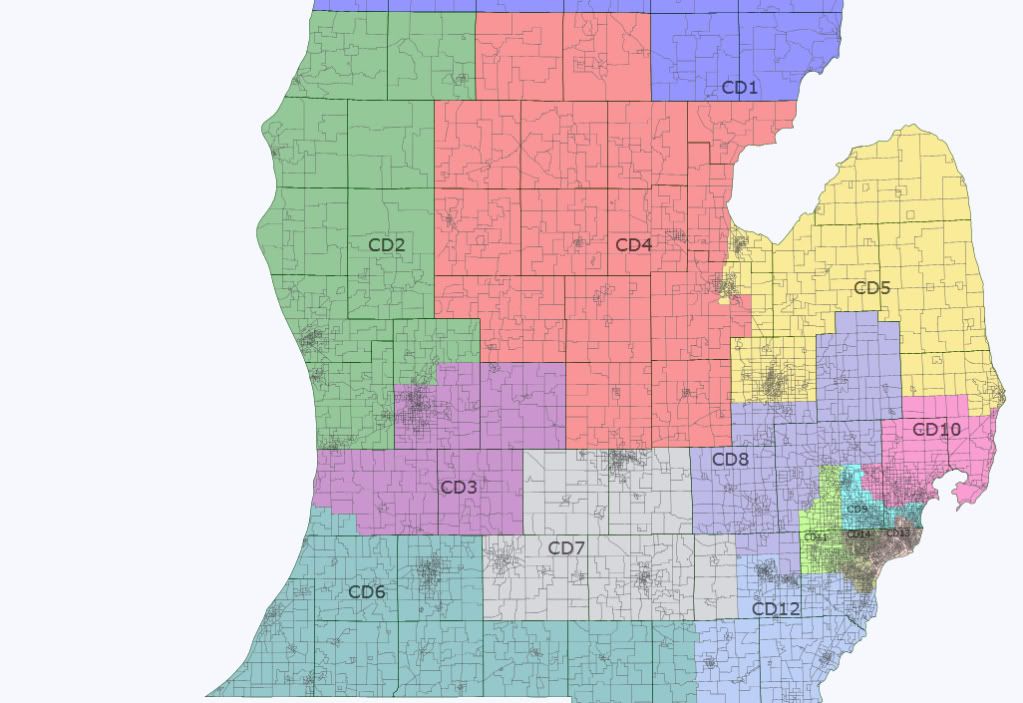
Scenario 1: Throw Walberg under the bus!

Here they create a Democratic sink in the Lansing area primarily from Walberg’s district to make things easier for Rogers and Justin Amash. The state map:

Michigan

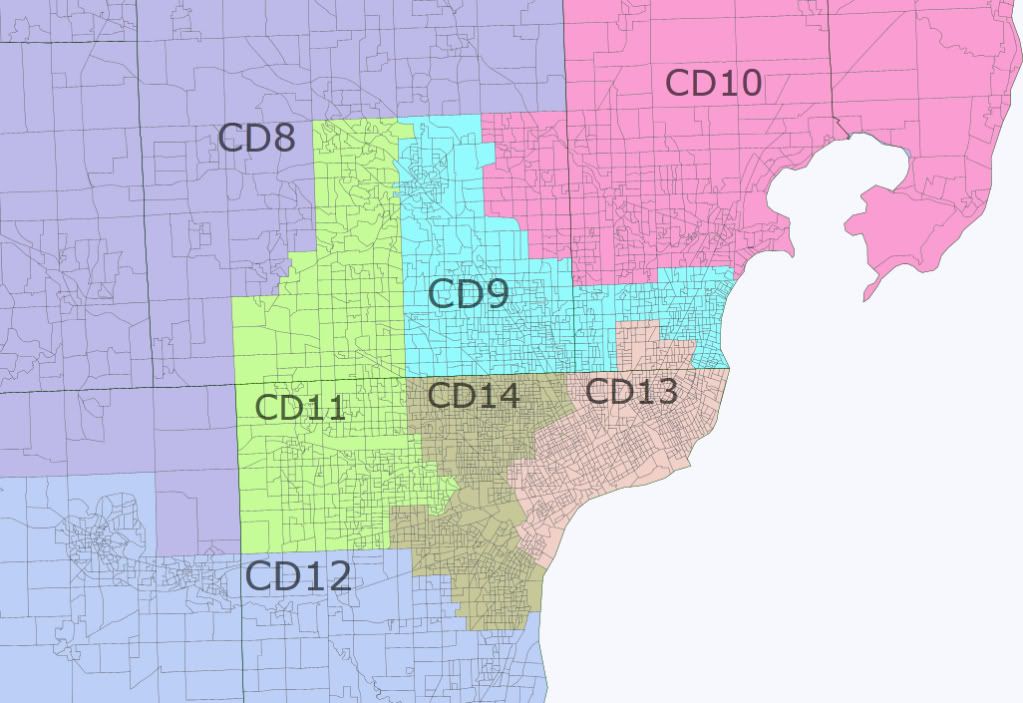
Everything north of the top edge is in Dan Benishek’s MI1. The Detroit-area closeup:

Detroit area

Notes on districts follow. In each case O or M followed by a number indicates Obama’s or McCains’s 2008 margin in thousands of votes.

MI1 (blue): Loses Arenac and Gladwin which combined are O1, and the northern part of Bay which is probably more like those two counties than the rest of Bay, which was O9 overall. Gains Kalkaska, Grand Traverse, Benzie, and Leelanau which collectively are M1. There isn’t much opportunity for mischief here since the district is shoved into the northern end of the state and the northern lower peninsula has very few counties where either candidate won by as much as 10%. It would still be R+3.

MI2 (green): Rookie Bill Huizenga’s district loses Benzie and northern Allegan and gains suburban and exurban precincts north of Grand Rapids. The current district is the reddest in the state at R+7 and this would not change much.

MI3 (purple): Amash’s district will probably be pushed south to some extent as MI1 needs to expand, which will likely push MI2 into MI3. Here the lost northern suburbs and exurbs are replaced with most of Allegan, which was M6 (roughly R+9). The current district is R+6 and the new one would likely be about the same.

MI4 (red): Dave Camp is the chair of the Ways and Means committee and I think the Reeps will ensure that his district, currently just R+3, is not weakened. Here it swaps out marginal areas near Traverse City with similar areas near Saginaw Bay (see MI1 above), loses a few (bluish?) precincts near Saginaw, and picks up O0 (that’s Obama by less than 500 votes, roughly R+3) Clinton and the southern part of O3 Shiawassee.

MI5 (yellow): Dale Kildee’s district will be pushed east if Levin and Peters are thrown together. The thumb has to go somewhere, and it can’t stay in Candice Miller’s MI10. Here it loses (bluish?) suburbs and exurbs south of Flint, and gains M1 Huron, M2 Sanilac, and most of O2 St.Clair. This district is currently D+11 and would probably be D+9 or D+10 under the proposed map. It serves the same purpose: a blue sink with Flint, Saginaw, and Bay City.

MI6 (teal): Fred Upton’s district makes up for the loss of much of Allegan with M1 Branch and M2 (roughly R+10) Hillsdale, along with less-populated parts of purple Lenawee. Overall PVI of zero before and after. Kalamazoo (O25, D+7) is this district’s big problem, but you may not be able to legally make a blue sink that takes in both Lansing and Kalamazoo.

MI7 (gray): Here we create a blue sink from what used to be Walberg’s R+2 district. He loses Branch, Hillsdale, Lenawee, and purplish areas of Washtenaw and gets stuck with O49 (D+13) Ingham. The new MI7 also has O5 (D+1) Eaton, O6 (D+1) Calhoun, O2 (R+2) Jackson, and the west end of Washtenaw. Obama won the whole thing by at least 60k, and it’s hopeless for a Republican. Joe Schwarz might be able to lose respectably here, but he wouldn’t be able to win.

MI8 (blue-gray): Rogers moves east, ridding himself of Ingham, Clinton, and southern Shiawassee and swaps in M1 (R+5) Lapeer and suburban/exurban parts of Oakland, Washtenaw, and Genesee. The district’s new areas are less red than M13 (R+10) Livingston, but it’s likely R+6 to R+8 overall whereas the current MI8 is just R+2.

MI9 (toothpaste blue): What’s left after you merge Peters and Levin is another blue sink with blue pieces of southern Oakland and Macomb. For what it’s worth Levin lives here and Peters doesn’t.

MI10 (pink): Miller has to pick up some vacated areas from the current MI9 and MI12, and she gets Rochester Hills, much of Troy, Mt. Clemens, and part of Sterling Heights. This area is probably less safe overall than the reddish areas of the thumb that she has to vacate, and I suspect that the district’s PVI would drop from R+5 to R+3 or R+4. But there isn’t much of an alternative if you want to merge Levin and Peters.

MI11 (pea soup green): Thad McCotter’s district moves east but retains its base in northwestern Wayne County. In Wayne, it drops Belleville and blue Redford and picks up Dearborn Heights. In Oakland, he keeps Novi and not much else, losing the exurban western areas to MI8 and picking up Waterford and the (more problematic?) West Bloomfield and Farmington Hills from MI9. The current MI11 has a PVI of zero and I suspect the new changes would be about a wash. I think the biggest problem with the new MI11 is that is Peters lives there. Having MI8 reach down to pick up W. Bloomfield might violate the compactness or community of interest provisions of the redistricting law, although it might be feasible  to swap some northern parts of Oakland county for pieces of Washtenaw and Livingston that I have going into MI8.  

MI12 (lighter blue-gray): John Dingell’s old MI15 moves slightly west, but still contains Ann Arbor and Ypsilanti and is therefore a blue fortress. His home in Dearborn will probably end up in MI14 as the Detroit districts need to expand.

MI13 (faded pink): Clarke’s district has to cross 8 Mile to pick up part of Warren and Eastpointe. It’s 56% black.

MI14 (brown): Conyers’ district moves west to pick up Dearborn, Redford, and Inkster. It’s 53% black. Both MI13 and MI14 still have PVIs of D+fuhgeddaboutit.      

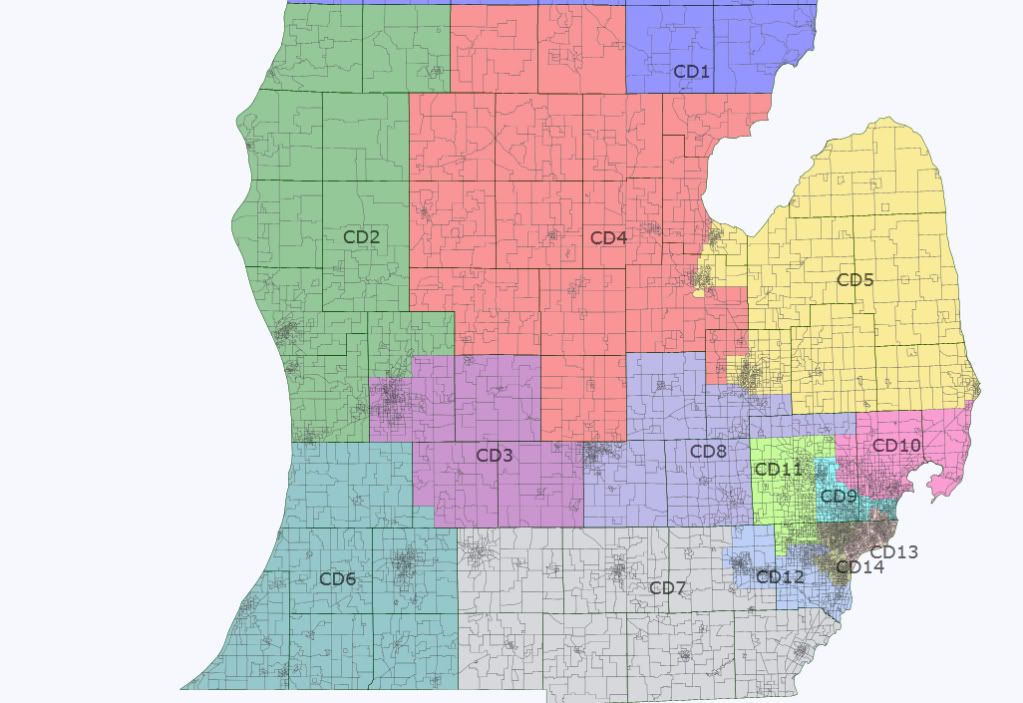
Scenario 2: A 9-5 map, if you can keep it

Here Rogers keeps Lansing, and as before most of the other central and eastern districts have to move in the direction of the areas vacated by merging Levin and Peters. State map:

Michigan1

Detroit area map:

Detroit1

District comments. Unless otherwise noted, “changes” here are relative to the map discussed above, not the current map.

MI1, MI2: no changes.

MI3: Here Amash cannot pick up Allegan, as Upton will need the rest of it as a substitute for Branch and Hillsdale. He has nowhere to go but Eaton, and the result is a district that Obama won: Ionia was M1, Barry M3, and Eaton O5. Kent was O2, and Amash’s piece (Grand Rapids and everything south or west of it) is clearly more blue than the county average. Overall the new MI3 would be R+3 at best, and Amash would likely be vulnerable in a year that is average or better for Dems.

MI4: Here Camp loses northern Shiawassee and replaces it with suburban/exurban areas of Genesee and Saginaw. Probably minimal impact.

MI5: Picks up Lapeer and some of St. Clair, loses bits of Genesee and Saginaw, still a blue sink.

MI6: Picks up the rest of Allegan instead of Branch and Hillsdale. Probably about a wash.

MI7: This time it isn’t sacrificed. Relative to the current MI7 it has to move east, so it swaps out O5 (D+1) Eaton for O3 (R+1) Monroe and makes minor changes in Washtenaw and Calhoun. Probably still R+2, which doesn’t bode well for Walberg after his narrow win on the red wave of 2010.

MI8: Again relative to the current map, it swaps out O0 (R+3) Clinton and part of exurban northern Oakland for northern Shiawassee (O3, D+1) and southern Genesee. This appears less favorable for Rogers than his current district, and would likely move it from R+2 to R+1 or even.

MI9, MI10: Trivial changes.

MI11: Loses much of its Wayne turf including Dearborn Heights, Westland, and Canton and retains more of western and northern Oakland. Possibly better for McCotter than the MI11 from the first map, but this time he is in no position to get any favors from Rogers who is saddled with a shaky district.

MI12: Has more of Dingell’s old stomping grounds. Still a blue sink.

MI13, MI14: no changes.

In the first map, the Reeps give up Walberg’s seat to make Amash somewhat safer and Rogers much safer. Alternatively, they may be able to have Rogers take on a bit more risk (albeit much less than he has now) to make McCotter somewhat safer. The second map is a dummymander in my opinion. Amash, Walberg, and possibly Rogers would all be at serious risk. McCotter would almost certainly be vulnerable to a challenge from Peters, although this is also true of the first map as shown. Politically Michigan is much more like Wisconsin than Ohio: it has lots of purple and not much deep red, and it’s difficult to do a Republican gerrymander.


By what margin will Bob Shamansky win?

View Results

Loading ... Loading ...

House Dem voter attrition in 2010

Conventional wisdom has it that turnout is the key issue in midterm elections. In view of that, how well did individual House Democrats do in convincing their 2008 voters to back them again in 2010? This post looks only at total votes, not margin of victory or defeat. Members who did not run in 2008 (Bill Owens, Mark Critz, Scott Murphy) or who had no Republican opponent in 2008 are excluded. The remaining 198 members’ average 2010 vote was just 61.2% of their 2008 vote. Curiously the median was also 61.2%. These folks managed to retain at least 70% of their 2008 vote:

rep                   dist 2008          2010 retention

Pelosi             CA 8 204,996 167,957 81.9

Pingree           ME 1 205,629 166,196 80.8

Schrader         OR 5 181,577 145,319 80.0

Hirono             HI 2 165,478 132,290 79.9

McDermott       WA 7 291,963 232,649 79.7

Eshoo               CA 14 190,301 151,217 79.5

Giffords         AZ 8 179,629 138,280 77.0

Titus               NV 3 165,912 127,168 76.6

Blumenauer     OR 3 254,235 193,104 76.0

Speier             CA 12 200,442 152,044 75.9

Matsui             CA 5 164,242 124,220 75.6

Lee                   CA 9 238,915 180,400 75.5

Woolsey           CA 6 229,672 172,216 75.0

Lujan               NM 3 161,292 120,048 74.4

Bright             AL 2 144,368 106,865 74.0

Inslee             WA 1 233,780 172,642 73.8

Honda               CA 15 170,977 126,147 73.8

Dicks               WA 6 205,991 151,873 73.7

Tonko               NY 21 171,286 124,889 72.9

Himes               CT 4 158,475 115,351 72.8

Sarbanes         MD 3 203,711 147,448 72.4

Richardson     CA 37 118,606 85,799 72.3

Lofgren           CA 16 146,481 105,841 72.3

G Miller         CA 7 170,962 122,435 71.6

Larsen             WA 2 217,416 155,241 71.4

Schiff             CA 29 146,198 104,374 71.4

Napolitano     CA 38 119,795 85,459 71.3

Stark               CA 13 166,829 118,278 70.9

Sherman           CA 27 145,812 102,927 70.6

Roybal-Allard CA 34 98,503 69,382 70.4

Farr                 CA 17 168,907 118,734 70.3

A Smith           WA 9 176,295 123,743 70.2

McNerney         CA 11 164,500 115,361 70.1

Here we have 24 reps from the west coast vote-by-mail states of California, Oregon, and Washington and 9 from the rest of the country. David Wu and Peter DeFazio went unopposed (at least by Republicans) in 2008 and Brian Baird retired, so every eligible rep from Oregon and Washington shows up on this list. We also see a lot of people from completely uncompetitive districts. Nancy Pelosi and Jim McDermott put up nice numbers, a function of their dogged, relentless campaigning…heh. A function of most of their constituents being unwilling to consider voting for a Republican under any circumstances.

It would be more interesting to limit the list to people who actually faced a credible threat and thus had to run a serious campaign. As a first approximation, cut out anyone whose district is D+10 or better. Here’s the top 10:

rank rep   dist   2008       2010       retention pvi

1 Pingree   ME 1 205,629     166,196     80.8      8

2 Schrader OR 5 181,577     145,319     80.0      2

3 Giffords   AZ 8 179,629     138,280     77.0      -4

4 Titus       NV 3 165,912     127,168     76.6      2

5 Lujan       NM 3 161,292     120,048     74.4      7

6 Bright     AL 2 144,368     106,865     74.0      -16

7 Inslee     WA 1 233,780     172,642     73.8      9    

8 Dicks       WA 6 205,991     151,873     73.7      5

9 Tonko       NY 21 171,286    124,889     72.9      6

10 Himes       CT 4 158,475     115,351     72.8      5

8 of the 10 are in blue districts and 6 of these are D+5 or better. And then there’s Bobby Bright. Now for the bottom 10:

rank rep     dist     2008       2010 retention pvi

110 Grayson       FL 8 172,854    84,167 48.7 -2

111 Boyd               FL 2 216,804    105,211 48.5 -6

112 Childers       MS 1    185,959 89,388 48.1 -14

113 L Davis       TN 4 146,776    70,254 47.9 -13

114 Ortiz             TX 27 104,864    50,179 47.9 -2

115 C Edwards   TX 17    134,592 63,138 46.9 -20

116 Kosmas         FL 24 211,284    98,787 46.8 -4

117 Etheridge     NC 2 199,730   92,393 46.3 -2

118 C Gonzalez   TX 20 127,298    58,645 46.1 8

119 Taylor           MS 4 216,542    95,243 44.0 -20

9 of the 10 are in red districts, and 4 of those are really red. Charlie Gonzalez’ appearance on this list is  misleading as he was never in any trouble. He didn’t get his people out, but he didn’t need them. In any case, it’s understandably a lot harder for Dems to hold on to their presidential-year voters when a lot of them are normally inclined to vote red.

So the two basic rules appear to be: 1) People are more likely to vote in midterm elections when they can conveniently vote by mail, and 2) the bluer your district is, the less likely your voters are to swing against you in a red wave year. I did a simple regression analysis to compute members’ predicted retention based on the PVI of their districts and whether their state predominantly uses vote by mail. Using only the D+9 or lower district as the sample, each point of PVI increased retention by an average of about 0.25 percentage points and vote-by-mail increased it by an average of 7 points. The “diff” column shows the difference between actual retention and predicted retention. So here is the adjusted top 20 as measured by differential:

rank rep        dist    diff

1 Pingree     ME 1    19.6

2 Bright         AL 2    19.1

3 Giffords     AZ 8    18.9

4 Titus           NV 3    17.0

5 Lujan         NM 3    13.4

6 Schrader   OR 5    13.3

7 Himes         CT 4    12.3

8 Kratovil       MD 1    12.3

9 Tonko         NY 21    12.2

10 Perriello     VA 5    11.8

11 Sarbanes   MD 3    11.6

12 Arcuri           NY 24    10.0

13 Boswell       IA 3    9.6

14 Yarmuth       KY 3    9.0

15 Peters         MI 9    8.9

16 Courtney   CT 2    8.9

17 C Murphy   CT 5    8.8

18 Altmire       PA 4    7.2

19 Heinrich     NM 1    6.9

20 Boren         OK 2    6.8

And it’s still Chellie Pingree by a nose. Interestingly, the top 19 consists of 18 freshmen or sophomores and one Boswell. (Yep, the much-maligned Leonard Boswell arguably ran the best campaign of any House Dem with actual experience of serving in the minority.) This seems counterintuitive given that newer members have not had much time to build up goodwill and thus should be more vulnerable to losing support in a red wave year. Instead, it appears that these newer reps were used to having to scratch and claw for every vote and thus adapted more easily to an unfriendly environment than veteran reps who were used to winning easily did.

There was a big gap between #3 and #4 and an even bigger gap between #4 and #5. These four super-overachievers come from dissimilar districts and had dissimilar records and this time I don’t see a pattern:

Pingree was one of the few Dems to win by a bigger margin in 2010 than 2008, and this doesn’t appear to be any unobserved Maine-specific effect (Libby Mitchell coattails? heh) as Mike Michaud had a differential of just +4.8. This race did not get much attention, although it was considered competitive at one point. Was Pingree’s remarkable retention number a function of a sloppy campaign in 2008 or a brilliant one in 2010, or both?

Bright almost never voted with the Dems, but Gene Taylor didn’t either and Bright only retained 30% more of his 2008 vote than Taylor did! It still wasn’t enough to get him over the hump, but he came a lot closer than similarly situated dudes like Lincoln Davis, Chet Edwards, and Travis Childers.        

Gabrielle Giffords was the other red-district rep to make the unadjusted top 10. Her district is far more purple than Bright’s but she also took many more risks than he did, voting for TARP, the stimulus, cap and trade, health care, and financial reform. This did not appear to hurt her much with the Dems and swing voters who voted for her in 2008. Like Pingree, she got zero up-ballot help but unlike Pingree she just barely held her seat. Her voting record may have motivated the people who opposed her in 2008 to stick around and pull the lever for that megatool Jesse Kelly.

Unlike the top 3, Dina Titus got some indirect help in the form of Harry Reid’s fearsome operation. Titus probably deserves some credit for her strong showing, though. Shelly Berkley isn’t a perfect comparison (much higher baseline Dem vote but also a much less threatening opponent) and with a D+10 district just missed the regression sample, but her differential would have been +4.9, and 12 points is a big spread in any case.

Here is the adjusted bottom 20:

rank rep             dist          diff

100 B Miller           NC 13    -8.0

101 Nye                     VA 2    -8.1

102 Loretta Sanchez CA 47    -8.1

103 Space               OH 18    -8.1

104 Cuellar           TX 28    -8.3

105 Doggett           TX 25    -8.6

106 Boyd                 FL 2    -9.0

107 Taylor           MS 4    -9.9

108 Donnelly           IN 2    -9.9

109 Grayson           FL 8    -9.9

110 Filner             CA 51    -10.1

111 Hinojosa             TX 15     -10.2

112 Ortiz               TX 27    -10.8

113 Pallone           NJ 6    -11.3

114 Kosmas           FL 24    -11.3

115 Visclosky         IN 1    -11.6

116 Carnahan       MO 3    -11.9

117 Etheridge         NC 2    -12.4

118 C Gonzalez       TX 20    -15.2

119 Costa               CA 20    -17.8

There may be some unobserved variation related to demographics or state election laws, as the only state to put a rep in both the top 20 and the bottom 20 was Virginia. Glenn Nye managed to retain 20% less of his 2008 vote than Tom Perriello did despite voting with the Dems less often. Texas in particular was a sea of apathy for Dems, as the best performer was actually Chet Edwards at -6.9! That said, Bob Etheridge’s failures are his own, not North Carolina’s. Heath Shuler managed a +4.6 differential.

If you rightly ignore Gonzalez who won by 29 points, Jim Costa turned in the worst performance by a country mile. It’s true that his district is young and poor and heavily Hispanic, but so is Raul Grijalva’s, and Grijalva had a +3.6 differential without the benefit of vote by mail! (Grijalva’s big mouth probably ran up Ruth McClung’s vote total as opposed to depressing his own, as his margin of defeat was worse than even the hopeless Rodney Glassman’s in some counties.) We’ll see if Costa takes his narrow escape as a wake-up call, as commission redistricting is likely to put him in a less friendly district.

Just eyeballing the data, it appears that richer districts generally had more retention than poorer ones (note the 3 Connecticut dudes in the top 20 and the many south Texans in the bottom 20) so I may rerun the numbers once I find enough time to enter the median income of all the districts.

Some conclusions: Chellie Pingree and Leonard Boswell are underrated. Don’t be surprised to see Bobby Bright, Dina Titus, Frank Kratovil, Tom Perriello, and/or Michael Arcuri resurface. Keep an eye on Ben Lujan. Russ Carnahan and especially Jim Costa need to step it up. It may be premature to speculate about Gabrielle Giffords’ future (early signs are good), but she was a beast as of 2010. Vote by mail is great. The Texas Dems’ 2010 turnout was uglier than the Texas Longhorns’ 2010 offense.

Thoughts? (How do you post clean tables from spreadsheets? I tried saving them as PDFs but was unable to convert them to photos.)    

By what margin will Bob Shamansky win?

View Results

Loading ... Loading ...

Updated!! Arizona, take 2

Speak of the devil! After all my grumbling about the inadequacy of the county-level population estimates, it turned out that our friend Dave was about to produce new tract-level estimates from the American Community Survey. So here is a new district map of Arizona, with exactly the same concept (new exurban AZ9 drawn mostly from the overpopulated AZ2, AZ6, and AZ7) but actual district boundaries as opposed to rough guesses.

With the ACS estimates, the aggregate population was very close to the Census 2010 figure so the “phantom” problem disappeared. It also turned out that Nico was exactly right about how much the old districts had grown: AZ6 was first, followed by AZ2, AZ7, and AZ8. AZ3 and AZ4 weren’t far behind, and AZ5 was actually about 9k understrength.

Here is the new state-level map:

Photobucket

The Phoenix map:

Photobucket

I drew a serious border between AZ7 and AZ8 instead of just guessing, so here is the Tucson map:

Photobucket

District notes:

AZ1: The boundaries were almost identical to the first map I drew, as it needed to take the strip and Kingman from AZ2 to hit its target. Ethnic mix: old 58 white/18 Hispanic/20 Native American, new 61W/15H/21N. Probably a bit more red now.

AZ2: Lost a bit more territory than I expected to the new AZ9. Ethnic mic: old 70W/20H, new 73W/18H.  

AZ3: Had to lose about 45k, and lost them all on its southern end to AZ4. No need to take any of AZ5, which was below its target. Ethnic mic: old 71W/20H, new 73W/18H.

AZ4: Also had to lose about 45k and AZ9 took a big bite out of its southwest corner, forcing it to move a bit north. Not as pretty as it was before, but still nice and blocky. Ethnic mic: old 22W/66H, new 24W/64H. I don’t think Ed’s worried.

AZ5: Only 9k under its target, it could basically stand pat. Swapped a few districts with AZ6 to make the lines cleaner. Ethnic mic: still 71W/17H.

AZ6: I decided to keep Apache Junction here since it’s really an extension of east Mesa and didn’t grow much in the 00s. As in the previous map, it loses the rest of its Pinal piece to AZ9 and its Chandler piece (this time mostly to AZ9 instead of all to AZ5), and retains Gilbert, Queen Creek, and almost all of Mesa. Ethnic mic: old 71W/21H, new 72W/20H.

AZ7: It had to keep a bigger than expected piece of Pinal, which resulted in AZ9 being pushed north. It had to take about 57k people from AZ8, and the current boundaries are a fairly straightforward northwest-southeast line as opposed to a strained attempt to jam as many Hispanics as possible into AZ7. I decided to stick with this and had AZ7 nibble at the edges of AZ8, although I restricted it to tracts that were at least 20% Hispanic. Ethnic mic: old 34W/55H, new 36W/54H.

AZ8: Looks much more like the current AZ8 than my previous map did, and keeps its Pinal tract now. The pieces it lost to AZ7 had the effect of reducing the Hispanic percentage in both districts. Ethnic mic: old 70W/21H, new 71W/20H.

AZ9: The previous AZ9 I drew turned out to not have enough peeps, so now it has to go deep into Chandler on the east side and well north of I-10 on the west side. Interestingly this district is majority-minority at 46% white, 41% Hispanic, and 6% black which is high for Arizona. It probably leans Dem at least in a presidential year.

(here is the original post in its entirety)

Short version: Exurban areas of Pinal and Maricopa counties that grew like a weed in the 00s are carved out of districts 2 (Franks), 6 (Flake), and 7 (Grijalva) to form a new district 9. The other 5 districts only get minor tweaks to meet population requirements for the most part.

This map is my interpretation of shamlet’s description of his own map with an exurban AZ9. My original concept was for AZ9 to stay entirely within the west valley of Maricopa county including the established cities of Glendale and Peoria along with some of the bubble areas to the south, pushing AZ2 to the west to pick up Yavapai county and forcing AZ1 (Gosar) to pick up almost all of Pinal county. I decided that I liked shamlet’s concept better, as mine would have been more disruptive to the current map and would have likely resulted in AZ1 being dominated by exurban Pinal at the expense of its far-flung, highly diverse rural communities.

Some words of warning: The boundaries between the districts are approximate, not absolute. The population estimates in the redistricting app only go down to the county level. This is fine for a state like Iowa where no county is big enough to contain as many as one district, but it causes trouble in Arizona which has just 15 counties, with nearly 80% of the population in just two of them! The distribution of population within Maricopa and Pima counties is uncertain, especially in Pima where nearly 90% of the population is either in Tucson or in unincorporated areas. I drew the lines based on my best guess. A further complication is that the 2010 census shows the state with 6.39m people, well below the 2009 estimate of 6.60m. This map is based on the 2009 estimates for cities and counties, which somewhere include 200k people who apparently aren’t really there. I suspect that a disproportionate number of these phantom people are in the bubblicious AZ9, but they could be anywhere. It will be interesting to see the 2010 census figures for cities and counties, but we don’t have those yet, so…

Here is the statewide map, with the usual color scheme.

Arizona

And here is the close-up of the Phoenix area.

Phoenix area

Now for notes on the individual districts. The target population for each is 713k.

AZ1 (blue): Paul Gosar’s district has an estimated population of 619k (less any phantoms) in its core counties of Yavapai, Coconino, Apache, Navajo, Gila, Graham, and Greenlee. That means it probably needs about 100k from somewhere else, either Mohave or the less populated eastern end of Pinal. I’m  guessing that they would get about that amount from the Kingman area and the “strip” north of the Canyon in Mohave, and from eastern Pinal which has a lot of old mining towns that fit well with the rest of the district. Changes: loses some of south-central Pinal to AZ7, picks up Kingman and strip areas from AZ2 and one Pinal precinct from AZ8 (Giffords).

AZ2 (green): Trent Franks’ district will have to shed a lot of people, but even after losing the Kingman and strip areas and the (formerly?) fast-growing areas of southwest Maricopa, it retains its west valley base with Peoria, most of Glendale, Surprise, and the Sun Cities. I moved La Paz county here from AZ7, as with 33% of its population over age 65 it fits better in AZ2. The boundary shown here between AZ2 and AZ9 is just a guess and could move north or south depending on the final counts. As always, the Hopi reservation is separated from the surrounding Navajo reservation and attached to AZ2. I intended no change in the river-connector between the Hopi rez and the rest of the district, although it does not show up on the map.

AZ3 (purple): I drew Ben Quayle’s Phoenix-dominated district to lose some of its southernmost precincts to AZ4 (Pastor) and absorb north Scottsdale and Fountain Hills from AZ5 (Schweikert), but it appears that it grew faster than AZ5 did. The increase in the House vote from 2002 to 2010 was 34% in AZ3 and just 25% in AZ5, so it’s possible that AZ5 could retain its northeast end. AZ3 could also lose some of its western end to AZ2 if it turns out that AZ2 is too small after AZ9 fills up.

AZ4 (red): Ed Pastor’s Phoenix district started the decade with by far the least undeveloped land of the 8 districts and probably had the least new construction, but its House vote increased by 39% from 2002 to 2010. Its people still vote at a rate far below the state’s other districts (just 92k total votes; the other  7 were all over 150k and 6 were over 200k), so this increase may represent increasing Hispanic participation more than population growth per se. The Census estimated that Phoenix grew just 21% between 2000 and 2009 and it seems likely to me that most of this growth was in AZ3, so I drew AZ4 to pick up some of AZ3’s southern precincts. This may be the cleanest-looking VRA district in the country, and I drew it to stay that way.  If it needs to contract, it would lose some of its southwestern precincts to the new AZ9.

AZ5 (yellow): I generally tried to keep existing districts together, but in this case I went for keeping cities together. David Schweikert’s district loses its Mesa piece to AZ6 while picking up the rest of Chandler. It now consists of Tempe (179k in 2009), Chandler (250k), Ahwatukee (85k in 2000 but probably more in 2009), and enough of Scottsdale (238k) starting from its south end to fill up to its quota of 713k.

AZ6 (teal): Jeff Flake’s district shrinks considerably and pulls entirely out of Pinal. It now consists of Mesa (467k), Gilbert (222k), and Queen Creek (26k) which put together would be big enough to make up a district if not for the phantoms. It could take Chandler-area precincts that I drew it losing to AZ5 as necessary to fill up.

AZ7 (gray): There are a total of 1.39m people (again, less any phantoms) in the four southern counties of Yuma, Pima, Santa Cruz, and Cochise, which is nearly enough to support two districts. Raul Grijalva’s district can pick up the necessary overage from the sparsely populated Gila Bend (I-8) section of Maricopa and the southwest corner of Pinal. If needed it could also retain La Paz, which as mentioned above is a poor fit for the district in my view. I don’t know where the border between AZ7 and AZ8 in Pima should go. I suspect that the AZ8 piece of Pima grew faster, as the House vote increase from 2002 to 2010 was 32% in the AZ7 section compared to 40% in the AZ8 section. I had AZ7 take the mostly-empty remaining sections of Santa Cruz and a few Pima precincts mostly west of I-10 or I-19 from AZ8.

AZ8 (blue-gray): I suspect that poor Gabrielle Giffords’ district won’t have to lose too much ground. Its House vote increased 41% from 2002 to 2010, but this may have been partly due to the 2010 race being a barnburner whereas 2002 was a snoozer. Cochise county grew 10% in the 00s and Pima 21%, and it’s likely that the AZ7 section of Pima grew at a decent clip so it seems probable that AZ8’s growth was less than its vote totals suggest. This district loses its small Pinal and Santa Cruz pieces and otherwise looks about the same as before.

AZ9 (toothpaste blue): The new district comes almost entirely from the fast-growing exurban Phoenix areas of southwestern Maricopa and western Pinal. It combines the Pinal portion of AZ6, some south-central Pinal areas of AZ1, the Phoenix-area piece of AZ7, and much of the southern end of AZ2. Its population centers include Avondale (85k), Buckeye (52k), Goodyear (64k), the city of Maricopa (45k) which oddly enough is in Pinal, most of unincorporated Pinal (161k), Casa Grande (44k), Apache Junction (34k), and probably a fair portion of unincorporated Maricopa (229k). This district may have the highest percentage of homes in foreclosure in the nation, and probably more phantoms than any of the other districts. As necessary it could take some of the eastern part of Pinal from AZ1 or the southern end of AZ2 to get up to full, which would affect the division of Mohave county between AZ1 and AZ2. Politically this district would probably start out tilt-R or lean-R but shift D as its Hispanic population starts to vote more. Flake won exactly 2/3 of the two-party vote in the AZ6 Pinal piece (30k total votes), although this was less than his districtwide margin. On the other hand, the very liberal Grijalva won 54% of the two-party vote in the AZ7 Maricopa piece (24k total). The current AZ2 is blood-red, but the piece it would lose to AZ9 is most likely younger, poorer, and more Hispanic than most of the rest of the district given that housing prices tend to be lowest in the furthest-out areas. Gosar did about as well in the Pinal section of AZ1 as he did districtwide, but the section that would be lost to AZ9 may differ from the section that would remain in AZ1.

Overall, Arizona presents a rare case where a new district can be created without fundamentally changing any of the existing districts. The state’s most explosive growth areas were nearly empty at the start of the decade and close enough together that combining them makes a compact, contiguous, sensible district that would pass muster in a commission-redistricting state. AZ2, AZ6, and AZ7 lose a lot of territory, but almost everyone who lived in one of these districts in 2002 and stayed put will still be in their old district. None of the current House members are likely to be helped or hurt much. Grijalva will be glad to be rid of La Paz but not so much his Phoenix-area precincts, and Gosar would like to pick up some of Mohave, but these are marginal changes.  

Thoughts?  

By what margin will Bob Shamansky win?

View Results

Loading ... Loading ...

House and Senate predictions

D-held house seats:

I would be shocked if Dems held any of these: AR 2, CO 4, FL 2, FL 8, FL 24, IL 11, IN 8, KS 3, LA 3, NY 29, OH 1, OH 15, PA 3, TN 6, TN 8, TX 17. +16 R.

I would be surprised but not shocked if Dems held any of these: MD 1, MS 1, NH 1, PA 7, VA 2, VA 5, WA 3. +5.6 R if each has an 80% chance to go R.

I’d bet the Reep if I had to bet, but would not be surprised if Dems held any of these: AR 1, AZ 1, WI 7, WI 8, MI 1, PA 8, OH 16, NV 3, NM 2, SC 5, ND, GA 8, NY 20, NJ 3, CO 3, NH 2, IL 17. +10.2 R if each has a 60% chance to go R.

I’d bet the Dem if I had to bet, but would not be surprised if Reeps took any of these: AZ 5, AL 2, IL 14, NY 19, NY 23, PA 10, PA 11, SD, MI 7, WV 1, OH 18, FL 22, NC 8, IN 9, TN 4, TX 23, MS 4. +6.8 R if each has a 40% chance to go R.

I would be surprised but not shocked if Reeps took any of these: CT 4, CT 5, MN 8, IA 2, ID 1, IN 2, MO 4, NY 24, NY 25, PA 12, MI 9, AZ 8, OR 5, WA 2, NC 7, MA 10, NM 1, CA 11, CA 20, CA 22, CA 47, VA 9, VA 11, OH 6, CO 7. +5.0 R if each has a 20% chance to go R.

I would be shocked if any other Dem seats flipped. That includes NC 11 and NY 22.

R-held seats:

I would be shocked if Reeps held DE. +1 D.

I would be surprised but not shocked if Reeps held any of these: HI 1, IL 10, LA 2. +2.4 D if each has an 80% chance to go D.

I’d bet the Reep if I had to bet, but would not be surprised if Dems took FL 25. +0.4D if the Dem has a 40% shot.

I would be surprised but not shocked if Dems took WA 8 or CA 3. +0.4 D if each has a 20% chance to go D.

I would be shocked if any other Reep seats flipped.

So I have Reeps flipping an expected 43.6 seats, Dems flipping 4.2, for a net of 39.4 to the Reeps…hmm. If I had to bet I’d bet the over, as I suspect my ratings may be too favorable to Dems. I’ll just round up to 40.

Senate:

D-held seats:

ND, AR, IN 100% to flip.

WI 90%

PA 75%

IL 55%

CO 50%

NV 40%

WA 25%

WV 20%

CA 5%

CT 5%

Everything else, forget it. R +6.65.

R-held seats:

AK 20% counting Murk as a Reep.

KY 5%

MO 5%

and that’s it. D +0.3.

Net of 6.35 seats to the Reeps, call it 6 because Senate races are easier to keep track of.

So that’s a net of 40 House seats and 6 Senate seats to the Reeps.