Comment

To start, your Barrow numbers are wrong.  He (mis)represents a blue district; you must have him mixed up with another Georgia politician, Paul Broun perhaps.  So, look at those votes again with that in mind.  Look specifically at his anti-energy bill vote and notice just how close his district is to the coast and see how long you scratch your head.  Then, look at his PAC donations for this year.  Lot’s of energy money.

I also feel the need to answer some things said here and elsewhere in defense of the Blue Dogs.

1. I’ve seen the line that there are more conservatives brought up at least twice here.  First, the plurality of the electorate is self-identified moderates.  Add liberals, and you get 66%, leaving conservatives at just 34%.  Second, that’s self-identified conservatives.  After decades of “liberal” being a dirty word, of course fewer are going to self-identify as such.

2. A lot of people have convinced themselves

3. I’ve also seen a

I say primary them all.  Nineteen Blue Dogs come from Obama districts.  Another seven or so come from only marginal McCain districts, making claims of some huge Republican tide seem far-fetched.  And if we’re not going to get  

Georgia Republican Gerrymander

The major non-Atlanta regional population centers (Athens, Augusta, Columbus, Macon, and Savannah) all get a district to themselves and their surrounding areas, intact, without sharing with another major city.

I think a lesson to take from this is that ostensbile communities of interest and clean lines making geometric districts can really fuck us over and an unwillingness to cross political and geographic boundaries can really kill us.

New York Ready in Daves Redistricting

Johnny beat the annoucement that New York is ready, with a great map. (Nice going!)

I’ve also made a couple of improvements to the software, prompted by working with New York:

– Thinner block lines, so you can see the tiny blocks.

– The slow work of Assign Old CDs now happens when you click the button instead of on load. (It took about 4 minutes for NY on my not too slow machine.)

– Zoom: Scrollbar replaces slider.

Here’s a link.

Note also: I am looking at partisan data, but it will take some time.

Enjoy.

Redistricting New York

With New York available as of yesterday, I took no time to do a map losing one district. My findings are that they’re probably going to have to axe one of the upstate districts, and I chose NY-23.

Click here for full-size.

NY-01 through NY-17 – These districts didn’t change much, if any. All safe D, except for NY-01, which leans D, NY-03, which leans R, and NY-13, which is a swing district.

NY-18 (purple, Westchester-based district; Nita Lowey – D) – Picks up Republican Putnam County, which should be balanced out by Westchester.

NY-19 (ugly green Dutchess/Orange district; John Hall – D) – Loses Putnam and is basically all of Orange and Dutchess now, making it slightly more Democratic.

NY-20 (brown, Scott Murphy – D) – Chopped off the southern part of the district and added parts of NY-23. A couple points more Democratic now.

NY-21 (pink, Albany-based district; Paul Tonko – D) – Slightly more Republican due to some Republican parts of NY-23 added, but still safe D.

NY-22 (dark red, Maurice Hinchey – D) – Lost quite a bit of Dem territory, but still Dem-leaning.

NY-23 (pink, backwards-C shaped district, Eric Massa – D, formerly NY-29) – Cut out a lot of the Republican parts and added Tompkins, Seneca, and more of Monroe. Probably won by Obama now.

NY-24 (dark purple, Mike Arcuri – D) – Still a 50-50 district. If Scozzafava wins in NY-23, she’ll be in this district, so Arcuri’s going to have to learn how to campaign better.

NY-25 (pale green in the middle of the state, Dan Maffei – D) – Picked up Cortland and part of Chenango. Probably a little more R now, but still leans D.

NY-26 (grey, Chris Lee – R) – Safe R district! Pretty much every Republican county in Western NY.

NY-27 (dark pink, Erie-based; Brian Higgins – D) – Didn’t change much.

NY-28 (green, Niagra/Orleans/Monroe/Erie district, Louise Slaughter – D) – Nor this one.

So, there you have it. If the Democrats pick up NY-23 this year, it’s going to be hard for them to preserve the district, because NY-29 has a lot of Republican territory that would have to be split up.

Introducing PBI (Party Brand Index)

I have been working on (with some much appreciated help from pl515) a concept I’m calling PBI or Party Brand Index, as a replacement for PVI.  PVI (Partisan Voting Index), which is measured by averaging voting percentage from the last two presidential elections in each house district, and comparing it to how the nation as a whole voted, is a useful shorthand for understanding the liberal v. conservative dynamics of a district. But in my opinion it falls short in a number of areas. First it doesn’t explain states like Arkansas or West Virginia. These states have districts who’s PVI indicates a Democrat would be in a hard position to win, never the less Democrats (outside of the presidency) win quite handily. Secondly why is that the case in Arkansas but not Oklahoma with similar PVI rated districts?

Secondly PVI can miss trends as it takes 4 years to readjust. The main purpose of Party Brand Index is to give a better idea of how a candidate does not relative to how the presidential candidate did, but rather compared to how their generic PARTY would be expected to perform. I’m calling this Party Brand Index.

My best case for arguing against PVI is Indiana.  Bush won Indiana quite easily in 2000 and 2004. The PVI of a number of it’s districts showed them to be quite Red. Yet in 2006 democrats won several districts despite their PVI’s. Also Obama won Indiana in 2008 a state, which based on the make up of the districts PVIs, made little sense. I therefor chose Indiana as my first test case for PBI.

Indiana also had a number of other oddity that made it an interesting test case. Indiana has Senators from opposite parties that each won election by large blowouts. Lugar’s in particular was enormous as he was essentially unopposed. Indiana also had a number of districts that flipped in the 3 election cycle expanse that I’m examining. Finally it makes the best case for why PVI can be misleading.

To compute PBI I basically did the following. I weighed the last 3 presidential elections by a factor of 0.45. Presidential preference is the most indicative vote since it’s the one politician people follow the most. The POTUS is the elected official people identify with or despise the most, thus illuminating their own ideological identification. I then weighed each house seat by 0.35. House seats are gerrymandered and the local leader can most closely match their districts make up in a way the POTUS can’t. So even though they have a lower profile I still gave them a heavy weight. Lastly I gave the last two Senate elections a weight of 0.2. Senatorial preference can make a difference, although I think it’s less than that of the President or the House members. Also (more practically) because I have to back calculate (estimate) Senate result totals from county results, a smaller number helps lessen the “noise” caused by any errors I may make.

I was then left with this chart:

I now began to look at the results. Under my system Democratic leaning have a positive number, the GOP has a negative number. Donnelly in the Indiana 2nd is a perfect example of my issues with PVI. Under PVI Donnelly is in a Republican district with a PVI of -2. But look at how democrats have recently performed in this district. In 2008 Donnelly won reelection by 37%! Obama won this ditrict by 9 points, and Bayh won it by 22%! Does this sound like a lean GOP district? Under PVI it is, under PBI it’s not it’s a +11 democratic district.

I then decided to go all Nate Silvaish and gave more recent elections a greater weight. I gave an addition 5% weight to each election as it got closer to the most recent election. To be honest I pulled 5% out of my dairy air but Nate gave a similar weighting to poll results as fresher ones came in 2008, so I copied this formula. This resulted in the following:

The next issue I decided to tackle was to develop a way to weight for incumbents.  The reelection numbers for incumbants is so high it would be a mistake to weight a district soley on the fact that an incumbat continues to get elected. There is a long list of districts that have PVI that devate from their incumbant members, whom none the less keep getting elected. These disticts then change parties as soon as the incumbant member retires. This is evidence that incumbancy can disguise the ideology of voters in a district.

I decided on a weight of about 7% for House members. I remember reading that incumbency is worth about 5-10%. Also Nate wrote in a 538.com article that a VP pick from a small state was worth about a 7% swing, a house seat could in fact be thought of as a small state, that seems as good a number as any to start from. Conversely I will deduct 7% from an incumbents win. I think this will score them closer to the natural weight of a district. By the way I’m weighting the win 7% less, not actually subtracting 7% from the number.  Open seat races will be considered “pure” events and will remain neutral as far as weighting goes.  A seat switching parties will also be considered a neutral event. The 1st defense of a seat by a freshman house member will be given a weighting of 2%. The toughest race for any incumbant is their 1st defense. I decided to adjust for this fact. Note: Indiana’s bloddy 9th was a tough call a case could be made that when a seat keeps flipping, and the same two guys run 4 straight times in a row each election should be a neutral event.

Senate weighting will be as follows. In state with a single House seat the Senate seat will be weighted the same as a house. In states with mutiple seat, the Senate will get a wighting of 2%. Nate Silva stated that a VP pick in a large state is worth this amount. An argument could be made for a sliding scale of Senate weighting from 2-7%, this added complexity may be added at a later date. I will give incumbant presidents a 2% weighting, until I get better data on how powerful a “pull” being the sitting POTUS is, I will give them the same weighting as a senator.

The main purpose of Party Brand Index is to give a better idea of how a candidate does not relative to how the presidential candidate did, but rather compared to how their generic PARTY would be expected to perform. I’m calling this Party Brand Index.

______________________________________

The last major issue is how to deal with the “wingnut” factor. Sometimes a politician like Bill Sali (R-Idaho) or Marylin Musgrove (R-CO)lose because their voting record is outside of the mainstream of their district. I decided to try and factor this in.

First I had to take a brief refresher on statistics. I developed a formula based on standard deviations. Basically I can figure out how much the average rep deviates from their district.  If I then compare where a reps voting pattern falls (in what percentile) and compare it to their district’s PVI, I can develop a “standard deviation factor”. Inside the standard deviation will get a bonus, outside a negative.

For example, if Rep X is the 42 most conservative rep, that would place her in the 90th percentile. But if her district’s PVI was “only” the in the 60th, their is a good chance her margins would be effected. Using a few random samples I found most reps lie within 12% of their district’s PVI.

Using these dummy numbers I then came up with this.  


   SQRT[(30-12)^2 /2] = about 13%

    Her factor would then be 100 – 13 = 0.87.

So her victory margin would be weighted by 0.87 because she is more than 12% beyond her acceptable percentile range it making the victories in her district approximate 13% less “representative”.

    My theory yields the following formula:

        If rep’s voting record is > PVI then

            100 – SQRT[({Record percentile – PVI} – Standard PVI Sigma)^2 /2] = factor

        else if rep’s voting record < PVI

             100 + SQRT[({Record percentile – PVI} – Standard PVI Sigma)^2 /2] = factor

To really do this I need to compute the standard deviation for all 435 reps, which is a pretty large undertaking. Instead  I will do a google search  to see if anyone has already done this. If not well it will take some time. But this would deal with the wingnut factor. Since politician tend to vote relatively close to their districts interest (even changing voting patterns over time) this may not be a major issue. But developing this factor may eventually allow the creation of a “reelection predictor”, so I am still going to work on it.

One last note, the corruption factor (for example Rep. Cao (R-LA) beating former Rep. Jefferson) is outside of any formula I can think of. The only saving grace here is that because my formula uses several elections, the “noise” from a single event will eventually be reduced.

Next Up: Colorado ( have the data done already) and Virginia

How To Stop the Embarrassment: MN Redistricting 8 Seat Map

Yeah, here’s another Minnesota redistricting…

My 7 seat map can be found here.

I did none of this with a computer program or anything like that.  i was fortunate that MN provides all the info I needed to do this with the MnSOS office providing all the vote totals and also precinct maps of every state house seat, which was the main way I broke down the districts by vote and population when I didnt need to break it down to city/township/precinct level.  The state legislature websites has excellent maps with the two I used constantly were a map of the all the state house seats that also showed city boundaries which made it my go to map for figuring out my planned geography.  More importantly though, a precinct map of the entire state showing election results from dark red to dark blue.  I found county population totals for 2007 and when they broke down beyond that point, I wikipediad it which sometimes included 2006 estimates but mainly for 2000 totals and then I used common sense for population movements, figured out the percentage of growth for that county/area, etc to figure out the 2007 population of said city/precinct.  There is certainly some error involved in this but nothing that would alter more than a couple precincts here or there and then my map accounts for current population movement as opposed to 2000, little bit of a trade off there.

Everything is recorded in excel spreadsheets, they look like a hot mess.


Photobucket

map with county lines can be found here

My CD4 is quite a gerrymander but none of that is essential to district make up.  This map could easily be changed to provide nice clean lines but I wanted to pack Dems and Reps to see what the best case scenarios could be.  Undoing any gerrymanders would still result in my intended goals.

This is map is either a 7/1 or 6/2 map. Bachmann can’t win her district but a more moderate Republican possibly could.  And Kline is now uber safe.  Paulsen is drawn out of his district and could possibly run there, but you’ll see later that the Obama margin for victory there is Philly/Chicago suburb like and he’d probably not bother moving. 7/1 at the best 6/2 at worst.

As for the tables, the first 08 is the new Obama vs McCain percentage for each of my districts, second 08 is what the current district got.  And then the following years are what the current districts got as well with them being the three-way vote.  Then next is population and what each county got in 08 and 04.

MN-1 Rep. Walz Pop. 2008 2008 2004 2004
Total 651557 50/45.5 51/47 48/52 47/51
Pop. Obama McCain Kerry Bush
Houston County 19515 54 44 48 51
Winona County 49802 58 39 52 46
Watonwan County 11022 49 48 45 53
Steele County 36378 46 51 56 43
Dodge County 19552 44 54 42 57
Wabasha County 21783 47 50 47 52
Olmsted County 76470 51 47 47 52
Mower County 38040 60 37 61 38
Freeborn County 31257 57 41 55 44
Waseca County 19528 45 53 43 56
Blue Earth County 59802 55 42 48 51
Nicollet County 31680 54 44 50 49
Martin County 20462 41 56 42 57
Brown County 26013 43 55 37 61
Murray County 8511 49 48 44 54
Jackson County 10883 47 51 46 52
Cottonwood County 11349 46 52 43 56
Nobles County 20128 48 50 42 56
Pipestone County 9305 42 55 38 61
Rock County 9498 42 56 39 60
Faribault County 14869 46 51 43 55
Fillmore County 21037 53 44 49 50
Lincoln County 5877 49 48 47 52
Redwood County 15519 42 55 38 62

This district changed very little, it took an extra county here and there but more or less, I didn’t want to change it.  Walz is already winning by large margins and he’s an excellent fit for the district.

MN-2 Rep. Kline Pop. 2008 2008 2004 2004
Total 651855 40/58 48/50 38/60.5 45/54
Pop. Obama McCain Kerry Bush
Wright County 117372 40 58 38 61
Scott County 62113 39 59 37.5 61.5
Carver County 88459 41.5 57 36 63
Dakota County 38718 44 54 39 60
Sherburne County 86287 39 58 39 60
Stearns County 86586 40 55 40 58
Benton County 5881 36 61 36 63
Hennepin County 72869 37 62 37 61
Anoka County 54649 40 58 40 59
Isanti County 38921 41 56 41 58

I decided to tie all the conservative exurban areas together along with Republican suburbs, putting all the republican counties into one congressional district instead of spread across two.  This makes it mainly a combination of CD2 and CD6, and takes out the main Republican-fundy base of Bachmann’s district.  It takes out the counties around the St. Cloud area, minus St. Cloud, keeps the former second’s GOP base of Carver and Scott county in the southwest (minus some of the suburbs that were 50/50’ish for Obama), also heavily conservative Wright county from CD6, and I threw in Isanti county from CD8 to shore up the GOP into one CD.  The district has a bit of a propeller as I need to pick up more population and those 4 townships in Benton were the most GOP areas to connect to CD2.  Kline lives in the portion of Dakota county that it includes and will be 100% safe in this district.  However, Bachmann will be looking for a seat as well. More on that later.

MN-3 OPEN Pop. 2008 2008 2004 2004
Total 650300 57/41 52/46 53/46.5 48/51
Pop. Obama McCain Kerry Bush
Hennepin County 487008 58 40.5 54 46
Anoka County 163292 53 43 51 48

This district shifts east and north as I cut out some of the traditional upper-to-upper middle class suburbs to take in more working class suburbs bordering Minneapolis to the west and north.  Eden Prairie, Bloomington, and most of Edina now are in CD5 (I kept some of Edina in CD3 for population and gerrymandering as some precincts went 2-1 for Obama while the city as a whole went about 55-45.)  The district then picked up Hopkins, Golden Valley, St. Louis Park, Fridley, Columbia Heights, and a few others in that area.  These areas also have a much higher proportion of minority voters so the district gets a bit less white and without Edina and Eden Prarie, probably drops pretty far in average income.

Paulsen lives in Eden Prairie so technically this district is open.  He could move to run here which he may to give it a shot but it voted for Obama by 16%, an increase of 10% from the current district lines.  We have a HUGE bench in this district to make that happen as there are roughly 25 state reps and senators per CD and the GOP only has about 6-7 of those seats in this CD.  I want to give Paulsen somewhat of a chance of retaining this seat (PA6, IL10) but I really dont know how he could.

Please tell me someone watched Mighty Ducks recently and these cities all sound familiar….  Cake eater is from Edina, Goldburg I believe is Bloomington.

MN-4 Rep. McCollum Pop. 2008 2008 2004 2004
Total 651475 61/38 64/34 58.5/40 62/37
Pop. Obama McCain Kerry Bush
Ramsey County 468147 66 31.5 63.5 35
Washington County 79263 47 51 44.5 55
Anoka County 104065 43 55 42 57

This is the district I gerrymandered the most as I wanted to pack as many Democrats into CD6 as possible.  The northern part of the district is represented by Anoka County exurbs that vote 2-1 GOP in some parts and the north third of Washington County which is exurban but not quite as Republican, maybe 60-40 at worst.  There really isn’t even much population up there as the main source is Ramsey county, which gets a little bit cut up.  The three blobs of gerrymander are as follows.  The main one is St. Paul, to the east, the district picks up the Republican precincts of Woodbury and then in the south it picks up Inver Grove Heights, a swingy suburb.  Safe for McCollum still.

MN-5 Rep. Ellison Pop. 2008 2008 2004 2004
Total 647577 69/29 74/24 65/33 71/28
Pop. Obama McCain Kerry Bush
Hennepin County 583048 71 27 67 31
Scott County 64259 48 50 42 57

As said previously, this district now picks up the south/southwest burbs in exchange for the very liberal first ring suburbs.  All the suburbs have been trending D quite rapidly and most voted for Obama.  The suburbs in Hennepin county, Edina, Eden Prairie, and Bloomington have trended pretty quickly while the two suburbs in Scott County, Shakopee and Savage, were once brutally Republican but population growth has exploded here and has brought them to suburban voting trends instead of exurban voting trends.  This is still extremely safe for Ellison.

MN-6 OPEN Pop. 2008 2008 2004 2004
Total 648958 53/45 45/53 49.5/49.3 42/57
Pop. Obama McCain Kerry Bush
Washington County 181743 54 44 49.5 49.4
Dakota County 327677 52 45.5 49 50
Ramsey County 31744 59 39 57 42
Goodhue County 45839 48 50 47 51
Rice County 17381 55 43 53 45

This is where I began this project as the main goal was how to get rid of Bachmann and make a Dem district.  It starts up in Washington county, takes in the Dem areas like Oakdale and Stillwater, cuts into Ramsey county to take in Maplewood, and then includes most of Dakota county where the northern portion is heavily populated suburbs that have heavily trended Democratic (hold all but one state house seat, which we picked up in 06 but lost in 08) while the rest of the county is townships and Republicanism.  It takes in swing Goodhue county and blue Rice county, where the colleges of Carleton and St. Olaf rack up margins for the Dems.  (Not to be confused with the St. Olaf Rose from Golden Girls is from, there is a St. Olaf township up north in Otter Tail county.)

Bachmann may no longer live in this district as I may have put her in CD4.  I know she recently moved to Woodbury, which is the city I gerrymandered.  So not sure which part of Woodbury carries that witch but regardless, she wouldn’t be a viable candidate in either CD.  I figure her and Kline could have an excellent face off in CD2 in an endorsement and primary.  Both have large constituencies in that district, almost 50/50, with maybe a slight edge to Bachmann in amount of former district.  So I’d consider this an open seat and it is a total swing district so it could go either Democrat or Republican, with the Dems being a slight favorite, especially in 2012 if Obama can manage another 8% win here.

I first had this district extremely gerrymandered to take in more Democrats but I decided to strengthen the Dems in CD3 in exchange for this CD as there is no way Bachmann can win this district, regardless. Here is a map of what I had before.

MN-7 Rep. Peterson Pop. 2008 2008 2004 2004
Total 648519 47/50 47/50 43/55.5 43/55.4
Pop. Obama McCain Kerry Bush
Kittson County 4505 58 40 50 49
Traverse County 3712 51 46 48 50
Stevens County 9624 49 48 47 51
Swift County 11192 55 42 55 43
Todd County 24029 43 54 41 57
Yellow Medicine County 10000 51 46 49 50
Lake of the Woods County 4095 42 60 38 60
Marshall County 9618 49 48 42 57
Becker County 31964 45 52 40 58
Polk County 30708 51 47 43 56
Pope County 11065 51 47 49 49
Clearwater County 8245 44 54 43 56
Red Lake County 4118 51 45 44 54
Mahnomen County 5129 61 36 53 45
Pennington County 13756 50 48 44 54
Clay County 54835 57 41 47 52
Otter Tail County 57031 42 55 37 61
Douglas County 36075 44 54 44 54
Grant County 6021 51 46 49 50
Big Stone County 5385 52 46 50 48
Lac qui Parle County 7258 52 46 53 46
Renville County 16132 48 49 45 53
Lyon County 24695 48 50 42 57
Beltrami County 43609 54 44 50 48
Roseau County 15946 40 58 31 68
Chippewa County 12465 52 46 52 47
Wilkin County 6418 45 52 33 65
Sibley County 15007 45 52 39 59
McLeod County 37220 38 58 37 62
Meeker County 23211 43 54 43 56
Kandiyohi County 40784 46 52 44 55
Norman County 6685 62 35 47 51
Hubbard County 18376 42 56 42 57
Wadena County 13382 40 58 39 59
Le Seur County 28034 47 51 45 54
Stearns County 7785 36 62 35.5 63

I left CD7 pretty much alone.  It’s GOP leaning and always will be, but the DFL is still quite powerful in most of the areas at the local level and it currently has a DFL incumbent, whose got a good decade if not more left until we should expect retirement.  

MN-8 Rep. Oberstar Pop. 2008 2008 2004 2004
Total 649780 54/44 53/45 53/45 53/46
Pop. Obama McCain Kerry Bush
Cook County 5398 60 37 53 45
Lake County 10741 60 38 60 39
St. Louis County 200528 65 33 65 34
Carlton County 33893 62 35 63 36
Pine County 228164 49 48 50 49
Koochiching County 13459 54 44 50 48
Itasca County 44542 55 42 55 44
Cass County 28723 45 53 43 56
Crow Wing County 61648 45 53 42 57
Morrison County 32733 39 58 41 58
Mille Lacs County 26354 45 52 43 55
Kanabec County 16090 44 53 44 55
Aitkin County 15910 48.7 48.8 48 51
Chisago County 50128 44 54 43 56
Benton County 33623 45 52 45 53
Stearns County 51680 53 45 51 48

My biggest question was, what should I do with St. Cloud?  It’s literally in the middle of extremely conservative Stearns, Benton, and Sherburne counties, it’s Dem but the vote margin is only 2,000, thus not making it worth much in votes considering the county I’d have to attach with it.  Benton county provided the smallest GOP margin and CD8 always goes Dem if by a smallish margin at the presidential, so I decided to include it here.  By adding this and eliminating Isanti county, it does get a nice Dem bump. Oberstar is safe until retirement and then it will still be safe DFL when open.

IA HD 90: Gay marriage will be issue in special election

Iowans in House district 90 will elect a new state representative in a special election on September 1, and the Republican candidate appears to be planning to make same-sex marriage a major campaign issue.

The seat opened up when State Representative John Whitaker, a Democrat, accepted a position with the U.S. Department of Agriculture. Republicans didn’t even run a candidate against Whitaker in 2008, but Iowa House district 90 has been competitive in the recent past. The southeastern Iowa district contains all of Van Buren County and parts of Wapello and Jefferson counties, including the Fairfield area (home to Maharishi University and the so-called “Silicorn Valley”).

The Democratic candidate for the special election is Curt Hanson, a retired driver’s education teacher who has won various teaching awards. Hanson plans to campaign on bread-and-butter issues: jobs, health care, education, and balancing the budget.

The Republican candidate is Jefferson County supervisor Steve Burgmeier. His name rang a bell for me because the Jefferson County supervisors made a show of posturing against same-sex marriage on April 27, the day the Iowa Supreme Court’s Varnum v Brien ruling went into effect. Burgmeier and his colleagues passed a resolution calling on Iowa legislators to take a stand against same-sex marriage. Since the Iowa Legislature had just adjourned for the year on April 26, the resolution served no purpose other than to put Burgmeier and on record loudly opposing marriage equality. He was probably planning to run for the legislature even before Whitaker’s seat opened up; a Republican Bleeding Heartland commenter had been recruiting Burgmeier to run next year in Iowa Senate district 45 (one of the GOP’s better pickup opportunities in the upper chamber).

Burgmeier’s press release announcing his candidacy for Iowa House district 90 highlighted two issues: cutting government spending and giving Iowans “a right to vote on the definition of marriage.” This is the new politically-correct Republican messaging. Instead of acknowledging that they want to write discrimination into the Iowa Constitution, Republicans say, “Iowans deserve the right to vote” on a marriage amendment, as if we were in the habit of subjecting minority rights to a majority vote in this country.

Republicans would like to win this special election for many reasons, not least to fire up their base about the potential to demagogue against committed same-sex Iowa couples next year. Democrats hold a 56-44 majority in the Iowa House. House Speaker Pat Murphy strongly supported the Varnum v Brien ruling and has made clear he will block efforts to bring a marriage amendment to the House floor.

You can donate to Curt Hanson’s campaign by clicking here. A strong volunteer effort will be crucial in this low-turnout special election, so if you live within striking distance of southeast Iowa, please consider volunteering for Hanson’s campaign before September 1.

SSP Daily Digest: 7/24

FL-Sen: Another sign that the wheels are falling off the Marco Rubio bus: he’s cutting back on senior staff. His campaign manager, Brian Seitchik, will be off the payroll next week, and his fundraiser, Ann Herberger, is also gone. About the changes, Rubio said, “This is not a purge or anything, quite the contrary.” In other words, they’re probably out of money.

NH-Sen: Ovide Lamontagne picked up a key backer, as the conservative base continues to look for an alternative to the may-be-a-RINO Kelly Ayotte. Former State Rep. Maureen Mooney, who was John McCain’s liaision to NH conservatives during the 2008 primary campaign, has said she’s backing Lamontagne, saying he’s a “principled and experienced conservative.”

SC-Sen, SC-01: Interesting rumblings out of the Palmetto State: now that Jim DeMint has turned himself into Public Enemy #1 in the last few weeks, all of a sudden people sound interested in challenging him. State Senator Brad Hutto was in Washington meeting with the DSCC about the race; Hutto has been looking for a chance to move up, starting with the 2010 governor’s race, but deferred to friend and state Sen. Vincent Shaheen on that one. Attorney Ashley Cooper (a former Fritz Hollings aide) is reportedly also interested in taking on DeMint, or also in running in the 1st, where Rep. Henry Brown barely won last year.

NC-Gov: Civitas, a local Republican pollster, stops to gawk at the Bev Perdue trainwreck, finding that her approval is at 30/44 and that right now only 26% would vote to re-elect her. They also look all the way ahead to 2012 and find that Republican Charlotte mayor Pat McCrory would win a rematch, 46-32.

MN-06: Independence Party 2008 candidate Bob Anderson, whose 10% of the vote may have tipped the balance to Rep. Michele Bachmann last year, says that he may make another run in 2010. (Don’t forget that while Elwyn Tinklenberg received the IP’s endorsment in 2008, Minnesota doesn’t allow fusion voting with candidates running on multiple ballot lines, so Anderson went ahead and ran in the primary, winning it and getting the IP nod for the general. Our best hope here may be for Minnesota to follow Oregon’s recent lead and legalize fusion voting.)

NY-23: In the 23rd, with Darrel Aubertine out (and New York Senate fans heaving a sigh of relief), the Dems still seem to be casting about for a replacement. Yesterday evening was the extended deadline for receiving applications, and some of the remaining serious contenders still haven’t applied. Dan French, a lawyer and former Daniel Moynihan aide, and former NY-23 candidate Robert Johnson seemed to have not been planning to run (but contingent on Aubertine running), and said yesterday that they were interested but would have to have the requisite talk with their families first. (So do the Dems extend the deadline again? That remains to be seen.) 2008 candidate Michael Oot has already submitted his application, though. Another name for the Conservative Party nom has surfaced: “locally famous” conservative activist Jon Alvarez, who is currently serving in Iraq.

The meaning, importance of Blue Dogs (and how to get rid of them)

I, personally, am on the left wing of the Democratic party.  On that political compass thing, I get about – 9 on social and – 8 on economic issues.  I like my rep (Nadler, NY-08) pretty well. But NY-08 is not the country.  And, although I wish I lived in a country where Nadler was a typical representative, and Sanders a typical Senator, I don’t.

In this diary, I will attempt to use data and analysis to answer several questions.  Using data and analysis is what I do for a living (I’m a statistician) and I find it fun (I’m a geek).  The questions:

Who are the Blue Dogs?

Why are they Blue Dogs?

Should we get rid of Blue Dogs and if so, Which ones? and How?

Are Blue Dogs as bad as Republicans?

more below the fold

Who are Blue Dogs?


There seem to be two common uses of the term.  One is for a group of self-identified members of congress – Democrats in the House who have centrist voting patterns.  But not all these people are the most conservative Democrats, and some very conservative House Dems are not self-identified.  Another use is for any conservative Democrat, especially in the House.  I’m going to use this second definition. So, who are they?

First, we need some measure of conservatism vs. liberalism.  There are several possibilities, but one I like a lot is the scale developed by Keith Poole and his colleagues called optimal classification, and available at VoteView.  I gave more details on this, and why I like it, in this diary.  Next, we need to decide how conservative a person has to be to be a  Blue Dog.  Any decision is arbitrary, so, let’s look at the 50 most conservative Democrats in the 110th House. (The list is below, in the table).

Why are they Blue Dogs?

I think the positions a representative takes are going to be some mix of his or her own views and his or her perceptions of what voters want.  I’m not sure how this mix is balanced, and it probably varies from person to person.  Certainly there is some overlap.  But people who are way out of step with their district are likely to face strong challenges, and may lose.

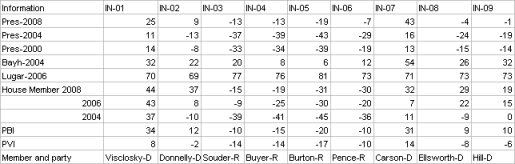
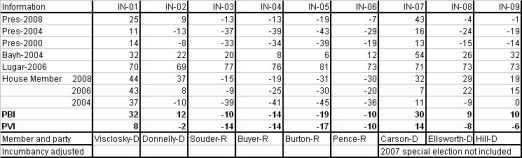
So, people are Blue Dogs from a combination of their own views and their constituents.  We don’t have good ways of looking at the representatives’ own views, but we do have some for constituents.  One good look is how they vote for POTUS.  The nice thing about this is that it doesn’t depend on polls, it isn’t issue by issue specific, and it’s easily available.  I’ll look at Obama % and Kerry %.

If a representatives votes (represented by VoteView rank) are out of line with the constituents’ views (represented by the Cook number), then it’s likely that those views are personal; and those are districts where challenges are more likely to succeed.  If the rep’s views are too conservative, they may get replaced by a Republican; if too liberal, they may get replaced by a more progressive Democrat.

Should we get rid of Blue Dogs; which ones?  

Clearly, if we can replace a BD with a progressive, we should.  But BDs are better than Repubs (see below).  One way to judge the likelihood of this is by the POTUS vote; a district that went for Obama may be ready for a progressive.

So, let’s look at some data:


Rep and district       Rank     Obama %       Kerry %   Notes

Lampson   TX-22         1       41              36      Now R

Cazayoux  LA-06         2       41              40      Now R

Childers  MS-01         3       37              37

Barrow    GA-12         4       36              34      

Marshall  GA-08         5       43              39

Altmire   PA-04         6       44              45

Donnelly  IN-02         7       54              43      

Carney    PA-10         8       45              40

Ellsworth IN-08         9       47              38

Shuler    NC-11        10       47              43

Giffords  AZ-08        11       46              47

Mitchell  AZ-05        12       47              45

Hill      IN-09        13       48              40

Foster    IL-14        14       55              44     Native son O

Matheson  UT-02        15       40              31

Bean      IL-08        16       56              44     Native son O

Boren     OK-02        17       35              41

Gillibran NY-20        18       51              46     Murphy (D)    

McIntyre  NC-07        19       47              44

Mahoney   FL-16        20       47              43     Now R        

Davis     TN-04        21       34              41

Tanner    TN-08        22       43              47

Taylor    MS-04        23       32              31

Melancon  LA-03        24       37              41

Space     OH-18        25       45              43          

Cuellar   TX-28        26       56              46     Native son B

Herseth   SD-AL        27       45              38

Peterson  MN-07        28       47              43

Ross      AR-04        29       39              48

Boyda     KS-02        30       43              40     Now R

Chandler  KY-06        31       43              41

Cramer    AL-05        32       38              41     Griffith (D)    

Gordon    TN-06        33       37              40

Skelton   MO-04        34       38              35

Salazar   CO-03        35       48              44

Wilson    OH-06        36       48              49

Boyd      FL-02        37       45              46

Perlmutt  CO-07        38       59              51      Primary!

Klein     FL-22        39       52              53      Primary?

Costa     CA-20        40       60              51      Primary!

Cardoza   CA-18        41       59              49      Primary!

Edwards   TX-17        42       32              30

Davis     AL-07        43       74              65      Retiring!

Spratt    SC-05        44       46              42

Cooper    TN-05        45       56              52      Primary!

Moore     KS-03        46       51              44

Pomeroy   ND-AL        47       45              36

Boswell   IA-03        48       53              48      

Holden    PA-17        49       48              42

Lipinski  IL-03        50       64              59      Primary?      

Native son O indicates that the vote for Obama in Illinois districts may not be indicative of a trend to Democrats; similarly, native son B indicates that TX districts may be less conservative than Bush’s numbers appear.

The two most conservative Democrats were replaced by Republicans.  And of the ten most conservative, only one district voted for Obama or for Kerry.

The most conservative representative to be replaced by a Democrat was Giilibrand, and Murphy’s election was, as you may recall, very close.

The most conservative Democrat whose district went for both Kerry and Obama is Perlmutter, in CO-07.  This looks like a primary possibility; especially since CO-07 gave Obama a considerable margin.  We also have Klein and Costa being too conservative for their districts.  Davis (AL-07) is way too conservative for his district, but he’s running for statewide office ….let’s get a real progressive in there, pronto!  Lipinski (IL-03) looks like a perfect person to primary, and we tried in 2008.

This list gives us 6 races to concentrate on; if we can replace those 6 with more progressive people, that would be excellent for us.  It is unlikely that any will be lost to the Repubs.

How should we get rid of Blue Dogs?

There are two ways, I think.  Above, I outlined a strategy for identifying BD who can be safely and sensibly primaried.  But that’s just one way to get rid of Blue Dogs.  The other way is to get on the ground and work to convince the people that liberal ideas are good.  Get them writing to their congress people.  Get them active!  While I found 6 people above who do not represent their constituents’ views; there are an unfortunate number who do represent their views, because there are too many conservatives in the USA.  It’s hard to convince a RWNJ that liberalism/progressivism is good.  But, people who are centrists are halfway there already.

This works two ways: First, if the BD hear from a lot of people, they might change their votes (it could happen!).  And, if they don’t change their votes? Well, elections come every two years.

Are Blue Dogs as bad as Republicans?

The short answer is “no”.

The slightly longer answer is to look at the Vote View methodology and notice that it perfectly separates the parties (this is usually not the case; prior to the 109th House, there was usually some overlap).

Another slightly longer answer is to say that the most conservative Democrat is somewhat similar to the most liberal Republican; but more similar to typical Democrats than to typical Republicans.

The really full answer is to look at individuals.  None of the Blue Dogs is anywhere near as bad as, say, Flake of AZ-06, or any of the other RWNJ.  A lot of votes in congress are lopsided; if a bill passes 400-20 then voting for it is not a big deal. In general, voting on close votes is more crucial.  In the 110th Congress, here is a list of votes with close margins.  But the list is mostly not too informative, as it doesn’t give much detail about the bills; still, we can probably assume that we would want people to take the Democratic position rather than the Republican one.

Let’s look at those 50 Blue Dogs again, and their votes on some close bills that were about policy and of general interest.

I’ve listed: Vote 189 on taxpayer assistance, which was tied (21 D in favor, 207 opposed; 3 R opposed, 189 in favor).

vote 316 which amended appropriations for Homeland Security; passed by 3 votes (209 D in favor, 16 opposed).  

vote 814 which was a broad appropriations bill, failed 212-216 (216  opposed, 14 in favor; R unanimous in favor).

vote 382 on the budget (passed 214-210, 214 D in favor, 14 opposed; R unanimous opposed)

and

vote 658 which is (I am pretty sure) the big Obama stimulus package (passed 213-208, 213 D in favor, 16 opposed)

A D indicates the person voted the way most of the Democrats voted; R Republican, and ? no data or not voting


Rep and district       189    316   814   382   658  

Lampson   TX-22          R     D     D     R     R

Cazayoux  LA-06          D     ?     ?     R     R

Childers  MS-01          ?     ?     ?     R     R

Barrow    GA-12          R     R     R     R     D

Marshall  GA-08          R     R     R     ?     D

Altmire   PA-04          R     R     R     D     D

Donnelly  IN-02          R     R     D     R     D

Carney    PA-10          R     D     R     D     D

Ellsworth IN-08          R     R     R     R     D

Shuler    NC-11          R     R     R     ?     R

Giffords  AZ-08          R     R     R     R     D

Mitchell  AZ-05          R     R     D     R     D

Hill      IN-09          R     D     R     R     R

Foster    IL-14          R     ?     ?     R     D

Matheson  UT-02          R     R     R     R     D

Bean      IL-08          R     R     R     ?     D

Boren     OK-02          R     R     R     R     D

Gillibran NY-20          R     D     D     D     R  

McIntyre  NC-07          R     D     R     D     D

Mahoney   FL-16          R     D     D     D     D

Davis     TN-04          D     D     D     D     D

Tanner    TN-08          D     R     D     D     R

Taylor    MS-04          D     D     R     D     R

Melancon  LA-03          D     D     D     D     D

Space     OH-18          R     R     D     D     D

Cuellar   TX-28          D     D     D     D     D

Herseth   SD-AL          D     D     D     D     R

Peterson  MN-07          D     D     D     D     D  

Ross      AR-04          D     D     D     D     D  

Boyda     KS-02          D     D     D     D     D

Chandler  KY-06          R     D     D     D     D  

Cramer    AL-05          D     R     D     D     D

Gordon    TN-06          D     D     D     D     D

Skelton   MO-04          D     D     D     D     D

Salazar   CO-03          D     D     D     D     D

Wilson    OH-06          D     D     D     D     D

Boyd      FL-02          D     D     D     D     R

Perlmutt  CO-07          D     D     D     D     D

Klein     FL-22          D     D     D     D     D

Costa     CA-20          D     D     D     D     ?

Cardoza   CA-18          D     D     D     D     D

Edwards   TX-17          D     D     D     D     D

Davis     AL-07          D     D     D     D     D

Spratt    SC-05          D     D     D     D     D

Cooper    TN-05          D     D     D     D     R

Moore     KS-03          D     D     D     D     D

Pomeroy   ND-AL          D     D     D     D     D

Boswell   IA-03          D     R     D     D     D

Holden    PA-17          D     D     D     D     D

Lipinski  IL-03          D     D     D     D     D

That is, of the 50 most conservative Democrats, every one voted with the Democrats on at least one of these 5 close and key votes.

If even a large handful of these Democrats were replaced by Republicans, some of those bills would have failed.