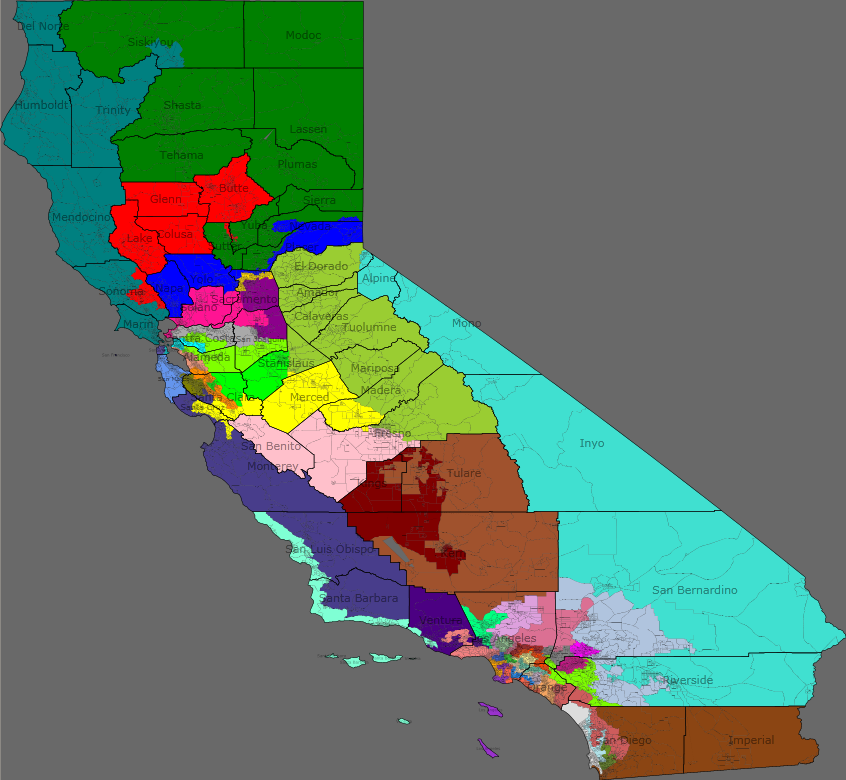
I attempted to create a map of California that benefits Democrats and yet does not involve extreme gerrymandering. This is the result, with which I am quite pleased. Very few of the districts are overt gerrymanders, and for the most part the uglier ones are to meet Voting Rights Act requirements. In the end, I successfully packed most of the Republicans into 5 very solidly Republican districts, freeing up room for 47 districts that should reliably go Democratic barring extenuating circumstances and 1 swing district. The districts are generally organized from north to south, but I will still note the colors of the districts for ease. I will also note races and ethnicities that exist above 5% of the district population (“Hispanic” will be considered separate from the other races). Each district’s population deviates less than 0.1% from the ideal population, and can easily be smoothed out even more if the confines of block groups were removed. I may have made slight tweaks to some of the districts, but unless noted, the population percentages change by 2% at most.
California at large
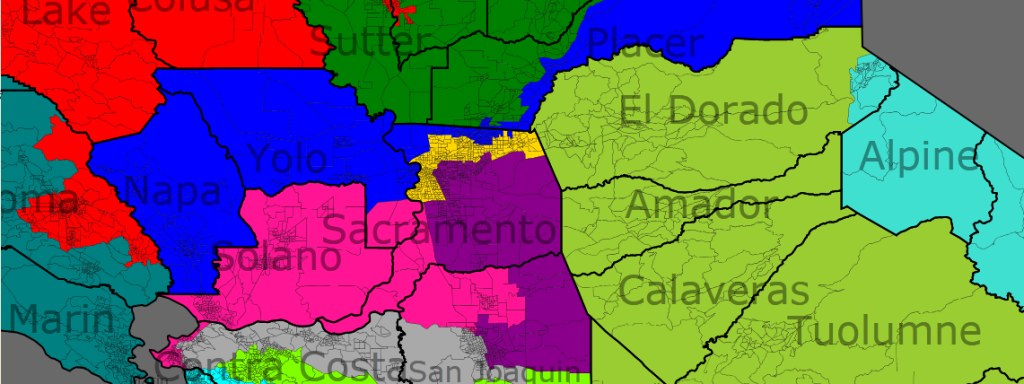
Sacramento Valley
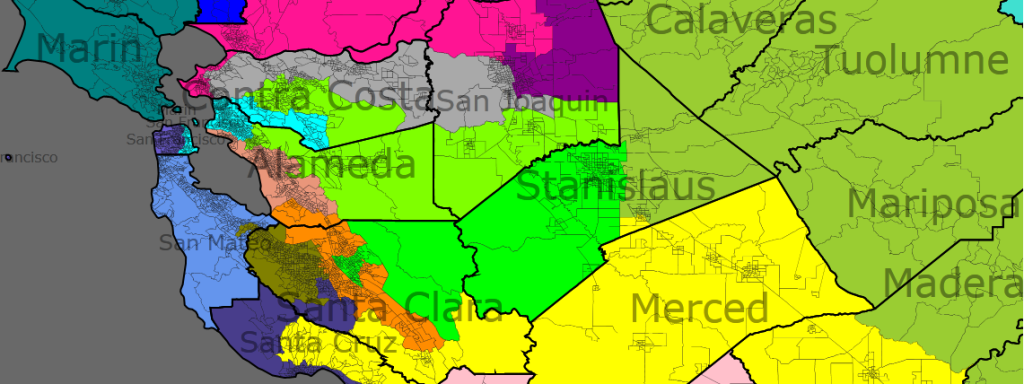
San Francisco Bay Area
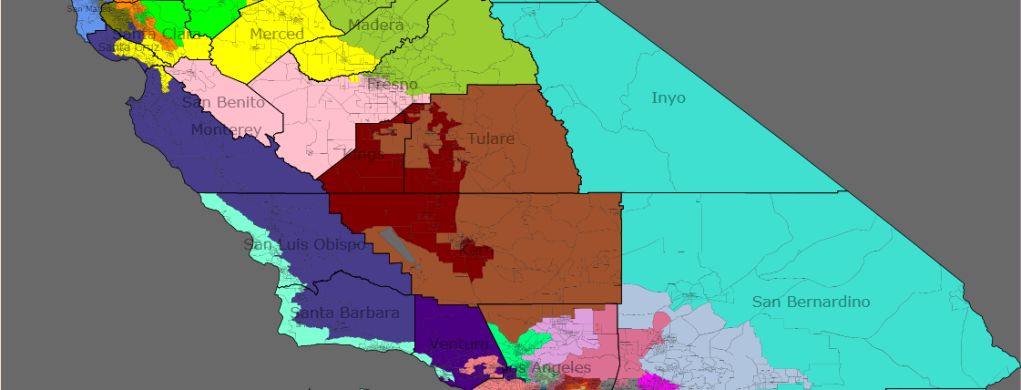
Central Valley
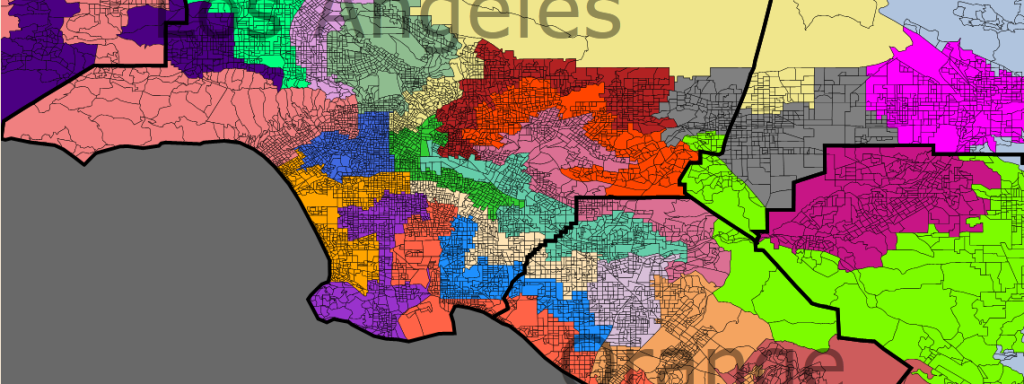
Urban Los Angeles (the districts in the southeast, at the Orange County border, look a little different because I made some tweaks and didn’t feel like making the other maps over again; the districts shown in this map are the ones I discuss)
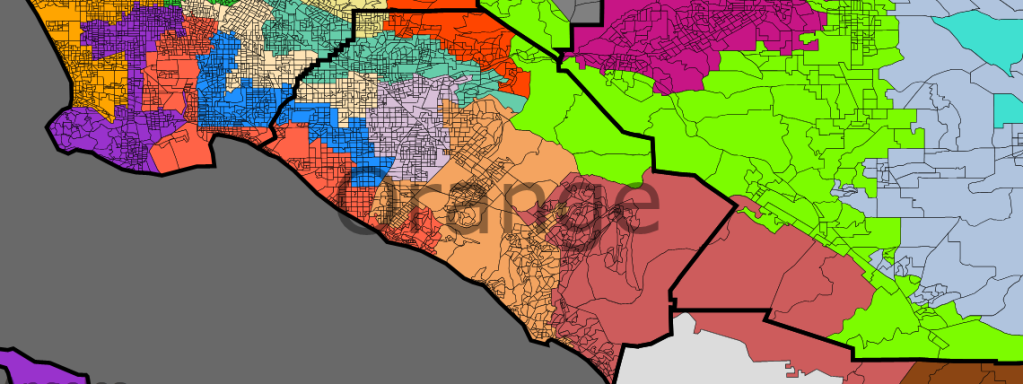
Orange County
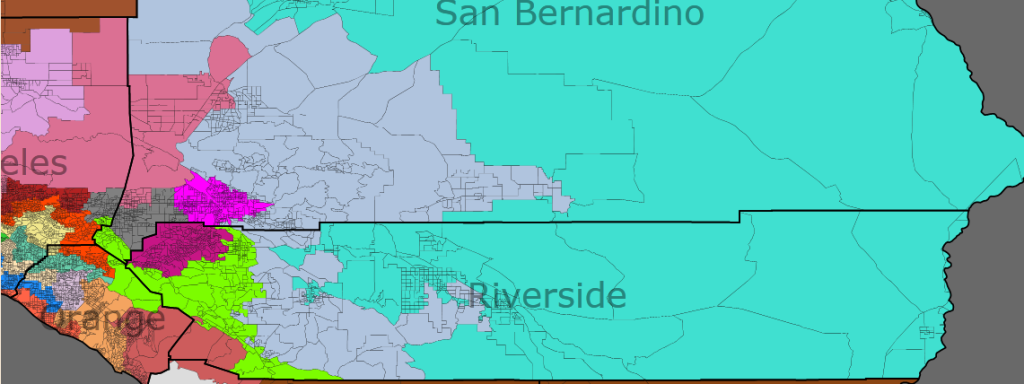
Inland Empire
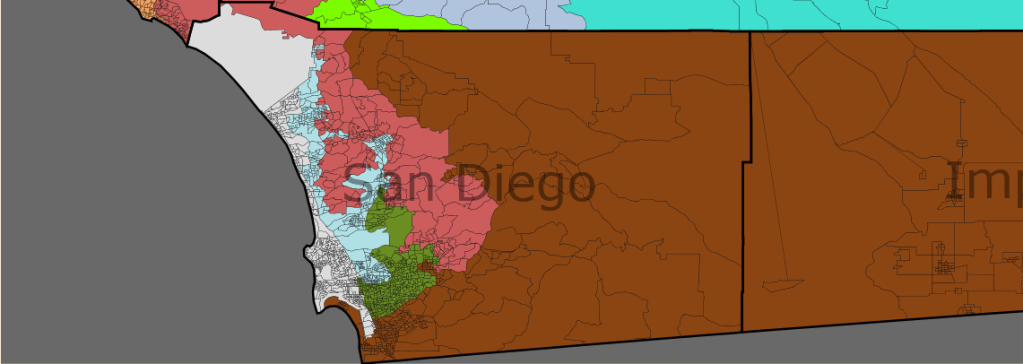
San Diego
District 1 (blue)
Incumbent: Mike Thompson (D)
65% white, 7% Asian, 20% Hispanic
This is the only district in northern California that is overtly gerrymandered, but the small strip running through Sacramento and Placer Counties can easily be widened. Napa and Yolo Counties, which are in the current 1st district, account for about 45% of the new district, and Thompson should also be comfortable with the parts of Nevada County in the new district; the cities of Truckee and Nevada City are very liberal, and Grass Valley is a swingish place. The Placer County area shouldn’t be too conservative, since it includes the minority-rich parts of Roseville and all of Auburn and the Lake Tahoe area in the east. This gives the district the chance to neutralize conservative Citrus Heights in Sacramento County.
District 2 (green)
Incumbent: None
77% white, 11% Hispanic
Technically, this district has no incumbent, because Wally Herger (R), who represents much of the current district, lives in Chico. However, he will probably choose to run in this dark-red district, which includes Redding, lumber country in the north, and conservative Sacramento suburbs. He may face some primary competition from Tom McClintock of the 4th district, who represents the Sacramento suburbs and ran his first race for that district from Ventura County.
District 3 (purple)
Incumbent: Dan Lungren (R), Tom McClintock (R)
43% white, 9% black, 16% Asian, 26% Hispanic
This district becomes much more diverse and Democratic. It drops many conservative parts in northwestern Sacramento County and its two counties in the Sierras, Amador and Calaveras, in exchange for minority portions of Elk Grove and Sacramento that are currently packed into the 5th district and heavily Hispanic parts of Stockton. Obama should have won this district comfortably in 2008, and considering Lungren only won by 5% against Bill Durston that year, he should certainly lose here.
District 4 (red)
Incumbent: Wally Herger (R)
67% white, 22% Hispanic
The 4th district is effectively eliminated and replaced here, sharing only a small portion of Butte County and based in the northern exurban parts of the San Francisco Bay Area. It covers Santa Rosa in Sonoma County, and the extremely strongly Democratic town of Sebastopol. Although the Sonoma County part is only about 35% of the district, it is fiercely partisan, voting for Obama with about 75% of the vote, while the rest of the district is almost exactly even, and whichever Democrat decides to run here should win easily.
District 5 (yellow)
Incumbent: Doris Matsui (D)
48% white, 11% black, 14% Asian, 21% Hispanic
All of Sacramento is no longer packed into this district, and it recedes entirely from Elk Grove. Instead, it marches east all the way to Folsom, picking up some very conservative territory along the way. Overall, Obama should still have received over 60% of the vote here, and if Matsui is unhappy with it, it can be expanded southward a little bit. A healthy minority population should forestall that, though.
District 6 (teal)
Incumbent: Lynn Woolsey (D)
74% white, 15% Hispanic
Woolsey’s district loses most of Sonoma County in exchange for less-progressive areas in the north, but in California, “less progressive” means Obama won with about 65% of the vote. It eats into a small liberal edge of Siskiyou County, probably ski resorts. In general, it takes Lynn Woolsey’s home city of Petaluma and various “conservative” areas in Sonoma County, which amounts to voting for Obama with about 70%. In theory, this district could be extended further into the mountains and free up more of Sonoma County for the 4th district, but that would look kind of bad.
District 7 (gray)
Incumbent: George Miller (D)
41% white, 9% black, 14% Asian, 29% Hispanic
The 7th district drops Richmond and San Pablo, two very progressive cities by the bay, and gains the parts of Stockton that aren’t in the 3rd district. This causes a large drop in the black population, but a corresponding gain in the Hispanic population. Even with the addition of very rich areas in interior Contra Costa County, George Miller should be very comfortable in this strongly liberal district.
District 8 (periwinkle)
Incumbent: Nancy Pelosi (D)
48% white, 30% Asian, 14% Hispanic
Nancy Pelosi is living proof that Democrats should elect their leaders from safe districts; Tom Foley lost in 1994, Tom Daschle lost in 2004, Harry Reid is in serious danger in 2010. But Nancy Pelosi is probably safe even if God is proven to be real. This district keeps her residence in the Pacific Heights neighborhood, but shifts west, probably losing a few points of Democratic performance, but nothing to worry about at all. The westward move subtly benefits Democrats from the Central Valley, as will be revealed in a while.
District 9 (light blue)
Incumbent: Barbara Lee (D)
39% white, 17% black, 23% Asian, 16% Hispanic
The 9th district now skips across the Bay Bridge into San Francisco and takes whatever is not occupied by Nancy Pelosi. It absorbs Berkeley and most of Oakland, but no longer all of it, and it fills in the rest of its population requirements with filthy rich cities in central Contra Costa County, inhabited by voters who tend to be socially liberal but fiscally moderate. The 11th district is sucked into eastern Oakland and becomes safely Democratic as a result of this, and that reverberates through the rest of the Central Valley. The drop in the black population is unfortunate, though; to fix that, the 9th can give Berkeley to the 11th in exchange for the rest of Oakland, but that makes the lines messier.
District 10 (pink)
Incumbent: John Garamendi (D)
39% white, 15% black, 13% Asian, 27% Hispanic
Garamendi’s district is substantially reconfigured to meet his needs, since the current version of the district was drawn for Ellen Tauscher, who resigned to work in the State Department. All of Solano County is present, constituting a majority of the district’s population. The parts in the Central Valley contain Garamendi’s home in Sacramento County and the very conservative city of Lodi in San Joaquin County. The tendril to the west counterbalances Lodi’s influence with San Pablo and Richmond, which are like mini-Oaklands in both ethnic composition and political leanings.
District 11 (yellow-green)
Incumbent: Jerry McNerney (D)
58% white, 8% black, 10% Asian, 20% Hispanic
The new 11th district is more compact and much more Democratic than the current district, and can be viewed as having three prongs. The prong in San Joaquin County covers Republican-tilting Manteca, fast-growing suburban city Tracy, and some deep red regions in the east. The Contra Costa wing drops Danville and San Ramon and instead picks up parts of Concord, Walnut Creek, and Lafayette. However, the Alameda wing is the most important part; it includes Pleasanton, McNerney’s home, and about a fifth of Oakland, responsible for the strong progressiveness of this district.
District 12 (pastel blue)
Incumbent: Jackie Speier (D)
44% white, 25% Asian, 23% Hispanic
The new 12th district is probably one of the cleanest and most logical in the nation. It takes in all of suburban and wealthy San Mateo County except Atherton, where Anna Eshoo lives, and a section of Menlo Park. It might be possible by combining certain parts of San Francisco with northern San Mateo County to make an Asian-plurality district, but there isn’t much reason for doing so.
District 13 (tan)
Incumbent: Pete Stark (D)
34% white, 6% black, 31% Asian, 23% Hispanic
The composition of this district doesn’t change significantly; it just moves north a little as Barbara Lee’s San Francisco addition sucks it in. It maintains most of Fremont, all of Hayward, and the city of Alameda. A few more adjustments can easily makes this district Asian-plurality, but that wouldn’t really affect anything. Pete Stark is one of my personal favorite representatives, as the only openly atheist (imagine a country where “openly atheist” is more damning than “openly gay”) congressman.
District 14 (olive)
Incumbent: Anna Eshoo (D)
50% white, 31% Asian, 13% Hispanic
Anna Eshoo may want to swap a few tentacles of territory with Jackie Speier, since her base is in San Mateo County, but from an interparty standpoint, Eshoo is in no danger. This new district adds the city of Santa Clara and more of San Jose to become the “Silicon Valley district”. Relatively conservative (relative to the rest of Santa Clara County) Saratoga and Monte Sereno are also included.
District 15 (orange)
Incumbent: Mike Honda (D)
34% white, 34% Asian, 25% Hispanic
This district is one of two newly Asian-plurality districts, along with the 32nd. Although 12% of California’s population is Asian, suggesting about 5 majority Asian districts, it is actually nigh impossible to create even one majority Asian district without drawing lines that are absurd and would be shot down in court because the Asian population is so thoroughly distributed throughout the coastal areas. The southern tendril now contains Morgan Hill instead of Gilroy.
District 16 (bright green)
Incumbent: Zoe Lofgren (D)
30% white, 16% Asian, 46% Hispanic
Instead of being entirely confined to Santa Clara County and wasting precious votes, this district now takes in a generally swing part of Stanislaus County. However, the Hispanic part of San Jose occupies 45% of the population, ensuring that the new 16th is still safe for Democrats. There is a very strong chance that Lofgren will be replaced by a Hispanic representative when she retires.
District 17 (indigo)
Incumbent: Sam Farr (D)
58% white, 6% Asian, 28% Hispanic
The general shape of the new 17th district was inspired by Abel Maldonado (R)’s State Senate district, but made more Democratic. Starting from downtown San Jose, it tracks toward coastal Santa Cruz and Monterey Counties, picking up very white, very progressive, very high-turnout areas around Monterey Bay. In the south, it takes in Republican parts of inland San Luis Obispo and Santa Barbara Counties. Paso Robles, Atascadero, Orcutt, and part of Lompoc are neutralized, allowing the 22nd district to soak up more Republicans elsewhere and the 24th to transform into a Democratic stronghold.
District 18 (bright yellow)
Incumbent: Dennis Cardoza (D)
33% white, 56% Hispanic
More Hispanics are shoveled into the 18th, mostly from Watsonville and Salinas, both strongly Democratic cities. It no longer goes through Stockton and Modesto, but expands in Madera County and occupies the Hispanic areas of Turlock. It would not be a surprise if Obama won within the high 60s in this district, and Dennis Cardoza either needs to vote more liberally, or fall to a primary challenge. In a stroke of irony, the 18th now, like the 17th, resembles a Democratic-leaning State Senate district occupied by a Republican.
District 19 (dull green)
Incumbent: George Radanovich (R)
73% white, 16% Hispanic
George Radanovich’s current district, which Obama lost by only 6%, has far too many wasted Democratic votes; in fact, Obama won the Fresno County portion. The new form stacks up all the toxic territory that can’t be effectively cleaned up by the Bay Area. It recedes a bit from Stanislaus County, adds Clovis and white areas in Fresno, and takes Sacramento exurbs in El Dorado County, while staying out of Democratic South Lake Tahoe.
District 20 (light pink)
Incumbent: Jim Costa (D)
24% white, 5% black, 8% Asian, 59% Hispanic
Kings County and Bakersfield are dumped in favor of more of Fresno County and all of San Benito County. There is not really a net difference in Democratic performance, and Jim Costa is safe for as long as he wants to be. However, this district can easily be made more Democratic by trading more white parts of Fresno to the slightly packed 18th in exchange for Salinas. However, it seems more logical to pack the 18th to force Cardoza left, and Costa is safe anyways. If Watsonville, Gilroy, and Salinas are divided among two districts, they will shift the districts left, but not enough to put either Cardoza or Costa in danger of a primary.
District 21 (dark red)
Incumbent: Devin Nunes (R)
18% white, 5% black, 70% Hispanic
There are just enough Democratic votes left in the Central Valley to support an additional Democratic district. The demographics are a little deceptive, since many of the Hispanics do not vote, and those who do tend to tilt socially conservative, but Devin Nunes, whose home in Tulare is probably in this district, will probably be turned out of office nevertheless. The shape of the district is a bit ragged, but should be protected by the Voting Rights Act, since the Hispanic population growth should demand an additional district. A few more Democratic votes can be milked out by spilling into inland Monterey County, if that is necessary.
District 22 (brown)
Incumbent: Kevin McCarthy (R)
59% white, 29% Hispanic
This is easily the most conservative congressional district in California, which is surprising given its large Hispanic population, evidencing just how few of those Hispanics actually vote. It fits around the 21st district in Kings, Tulare, and Kern Counties, and includes a few sparsely populated areas of Los Angeles County for population purposes. The spike into inland San Luis Obispo County is unnecessary now, since the 17th district has it covered. The Los Angeles County parts can be removed and replicated in San Bernardino County, where they matter a tiny bit more, but it’s only 11 000 people anyways, and it would look worse.
District 23 (light blue)
Incumbent: Lois Capps (D)
46% white, 5% Asian, 44% Hispanic
This sliver along the coastline fattens slightly in Santa Barbara and San Luis Obispo Counties, but still keeps its general shape. It can be thickened considerably more without any real difference in composition if block groups could be split in the application, since it borders some very sparsely populated areas covered by very large block groups. The district still goes into Oxnard, to make sure it is stable; there isn’t a better place to put those Democratic votes anyways, since the rest of Ventura County can be mixed and matched with very liberal West Los Angeles. It becomes a tad more Hispanic, but not enough to form a plurality.
District 24 (dark purple)
Incumbent: None
57% white, 7% Asian, 30% Hispanic
Although the new 24th district maintains most of Elton Gallegly’s territory, there are some major differences. Republican Simi Valley is clipped out, removing Gallegly’s home in the process, and the ultra-conservative parts of inland Santa Barbara County, like Orcutt, are neutralized by the 17th district. To make up for the lost population, 40% of the district spills into Los Angeles County, which sets its tone as a new Democratic stronghold.
District 25 (pastel pink)
Incumbent: None
25% white, 11% Asian, 60% Hispanic
The 25th district is eliminated and replaced in this district located in southeastern Los Angeles, cobbled together from various Hispanic areas left behind by the districts stretching into Orange County. The 25th itself snakes into Orange County, picking up most of Yorba Linda and Brea, both strongly conservative, and moderate La Habra. The very Hispanic parts of Los Angeles County, which make up over 70% of the district, compensate more than enough for the poisonous Orange County portion, though, and this district should be ready for a new Democratic congressman.
District 26 (dark gray)
Incumbent: David Dreier (R)
28% white, 7% black, 6% Asian, 56% Hispanic
Some conservative-leaning suburbs north of Los Angeles, such as Arcadia and Glendora, are removed, but San Dimas, where David Dreier lives, remains. The pink city of Chino is added, but more importantly, the 26th now pushes into Pomona and Fontana, and adds all of Ontario. This pushes it to majority Hispanic status. If it seems to need some reinforcement, it can swap Rancho Cucamonga with the 43rd district, which has a larger Hispanic majority and more blacks.
District 27 (aquamarine)
Incumbent: Brad Sherman (D), Buck McKeon (R)
45% white, 9% Asian, 39% Hispanic
Brad Sherman’s district adds Santa Clarita to the north and drops the appendage that stretches into Burbank. Almost 70% of the new district is Sherman’s old territory, and it takes a little from the even more Democratic 28th district, which should be more than enough to force Buck McKeon into retirement. The white population inches up a tad and the Hispanic population does not increase much, which is good, since Sherman seems to have an abnormal fear of being knocked off by a Hispanic candidate in a primary.
District 28 (lavender)
Incumbent: Howard Berman
34% white, 7% black, 5% Asian, 49% Hispanic
40% of this district is now Lancaster and Palmdale; the former tilts Republican but was won by Obama, whereas the latter tilts Democratic. Generally, the new northern portion is a wash. The southern portion, which contains most of Berman’s current territory, is ardently Democratic, though, and easily outweighs the north’s swingish tendencies. In fact, the new 28th district can swap some territory with the new 27th if Brad Sherman thinks he isn’t safe there.
District 29 (pastel green)
Incumbent: Adam Schiff (D)
47% white, 12% Asian, 34% Hispanic
The 29th district contracts into a round little thing and shifts substantially west, but, of course, remains as Democratic as one would expect for a district in the midst of the Los Angeles area. It now includes all of Glendale, Burbank, and La Canada Flintridge, and eats significantly into Los Angeles. It might gain a few points or lose a few points of Democratic performance, but either way, Schiff should be well-established here.
District 30 (pastel pink)
Incumbent: Henry Waxman (D), Elton Gallegly (R)
73% white, 9% Asian, 12% Hispanic
Henry Waxman’s district sneaks into Ventura County and snaps up Republican-leaning Simi Valley and about two-thirds of equally conservative Camarillo. Even though Gallegly lives here, he would certainly lose to even a boiled owl with a D after its name, so of course Waxman is safe… oh wait… Anyways, the rich progressive areas around Hollywood steel the 30th against any potential Republican incursions. Interestingly, the Ventura County portion is less white than the Los Angeles County portion; the whites around Hollywood are the kind who are among the most reliable and socially liberal in the nation.
District 31 (pastel yellow)
Incumbent: Xavier Becerra (D)
28% white, 7% black, 11% Asian, 50% Hispanic
This district is kind of like the old 25th district in how geographically misleading it is. It connects moderately conservative areas in San Bernardino County, like Victorville, Upland, and a slice of Rancho Cucamonga, to central Los Angeles, using the vast Angeles National Forest. It also includes the minority-heavy western half of Pasadena. The whites in this district are a bit more liberal than is typical, since many hail from Pasadena.
District 32 (red-orange)
Incumbent: Judy Chu (D), Gary Miller (R)
18% white, 44% Asian, 33% Hispanic
The 32nd district changes significantly to accommodate Judy Chu, perhaps becoming a little less Democratic, but also much more Asian. It takes Walnut from the 26th district and Gary Miller’s home city of Diamond Bar, both heavily Asian municipalities, and then meanders through a bunch of Asian neighborhoods toward Monterey Park. This is probably the only district outside of Hawaii that would consistently elect an Asian representative; most Asians have no problem voting for a white candidate where the white population is high, but here it gets forced down by the substantial Hispanic population, and the Hispanic population is not large enough to win against the Asian population.
District 33 (pastel blue)
Incumbent: Diane Watson (D)
15% white, 23% black, 13% Asian, 44% Hispanic
The 33rd district loses a white tentacle to the north and picks up some whites to the east, and does not change substantially. It’s actually kind of sad that so many Democrats are locked into this festering district in the heart of urban Los Angeles. Hispanic population growth reduces the relative number of blacks, but blacks should still be dominant, considering how few of the Hispanics actually vote.
District 34 (pastel green)
Incumbent: Lucille Roybal-Allard (D)
7% white, 5% black, 6% Asian, 79% Hispanic
The 34th district will probably continue to be the most Hispanic district in the nation. It could be a good idea to “eliminate” this district, split it up into 4-6 chunks, and give Roybal-Allard one of them, to distribute the votes more efficiently and make more Hispanic-majority districts, but it doesn’t particularly matter, since every one of the Los Angeles districts is safely Democratic.
District 35 (pastel purple)
Incumbent: Maxine Waters (D)
20% white, 20% black, 10% Asian, 47% Hispanic
By taking in the white and rather Republican Palos Verdes Peninsula, the 35th district preserves some semblance of African-American voting power against by keeping the Hispanic population from attaining a majority of the district’s total population. Still, Maxine Waters will very likely be replaced by a Hispanic representative when she retires, and it’s pretty much impossible to do anything about that. There once was a time when the black population constituted a greater percentage, but now it’s constantly dwindling.
District 36 (yellow-orange)
Incumbent: Jane Harman (D)
35% white, 18% black, 10% Asian, 33% Hispanic
Jane Harman’s recent voting record has shifted to the left, but she still has a lot of problems and scandals to deal with. This district should ensure that her shift to the left is not temporary. The northern part of Maxine Waters’s district, which was left behind so the 35th could absorb the Palos Verdes Peninsula, including the city of Inglewood and parts of interior Los Angeles, is added. The population should be white enough to maintain Harman in a primary if she continues to improve, but should her former centrism return, she’ll easily be knocked off by a progressive minority candidate, considering many of the whites are Republicans.
District 37 (light pastel blue)
Incumbent: Laura Richardson (D)
30% white, 8% black, 21% Asian, 36% Hispanic
This diverse district is cobbled together from most of Long Beach, all of Paramount for extra Democratic votes, and Westminster and Fountain Valley in Orange County. The Orange County cities have a large Asian population, but they’re largely Vietnamese and conservative. Hopefully Laura Richardson, who has attracted too much controversy for a nondescript heavily Democratic district in an urban area, will be primaried out.
District 38 (blue-green)
Incumbent: Grace Napolitano (D), Ed Royce (R)
29% white, 11% Asian, 55% Hispanic
Like many other districts, Grace Napolitano’s new 38th district combines a moderately conservative part of Orange County with a strongly Democratic and Hispanic part of Los Angeles County. Pico Rivera and Norwalk cause the Democratic percentage to shoot up, which overrides the pinkish regions of Orange County, including Fullerton, Placentia, and Buena Park. Ed Royce is inadvertently put into the district, but he will be flattened by Napolitano easily in this Hispanic-majority district.
District 39 (light tan-yellow)
Incumbent: Linda Sanchez (D)
25% white, 19% Asian, 48% Hispanic
Linda Sanchez’s new district is very similar to the 38th, except its Orange County parts are more Asian. It includes large Vietnamese communities in Garden Grove and takes a chunk of Anaheim. The 39th district needs to extend deeply into the heart of Los Angeles County because the border cities of Artesia, Lakewood, and Cerritos are not super-liberal. However, South Gate and the unincorporated region just south of Huntington Park are, and secure the district for Sanchez, who fortuitously is placed right next to her sister, Loretta.
District 40 (red-brown)
Incumbent: none
29% white, 10% Asian, 56% Hispanic
What is currently the 40th district, in Orange County, is completely dissected and relocated into central Los Angeles County. Its basic purpose is to contain all of the non-Asian areas north of Judy Chu’s 32nd district. Glendora, at the east end, is rich and Republican, but is far outweighed by Pasadena, Monrovia, Los Angeles, and the unincorporated region south of Los Angeles. If it needs to be made thicker, it can take a strip of Angeles National Forest during the actual mapping and add barely any people.
District 41 (pastel gray)
Incumbent: Jerry Lewis (R)
68% white, 22% Hispanic
The 41st district is the main sponge for Republican votes in the Inland Empire. It takes the white parts of Murrieta, Temecula, Redlands, Hemet, and San Jacinto, and all of Hesperia, Apple Valley, Yucaipa, Yucca Valley, Calimesa, and others. It also curves into Indian Wells, Rancho Mirage, La Quinta, and Palm Desert in the Coachella Valley. Its lines might seem awkward, but that’s partially because the block groups in San Bernardino and Riverside Counties tend to be quite large.
District 42 (lime green)
Incumbent: None
36% white, 9% black, 9% Asian, 41% Hispanic
The 42nd district is almost completely displaced, sharing only the city of Chino Hills and a small edge of Orange County with the current 42nd district. It contains all of Perris and Moreno Valley, which have surprisingly large black populations. It strikes through the minority-heavy blocks of Murrieta and Temecula, and then takes a small part of Yorba Linda in order to get to Los Angeles County. 60 000 people from Pomona strengthen Democrats further and is responsible for the Hispanic plurality.
District 43 (magenta)
Incumbent: Joe Baca (D)
20% white, 12% black, 5% Asian, 59% Hispanics
The 43rd district edges east into the Hispanic parts of Redlands, adding Highlands and dropping Ontario. Joe Baca remains perfectly safe here, and in fact this district is probably still quite stacked with Democratic votes. Baca can share the wealth with the 44th district if California politicians think that a Democrat would have a hard time getting elected there.
District 44 (dark magenta)
Incumbent: Ken Calvert (R)
36% white, 5% black, 7% Asian, 47% Hispanic
The population of the redistricted 44th district lies entirely within the current 44th district, a testament to the Inland Empire’s powerful growth. It includes all of the city of Riverside and most of Corona, where Ken Calvert lives. The slab of Orange County that is removed, including San Juan Capistrano and San Clemente, was responsible for keeping Calvert in Congress in 2008, so he will no doubt have significant problems surviving in the Democratic part of his district.
District 45 (turquoise)
Incumbent: Mary Bono Mack (R)
39% white, 50% Hispanic
The new incarnation of the 45th district may look absurd, stretching from the Inland Empire all the way to Lake Tahoe, but there actually is a strong community-of-interest argument for putting the resort areas in the same district. It may seem counterintuitive to cut Democratic Moreno Valley out of the district, but strongly conservative Murrieta is also removed. Only the minority parts of Hemet and San Jacinto remain, while Desert Hot Springs and minority parts of Banning and Beaumont are included. Due in part to natural growth, Hispanics attain a majority of the population.
District 46 (pastel orange red)
Incumbent: Dana Rohrabacher (R)
39% white, 12% black, 10% white, 35% Hispanic
Ironically, this district becomes more Democratic even while swapping swing city Costa Mesa for very Republican Newport Beach. It maintains all of Huntington Beach and Seal Beach (interestingly, Huntington Beach, which is largely white, recorded the most votes of any city in Orange County in 2008, even more than Anaheim, which is much more populous), and the strip across coastal Long Beach is widened. Instead of proceeding to the Palos Verdes Peninsula, though, the new 46th turns north and adds all of Compton, Carson, and Lynwood; Compton was the most Democratic city in California in 2008!
District 47 (light lavender)
Incumbent: Loretta Sanchez (D)
16% white, 12% Asian, 68% Hispanic
The 47th district expands to include all of Santa Ana, and flows toward Anaheim via Orange rather than via Garden Grove. That causes a slight decrease in the Asian population and a corresponding increase in the Hispanic population. This district may not seem especially stable, considering the capricious turnout of the Latino base, but it should gradually become more and more Democratic as Hispanic participation in the political process increases.
District 48 (pastel orange)
Incumbent: John Campbell (R)
58% white, 15% Asian, 22% Hispanic
John Campbell’s district is probably the most swingish of all the new districts. Obama’s performance edges up several points with the removal of Newport Beach and most of Lake Forest, replaced by Costa Mesa and a slice of Orange. With Irvine’s abrupt shift leftward and the Laguna region’s social liberalism, John Campbell’s days in Congress are probably numbered. If a candidate about as strong as Beth Krom were to run in 2012, with Obama’s coattails, Campbell would probably lose.
District 49 (pastel red-brown)
Incumbent: Darrell Issa (R), Brian Bilbray (R), Duncan Hunter (R)
74% white, 6% Asian, 15% Hispanic
The Republican primary in this ultra-conservative, ultra-Republican district should be very interesting to watch, as each candidate tries to appeal to the Orange County part as the tiebreaker. Darrell Issa’s base is the northern part of the district within San Diego, Brian Bilbray’s the left leg, and Duncan Hunter’s the right leg. Issa probably has the upper hand in the Orange County area, since he represents Riverside County adjacent to it, but he also has the smallest preexisting base.
District 50 (metallic blue)
Incumbent: None
49% white, 13% Asian, 30% Hispanic
This is one of the few districts that is very oddly shaped. Anchored in San Diego, it drifts north on two legs, picking up the parts of the coastal cities that are not included in the 53rd district and the minority parts of Vista and Escondido. It can dive further into San Diego if it is seen as necessary, but it has already dropped loads of conservative territory.
District 51 (dark brown)
Incumbent: Bob Filner (D)
33% white, 7% Asian, 53% Hispanic
The tendril along the United States-Mexico borderline is widened to comprise of a vast majority of San Diego County’s area. It still includes almost all of Chula Vista and the southern foot of San Diego, but National City is removed in favor of more conservative Coronado and Imperial Beach, covering all of California’s border with Mexico. A small abutment juts into the Hispanic parts of El Cajon. Even if Democratic performance decreases several points, the presence of Democratic and heavily Hispanic Imperial County will keep Filner safe.
District 52 (olive green)
Incumbent: None
40% white, 9% black, 14% Asian, 32% Hispanic
The 52nd district contracts by shedding sparsely populated regions in outer San Diego County and absorbs many Hispanic parts of San Diego. Santee and Poway are also milked for what they’re worth. In total, the black and Hispanic parts probably pushes the district to at least the upper 50s in Obama performance, and if Duncan Hunter even tries here, he’ll be squashed.
District 53 (metallic gray) (God I hate working with this color)
Incumbent: Susan Davis (D)
58% white, 8% Asian, 26% Hispanic
The 53rd district is removed from inner San Diego city and made more of a coastline district. The high white population may seem daunting, but coastal San Diego whites tend to be much more liberal than their inland counterparts. Susan Davis has experience winning in a lean Democratic district (that’s how she was elected in 2000), so even if this district is much less Democratic than before, she should have very little difficulty.


 This is probably good news for Bill Owens.