UPDATE: Thanks for mentioning Flickr as an alternative. Now the maps display correctly.
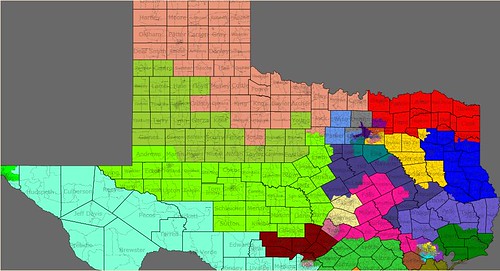
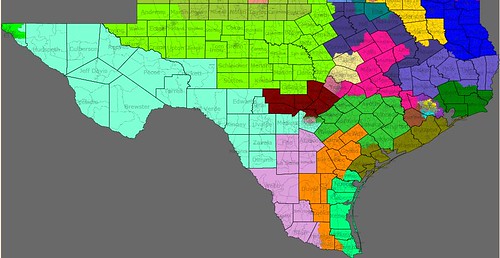
Way back in March I mapped Texas using my own low-tech method. Now, using Dave’s redistricting tool with brand new 2009 estimates, I’ve finally taken on Texas the new and improved way. Again I attempted a Republican gerrymander, but using 35 seats instead of 36 (2009 estimates show growth in Texas slowing enough that the state may gain “only” three seats rather than four).
Below the fold…
Some maps:
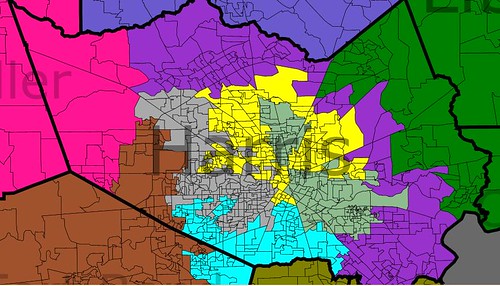
Dallas-Fort Worth:
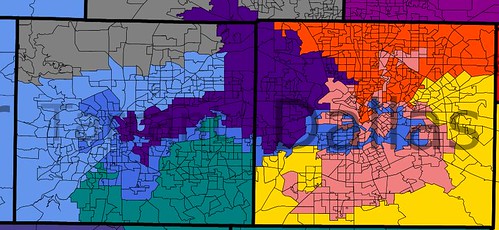
Houston:
Really, the map doesn’t look that different from my original computer-painted one, except that there is no “west-central” district, and that affects the shape of several large districts in Central Texas. I will only make comments for districts that are new, substantially altered from their current forms, or statistically amusing.
OVERALL OUTCOME OF A GOP GERRYMANDER IN 2012:
22 Republicans, 13 Democrats (23-12 when Edwards retires, but may revert to 22-13 as districts like the 22nd and 24th diversify)
District 1 – Louie Gohmert (R-Tyler)
Geography: East, from Wood and Smith Counties in the northwest to Sabine County in the southeast
Politics: safe Republican
VRA stats: 68% white
District 2 – Ted Poe (R-Humble)
Geography: Southeast, from Humble and eastern Harris County in the west to the Gulf in Chambers and Jefferson Counties
Politics: safe Republican
VRA stats: 62% white
District 3 – Sam Johnson (R-Plano)
Geography: Entirely within Collin County
Politics: safe Republican
VRA stats: 65% white
Still solidly Republican and plenty white and suburban, but it’s only logical at this point that Collin County have its own district.
District 4 – Ralph Hall (R-Rockwall)
Geography: Northeast, from Grayson, Collin, and Rockwall Counties in the west to the Arkansas and Louisiana borders
Politics: safe Republican
VRA stats: 75% white
District 5 – Jeb Hensarling (R-Dallas)
Geography: Stretching east from Dallas to Wood County in the north and Cherokee County in the south
Politics: safe Republican
VRA stats: 63% white
District 6 – Joe Barton (R-Ennis)
Geography: Stretches south and east from Fort Worth to Johnson, Ellis, and Navarro Counties
Politics: safe Republican
VRA stats: 62% white
Demographically, the district doesn’t change much, but geographically it does. Gone are all those rural southern counties, mostly ceded to Chet Edwards. Barton instead picks up a lot more Fort Worth, and by the end of the 2010s, that may make the district a lot less white and a lot less Republican.
District 7 – John Culberson (R-Houston)
Geography: west Houston
Politics: fairly safe Republican
VRA stats: 59% white
By the end of the decade this may be a swing seat, despite my best efforts to keep it crimson red.
District 8 – Kevin Brady (R-The Woodlands)
Geography: Southeast, from Grimes County in the west to the Louisiana border
Politics: safe Republican
VRA stats: 73% white
Now this is as hardcore a GOP seat as one can draw east of the Hill Country.
District 9 – Al Green (D-Houston)
Geography: south Houston, Mission City, etc.
Politics: safe Democratic
VRA stats: 42% black, 38% Hispanic
District 10 – Mike McCaul (R-Austin)
Geography: McLennan and Limestone Counties in the north; in the south, stretches east from Austin to west Harris County
Politics: fairly safe Republican
VRA stats: 51% white, 31% Hispanic
The look of this district changed dramatically as I needed to accommodate a bulging Central Texas population and new seats to the south and east of McCaul’s district. Also, Edwards’ district had to be screwed with, so I gave McCaul part of McLennan County (including George W. Bush’s ranch in Crawford, long represented by a Democrat) and a few Chet-friendly counties like Falls and Robertson, leaving Edwards with tougher territory like Brazos County and a split home base. But really, how much tougher can you make the 17th for a Democrat? And meanwhile, McCaul’s district looks like it’s about to rip from being pulled in too many directions.
District 11 – Mike Conaway (R-Midland)
Geography: West, including Midland and San Angelo
Politics: safe Republican
VRA stats: 62% white
Doesn’t get much more Republican than this.
District 12 – Kay Granger (R-Fort Worth)
Geography: much of Tarrant County, plus Wise and Parker Counties
Politics: safe Republican
VRA stats: 75% white
District 13 – Mac Thornberry (R-Clarendon)
Geography: Panhandle / North, including Amarillo
Politics: safe Republican
VRA stats: 68% white
District 14 – Ron Paul (R-Surfside)
Geography: coastline, from Galveston in the northeast to Refugio County in the southwest
Politics: safe Republican
VRA stats: 58% white, 26% Hispanic
Anyone else think it’s odd that the 13th is in the northwestern-most portion of the state and the 14th just about the southeastern-most?
District 15 – Ruben Hinojosa (D-Mercedes)
Geography: South, from Karnes and DeWitt Counties to the Mexican border
Politics: safe Democratic
VRA stats: 82% Hispanic
District 16 – Silvestre Reyes (D-El Paso)
Geography: El Paso
Politics: safe Democratic
VRA stats: 81% Hispanic
District 17 – Chet Edwards (D-Waco)
Geography: Central, from Hood and Johnson Counties in the northwest to Brazos, Madison, and Houston Counties in the southeast
Politics: leans Democratic while Edwards runs, likely Republican once he retires
VRA stats: 67% white
All relevant comments listed under District 10.
District 18 – Sheila Jackson-Lee (D-Houston)
Geography: arc around central Houston
Politics: safe Democratic
VRA stats: 46% Hispanic, 35% black
Unfortunately for VRA perfectionists I could not get a black plurality here without severely upsetting the balance in other Houston-area districts. Like the “black opportunity” districts in California, Texas’ three VRA black districts are quickly becoming plurality-Hispanic, though turnout models still favor an African-American candidate in seats like this one. If I had made this district less Hispanic, it would only have made the 9th more so. There is simply no way to make both of them much more than 40% black.
District 19 – Randy Neugebauer (R-Lubbock)
Geography: West, including Lubbock and Abilene
Politics: safe Republican
VRA stats: 60% white
District 20 – Charlie Gonzalez (D-San Antonio)
Geography: central San Antonio
Politics: safe Democratic
VRA stats: 71% Hispanic
District 21 – Lamar Smith (R-San Antonio)
Geography: Stretches from Kerr and Bandera Counties in the west to Hays County in the east and down to north San Antonio
Politics: safe Republican
VRA stats: 64% white
District 22 – Pete Olson (R-Sugar Land)
Geography: Fort Bend County, southwest Houston
Politics: likely Republican (for now)
VRA stats: 45% white, 25% Hispanic
Demographically, this district is about to pop. No map can simultaneously keep the 9th VRA-protected and secure Culberson, McCaul, and Olson, unless the Republicans cede the new Houston seat (and they definitely don’t have to). If I were them I’d draw a simple district like this that will stay in GOP hands until the clock runs out on Olson (which could well be before the end of the decade).
District 23 – Ciro Rodriguez (D-San Antonio)
Geography: Southwest, from the eastern outskirts of El Paso to south San Antonio
Politics: safe Democratic
VRA stats: 71% Hispanic
Rodriguez’s current district was designed for a competitive race between him and Henry Bonilla in 2006. Now that Bonilla is out of Congress it seems probable that the Hispanic pop. here will go up significantly to preempt any trouble Lamar Smith may run into.
District 24 – Kenny Marchant (R-Coppell)
Geography: Dallas-Fort Worth, meandering through Tarrant, Dallas, and Denton Counties
Politics: likely Republican (for now)
VRA stats: 44% white, 35% Hispanic
Another ticking time bomb for the GOP? These middle-class-to-upscale suburban/urban districts are getting a lot harder for Republicans to hold. I suppose I could have made life a lot easier for Marchant by messing with the boundaries in Fort Worth and diluting the heavily white natures of the 12th and 26th, but really, Hispanic numbers are increasing rapidly in just about every urban or suburban county.
District 25 – Lloyd Doggett (D-Austin)
Geography: most of Travis County
Politics: safe Democratic
VRA stats: 60% white
District 26 – Mike Burgess (R-Flower Mound)
Geography: Denton and Tarrant Counties
Politics: safe Republican
VRA stats: 69% white
District 27 – Solomon Ortiz (D-Corpus Christi)
Geography: Southeast / coastline, from San Patricio County to the Mexican border
Politics: safe Democratic
VRA stats: 72% Hispanic
District 28 – Henry Cuellar (D-Laredo)
Geography: South, from Frio and Atascosa Counties to the Mexican border
Politics: safe Democratic
VRA stats: 89% Hispanic (most heavily Hispanic district in the nation? Probably.)
District 29 – Gene Green (D-Houston)
Geography: central and east Houston
Politics: safe Democratic
VRA stats: 76% Hispanic
Here’s the deal here: Republicans have never cared for Gene Green, and his district has always been majority-Hispanic and is getting more so. To make this an unambiguous VRA seat, remove Hispanics from nearby Republican districts, and possibly guarantee an ethnicity-based primary challenge, I imagine the GOP packing as many Houston Latinos as they can into this seat.
District 30 – Eddie Bernice Johnson (D-Dallas)
Geography: central and south/west Dallas
Politics: safe Democratic
VRA stats: 44% black, 35% Hispanic
District 31 – John Carter (R-Round Rock)
Geography: Central, around Williamson and Bell Counties
Politics: safe Republican
VRA stats: 61% white
The explosive growth in and around this district will cause it to shrink dramatically in area.
District 32 – Pete Sessions (R-Dallas)
Geography: north Dallas
Politics: likely Republican
VRA stats: 56% white, 27% Hispanic
I helped Sessions a lot here demographically, but at Marchant’s expense. One could even out the numbers to make both districts about 50% white, 30% Hispanic, but in rapidly diversifying Dallas, that’s not a lastingly secure position for a Republican anyway.
And the new seats:
District 33 – likely to elect a Latino Democrat
Geography: stretches east from Fort Worth to Dallas
Politics: safe Democratic
VRA stats: 65% Hispanic
At long last, a majority-Hispanic Metroplex district, and a second Democratic seat in the area. The Hispanic population should be robust enough to elect a Latino, but the total ethnic minority population is even more overwhelming at 85%. The Texas legislature is likely to cede a new Dallas-Fort Worth seat like this one to the Democrats, in exchange for saving increasingly vulnerable GOP seats in the suburbs and snatching the other two new seats for the Republicans.
District 34 – likely to elect a Republican
Geography: South-central, from east San Antonio to the Hill Country in the north and Victoria County in the southeast
Politics: likely Republican
VRA stats: 53% white, 36% Hispanic
This district will get more Hispanic as time gets on, but for the first decade it should be fine for a military-friendly white Republican.
District 35 – likely to elect a Republican
Geography: north and east Harris County, outskirts of Houston
Politics: safe Republican
VRA stats: 62% white, 23% Hispanic
Packing the Latinos into the 29th made a big difference here, ensuring a GOP victory in Houston’s new district. Unlike Dallas-Fort Worth, Houston still has room for another Republican seat, though the 22nd may switch columns within the next decade.
So there you have it. Texas may gain a 36th district after 2010; we’ll know once the Census numbers are released. But for now, we can be fairly sure there will be 35 at least. And surprisingly, the map isn’t that different for a 35-district Texas from a 36-district Texas.


