5-7-6 PA Gop compromise/fair districts

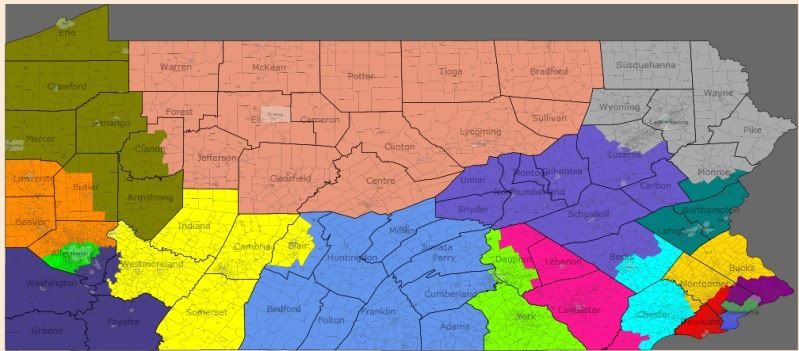
I made a map with two goals. They were:

1.) Keep cities together, and if possible, counties

2.) Make the district without care for partisanship

Philadelphia is the only city in more than one cd, and only four counties have 3 or more cds in them (Allegheny, Philadelphia, Chester, and Montgomery. 4 out of 69 aint bad, considering that Philadelphia has to be.)

There is high upside here for both parties, and this is a decent compromise, although more favorable to the republicans. It comes down to if you believe 2008 or 2010 is the closer to reality.

I really only think one picture is necessary due to the nature of this exercise. If anyone wants a zoomed view, lemme know. All are under 1000 off the ideal population.

District 1 (Blue): 53% Black, 88% Obama

Entirely Philadelphia. Safe as could be. 1-0-0

District 2 (Green): 36% B, 14 Hispanic, 5 Asia, 80% O

Entirely Philadelphia. Safe as could be. 2-0-0

District 3 (Dark Magenta): 58% O

North-East Philly, and parts of Montgomery and Bucks. Leans very D. 3-0-0

District 4 (Red): 61% O

Delco and a part of montco. Likely D. 4-0-0

District 5 (Gold): 54% O

Rest of Montgomery and Bucks, plus a tiny bit of chester. Toss-up, Leans slightly R. 4-0-1

District 6 (Teal): 56% O

Bethlehem, Allentown, Easton and their counties, plus a bit of monroe. Toss-up, Leans slightly D. 4-0-2

District 7 (Dark Grey): 56% O

Scranton, Wilkes-Barre and the surrounding area. Toss-Up, Leans slightly D. 4-0-3

District 8 (Slate Blue): 53% M

A few small cities (Hazelton, Bloomsburg, Pottsville), but a lotta empty area. Likely R. 4-1-3

District 9 (Cyan): 55% O

Reading, the rest of Berks and a huge part of chester county. Pure Toss-Up 4-1-4

District 10 (Deep Pink): 56% M

Lancaster, Lebanon and space. Likely R. 4-2-4

District 11 (Chartreuse): 51% M

Harrisburg and York. Lean M. 4-3-4

District 12 (Cornflower Blue): 63% M

Not a lot going on here. Safe R. 4-4-4

District 13 (Dark Salmon): 54% M

North PA. Surprised it is this close tbqh. Likely R. 4-5-4

District 14 (Olive): 49% O (Wins by about 600 votes).

Erie. Toss-Up, Leans R. However, I think obama underperformed what a congressional D could do here so i’m counting it in the toss-up.  4-5-5

District 15 (Dark Orange): 55% M

North of Pitt. Likely R. 4-6-5

District 16 (Lime): 64% O

Pittsburgh. Safe D. 5-6-5

District 17 (Dark Slate Blue): 50% O

South of Pitt. Toss-Up, Leans R. 5-6-6

District 18 (Yellow): 56% M

The rest, includes Altoona. Likely R. 5-7-6.

Not the best either side could do, but most definitely fair. Both sides have reason to believe they could win a lot of the toss-ups. I hope the gopers believe that anyways. Well, lemme know.

Democratic Gerrymander of Austin – GOP smackdown

Everyone who gerrymanders knows about the infamous GOP cracking of Austin during the GOP gerrymander of Texas.  If the Democrats magically got control of the state House, state Senate and Governorship they would be out for blood over the GOP mid-decade gerrymander

Time for the GOP’s turn to cry over a gerrymander of Austin!

CD-10

Obama 59%

McCain 40%

White 55% Black 6% Hispanic 35%

Since Doggett’s District has grown by over 120,000 people in the past 10 years it has been easy to make it more compact by removing several of the conservative counties, some of Austin was also removed to make room for the other districts.  Austin comprises the majority of the population, but San Marcos and Seguin are also in the district.  The PVI remains the same as Doggett’s old district.  If he can win with an 8 point margin in one of the worst years for Democrats in decades this new district should be no problem.  

Safe Democrat

CD-33

Obama 60%

McCain 39%

White 65% Black 8% Hispanic 20%

Clearly most of Austin is in this new district.  It is 2 points more Democratic than Doggett’s district and includes Round Rock and Georgetown in addition to the majority of Austin.  Again the massive population growth in Austin made this district possible.  Not much else to say on this one.

Safe Democrat

CD-31

Obama 56%

McCain 43%

White 52% Black 21% Hispanic 21%

As if two safe Democratic districts weren’t bad enough a third district including parts of Austin, Waco, Killeen/Temple and College Station/Bryan.  This is the crown jewel of this gerrymander.  This district is beautifully drawn for one reason, to get the GOP angry. I couldn’t quite make this district Democratic enough to be a safe Democratic Seat, but it is definitely winnable, toss-up at worst and lean D at best.

Lean D/Toss-Up

2010 Elections: Comparing My Predictions with the Actual Results

Here are the lists of my predictions compared with the actual results. My predictions were mixed in their DEM/GOP bias, but the House was way more DEM biased. I guess turnout was the key in these races. Seats that changed parties are in boldface.

GOVERNOR

State
My Prediction
Actual Result
Difference
Alabama
R+15.3
R+15.8
D+0.5
Alaska
R+15.7
R+20.6
D+4.9
Arizona
R+15.0
R+13.5
R+1.5
Arkansas
D+25.7
D+30.9
R+5.2
California
D+14.3
D+11.4
D+2.9
Colorado
D+3.7
D+13.9
R+10.2
Connecticut
D+5.7
D+0.7
D+5.0
Florida
D+1.7
R+1.2
D+2.9
Georgia
R+7.7
R+9.8
D+2.1
Hawaii
D+5.0
D+17.1
R+12.1
Idaho
R+22.0
R+26.2
D+4.2
Illinois
R+4.7
D+0.5
R+5.2
Iowa
R+10.5
R+9.7
R+0.8
Kansas
R+27.0
R+31.3
D+4.3
Maine
R+11.3
R+1.8
R+9.5
Maryland
D+12.7
D+13.5
R+0.8
Massachusetts
D+2.7
D+6.3
R+3.6
Michigan
R+16.7
R+18.2
D+1.5
Minnesota
D+1.3
D+0.5
D+0.8
Nebraska
R+42.0
R+48.6
D+6.6
Nevada
R+15.7
R+11.8
R+3.9
New Hampshire
D+8.3
D+7.5
D+0.8
New Mexico
R+8.3
R+7.2
R+1.1
New York
D+22.0
D+27.3
R+5.3
Ohio
R+1.0
R+2.7
D+1.7
Oklahoma
R+18.5
R+20.2
D+1.7
Oregon
D+1.7
D+1.1
D+0.6
Pennsylvania
R+9.0
R+9.0
Spot-on
Rhode Island
I+8.0
I+2.5
I+5.5
South Carolina
R+8.3
R+4.3
R+4.0
South Dakota
R+13.7
R+23.0
D+9.3
Tennessee
R+28.0
R+31.9
D+3.9
Texas
R+1.0
R+12.8
D+11.8
Utah
R+25.3
R+32.4
D+7.1
Vermont
D+2.0
D+1.7
D+0.3
Wisconsin
R+8.7
R+5.7
R+3.0
Wyoming
R+36.0
R+46.5
D+10.5

SENATE

State
My Prediction
Actual Result
Difference
Alabama
R+28.0
R+30.6
D+2.6
Alaska
D+0.7
R+4.8
D+5.5
Arizona
R+23.0
R+24.5
D+1.5
Arkansas
R+19.7
R+21.1
D+1.4
California
D+6.7
D+9.6
R+2.9
Colorado
R+1.0
D+0.9
R+1.9
Connecticut
D+8.0
D+11.8
R+3.8
Delaware
D+14.0
D+16.6
R+2.6
Florida
R+16.0
R+19.2
D+3.2
Georgia
R+25.7
R+18.9
R+6.8
Hawaii
D+24.5
D+53.2
R+28.7
Idaho
R+44.0
R+46.1
D+2.1
Illinois
R+4.3
R+1.9
R+2.4
Indiana
R+10.3
R+18.3
D+8.0
Iowa
R+31.0
R+31.3
D+0.3
Kansas
R+40.0
R+44.1
D+4.1
Kentucky
R+3.2
R+11.6
D+8.4
Louisiana
R+5.9
R+18.9
D+13.0
Maryland
D+26.7
D+25.5
D+1.2
Missouri
D+0.7
R+13.7
D+14.4
Nevada
D+0.7
D+5.6
R+4.9
New Hampshire
R+15.0
R+23.5
D+8.5
New York A
D+28.7
D+32.4
R+3.7
New York B
D+18.3
D+26.2
R+7.9
North Carolina
R+12.3
R+12.1
R+0.2
North Dakota
R+47.0
R+54.0
D+7.0
Ohio
R+9.8
R+18.3
D+8.5
Oklahoma
R+40.0
R+44.4
D+4.4
Oregon
D+15.3
D+17.8
R+2.5
Pennsylvania
R+4.7
R+2.0
R+2.7
South Carolina
R+42.0
R+34.2
R+7.8
Utah
R+25.3
R+28.8
D+3.5
Vermont
D+35.0
D+33.5
D+1.5
Washington
D+1.9
D+4.8
R+2.9
West Virginia
D+1.3
D+10.1
R+8.8
Wisconsin
R+7.7
R+4.9
R+2.8

HOUSE

District
My Prediction
Actual Result
Difference
AL-02
D+3.8
R+2.6
D+6.4
AZ-01
R+4.0
R+6.0
D+2.0
AZ-03
D+1.2
R+11.1
D+12.3
AZ-05
R+0.7
R+8.8
D+8.1
AZ-07
D+4.1
D+6.0
R+1.9
AZ-08
D+6.1
D+1.5
D+4.6
AR-01
R+5.6
R+8.3
D+2.7
AR-02
R+11.0
R+19.6
D+8.6
CA-03
R+3.8
R+6.9
D+3.1
CA-11
D+2.8
D+1.1
D+1.7
CA-18
D+10.8
D+17.0
R+6.2
CA-20
D+2.9
D+3.4
R+0.5
CA-44
R+13.2
R+11.2
R+2.0
CA-45
R+15.0
R+9.4
R+5.6
CA-47
D+8.3
D+13.7
R+5.4
CO-03
D+1.3
R+4.3
D+5.6
CO-04
R+3.6
R+11.1
D+7.5
CT-04
D+2.4
D+6.2
R+3.8
CT-05
D+4.2
D+8.2
R+4.0
DE-AL
D+9.8
D+15.8
R+6.0
FL-02
R+9.3
R+12.2
D+2.9
FL-08
R+3.3
R+17.9
D+14.6
FL-22
D+0.9
R+8.8
D+9.7
FL-24
R+6.3
R+19.3
D+13.0
FL-25
R+3.0
R+9.6
D+6.6
GA-02
D+2.7
R+2.8
D+5.5
GA-08
R+12.5
R+5.4
R+7.1
HI-01
D+2.2
D+6.4
R+4.2
ID-01
D+2.4
R+9.7
D+12.1
IL-08
D+20.0*
R+0.2
D+20.2
IL-10
D+7.6
R+2.2
D+9.8
IL-11
R+5.1
R+14.8
D+9.7
IL-14
R+0.3
R+6.3
D+6.0
IL-17
R+2.6
R+9.6
D+7.0
IN-02
D+4.4
D+1.4
D+3.0
IN-08
R+8.8
R+20.2
D+11.4
IN-09
D+0.5
R+10
D+10.5
IA-01
D+10.0
D+2.0
D+8.0
IA-02
D+8.8
D+5.1
D+3.7
IA-03
D+8.1
D+4.2
D+3.9
KS-03
R+10.0
R+19.8
D+9.8
KY-03
D+10.5
D+10.7
R+0.2
KY-06
D+3.7
D+0.3
D+3.4
LA-02
D+11.8
D+31.1
R+19.3
LA-03
R+12.3
R+27.6
D+15.3
ME-01
D+12.4
D+13.6
R+1.2
MD-01
R+4.9
R+12.1
D+7.2
MA-10
D+2.6
D+4.5
R+1.9
MI-01
R+2.7
R+11
D+8.3
MI-07
D+0.4
R+4.8
D+5.2
MI-09
D+3.9
D+2.6
D+1.3
MN-01
D+10.4
D+4.2
D+6.2
MN-08
D+4.9
R+1.6
D+6.5
MS-01
D+0.9
R+14.5
D+15.4
MS-04
D+2.7
R+5.1
D+7.8
MO-03
D+5.6
D+2.2
D+3.4
MO-04
D+20.0*
R+5.3
D+25.3
NV-03
D+0.3
R+0.6
D+0.9
NH-01
R+10.3
R+11.6
D+1.3
NH-02
R+0.1
R+1.5
D+1.4
NJ-03
R+1.1
R+2.7
D+1.6
NM-01
R+0.6
D+3.6
R+4.2
NM-02
R+4.8
R+10.8
D+6.0
NY-01
D+7.6
D+0.4
D+7.2
NY-13
D+7.5
R+3.3
D+10.8
NY-19
R+1.0
R+5.4
D+4.4
NY-20
R+3.5
R+9.8
D+6.3
NY-23
D+0.9
D+1.1
R+0.2
NY-24
D+3.3
R+6.2
D+9.5
NY-25
D+6.6
R+0.4
D+7.0
NY-29
R+12.5
R+13.2
D+0.7
NC-02
D+2.5
R+0.8
D+3.3
NC-07
D+3.8
D+7.4
R+3.6
NC-08
D+2.4
D+9.3
R+6.9
NC-11
D+11.9
D+8.6
D+3.3
ND-AL
R+5.0
R+9.8
D+4.8
OH-01
R+6.3
R+5.5
R+0.8
OH-06
D+2.1
R+5.1
D+7.2
OH-13
D+10.0
D+11.4
R+1.4
OH-15
R+6.3
R+12.8
D+6.5
OH-16
R+0.6
R+10.8
D+10.2
OH-18
R+1.9
R+13.4
D+11.5
OR-05
D+2.8
D+5.3
R+2.5
PA-03
R+6.3
R+11.4
D+5.1
PA-04
D+12.6
D+1.6
D+11.0
PA-07
R+3.8
R+10.9
D+7.1
PA-08
R+4.5
R+7.0
D+2.5
PA-10
R+4.6
R+10.4
D+5.8
PA-11
R+2.1
R+9.4
D+7.3
PA-12
D+5.4
D+1.6
D+3.8
PA-15
R+11.6
R+14.5
D+2.9
RI-01
D+4.9
D+6.0
R+1.1
SC-05
R+4.8
R+10.2
D+5.4
SD-AL
R+0.3
R+2.2
D+1.9
TN-04
R+1.0
R+18.5
D+17.5
TN-06
R+12.5
R+37.9
D+25.4
TN-08
R+9.5
R+20.2
D+10.7
TX-17
D+1.7
R+25.2
D+26.9
TX-23
D+2.2
R+5.0
D+7.2
TX-27
D+2.9
R+0.8
D+3.7
VA-02
R+3.0
R+10.6
D+7.6
VA-05
R+5.3
R+3.8
R+1.5
VA-09
D+4.5
R+4.8
D+9.3
WA-02
D+5.8
D+2.2
D+3.6
WA-03
R+3.6
R+6.0
D+2.4
WA-08
R+5.4
R+4.2
R+1.2
WV-01
R+2.3
R+0.8
R+1.5
WI-03
D+8.8
D+3.8
D+5.0
WI-07
R+7.2
R+7.7
D+0.5
WI-08
R+5.5
R+9.7
D+4.2

2 Majority Minority Districts in NoVA

File this under: “crazy gerrymanders that have no chance of happening”. Here are two majority-minority districts drawn in my home region of northern virginia:

True to the original spirit of gerrmandering my new districts look kind of like a pink dragon (the 10th) breathing green fire (the 11th) down along the I-95.

Demographics:

VA-10:

49% White, 9% Black, 0% Amer-Indian, 17% Asian, 22% Hispanic, 2% other

VA-11:

49% White, 21% Black, 0% Amer-Indian, 9% Asian, 18% Hispanic, 2% other

I suppose you could say that these districts are not “truly” majority minority, because they are white plurality and probably have a white-majority electorate due to lower nonwhite turnout. Those are both valid and logical points, but this is not supposed to be a valid and logical map so who cares. And the white-plurality thing is probably bound to happen no matter what, as many of the minority-heavy areas of NoVA are a giant mix of black, asian, and hispanic populations. There are a lot of precincts there, especially along the Columbia Pike corridor, that are almost split 25/25/25/25 white/black/hispanic/asian, give or take about 10% for each race, and some precincts down in Woodbridge/Dale City that are close to 33/33/33 white/black/hispanic.

The one problem with this map is that both districts are about 40,000 under population target. That is admittedly pushing it in terms of pop deviation, but it seems to be just barely tolerable. Any higher and the districts go above 50% white. If we were at a point where legislatures are going to these extents to gerrymander districts, I doubt anyone would be that worried about a 40,000 person deviation.

I propose that Obama pick up FDR’s old idea of packing the Supreme Court, appoint a bunch of hardcore liberals to the bench, then have Eric Holder sue Bob McDonnell to force him to draw districts like this, creating five majority-minority districts in Virginia. After that he can move on to suing Jerry Brown to get 40 majority minority districts out of California.

Regional Differences in the United Kingdom’s 2010 General Election

By: Inoljt, http://mypolitikal.com/

On May 7th of 2010, the United Kingdom held a general election to determine its new prime minister. While the Conservative Party gained a number of seats, this was not enough to ensure a majority. Fears of a hung Parliament subsided, however, when the Conservatives joined with the Liberal Democrats to form a governing coalition.

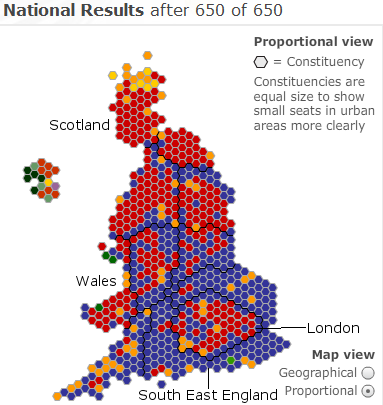
Here is a map of the general election:

Photobucket

This map indicates the number of seats won by each party in the general election. Red – the traditional color for socialism – is the color of the leftist Labour Party; blue the color of the conservative Tories; yellow the color of the Liberal Democrats.

More below.

Like other countries, the United Kingdom does not vote homogeneously. Certain regions are more loyal to one party; other regions to another.

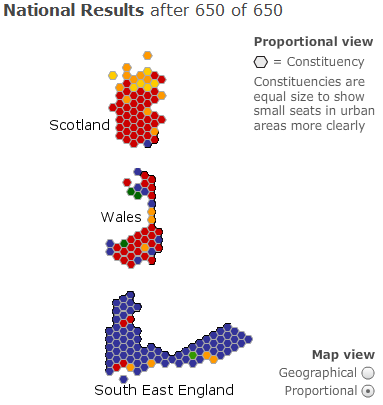
Take, for instance, three distinct parts of Great Britain: Scotland, Wales, and Southeast England. The voting patterns of all three reveal some fascinating things about the country:

Photobucket

As the map above indicates, Labour dominated Scotland, winning a total of 41 seats to the Conservative Party’s paltry single seat.

Several factors lie behind Scotland’s strong pro-Labour vote. There used to be a time when the Tories could rely upon a substantial bloc of Scottish voters, mostly in the rural North. Under Prime Minister Margaret Thatcher’s term, however, pro-market reforms led to the disintegration of Scottish industry – and to this day Scotland remains hostile to the Conservative Party.

Former Prime Minister Gordon Brown’s Scottish heritage also helped him in the region. Indeed, in Scotland Labour did even better than the previous general election, winning 2.5% more of the vote.

A comparison of Labour’s performance in Wales provides evidence of this. Like Scotland, Wales constitutes a Labour stronghold; in 2005 Prime Minister Tony Blair led his party to win 30 seats out of 40 total (the Tories won 3). In 2010, however, the Conservative Party gained five seats in this Labour base. In Scotland support for favorite son Mr. Brown may have boosted Labour fortunes; this was not the case in Wales.

Mr. Brown’s Scottish heritage did not help him everywhere. In the South East England region the Labour Party received a pummeling from the Tories; they lost 13 seats, leaving Labour with a grand total of 4 seats. The Conservatives took 75 seats. Clearly, Mr. Brown’s appeal was limited here; it is possible that his being Scottish had something to do with this.

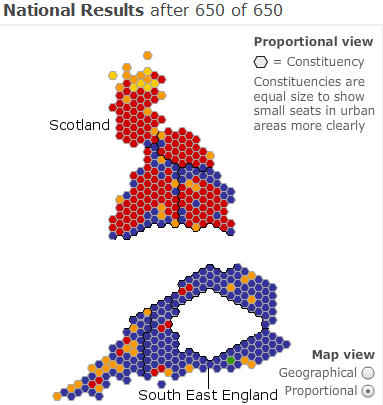
An examination of Southern England reveals yet more regional differences:

Photobucket

This map illustrates the division between Southern and Northern Great Britain. Southern England has always constituted the Tory base; Northern England the Labour stronghold.

A number of fascinating socioeconomic reasons lie behind this. Historically, Southern England was – and still is – the richest, most “snobbish” part of the United Kingdom. Indeed, the South East region constitutes the richest part of the country, apart from London. It is from this region that the Conservative Party draws its main strength.

Northern England, Scotland, and Wales are different. The forces of the Industrial Revolution have influenced their history quite profoundly; for decades their economies relied – too much, in hindsight – upon the factories, steel mills, and coal mines unleashed by industrialization. The death of Anglo-Saxon manufacturing, however, hit this region hard and left it poorer than the South.

The Industrial Revolution also catalyzed conditions ripe for socialism and left-wing politics. It created an urban proletariat – and, indeed, the Labour Party was formed to represent this class. Today these places still vote heavily for the Labour Party.

Indeed, to this day Labour constitutes the party for the working class – despite Mr. Blair’s rebranding of New Labour. This is a role the Democratic Party no longer truly holds, its grasp of the white working class torn apart by racial politics. Great Britain is still homogeneous enough to avoid this. Class still matters in the United Kingdom, far more than it does in the United States.

(Note: All images derived from BBC News.)

2010 SSP Election Prediction Contest: RESULTS!

We were going to wait for all results to be fully official before announcing our contest results (and awarding babka), but Joe “Norm Coleman” Miller seems to refuse to give it up (not even at the urging of Norm “Norm Coleman” Coleman).

Results were calculated as follows:

  • For the two-way races, we asked you for a winner and a margin. We take the difference of your predicted margin and the real margin (including third party candidates), and add that to your “regular” score.

  • For the three-way races, we asked you for the percentage each candidate was going to get. Again, we take the difference of your prediction and the actual percentage earned by the candidate, and add that to your “three-way” score.

  • Your total score is the sum of the “regular” and “three way” scores, with a lower score being better.

  • If you didn’t enter a margin/vote percentage (or we couldn’t understand what you entered), you got a “penalty” equal to the maximum score from a given race.

So a few summary statistics, by race:

  • CT-Gov: 69% of you correctly guessed that Dan Malloy would win. Average margin was Malloy by 1.52%.

  • OH-Gov: 57% of you correctly guessed that John Kasich would win. Average margin was Kasich by 1.53%.

  • OR-Gov: 90% of you correctly guessed that John Kitzhaber would win, on average by 3.39%.

  • CO-Sen: 57% of you correctly guessed that Michael Bennet would win. However, the average margin was Ken Buck by 0.40%

  • NV-Sen: 66% of you correctly guessed that Harry Reid would win, on average by 0.30%.

  • WI-Sen: 91% of you correctly guessed that Ron Johnson would win, on average by 5.17%.

  • FL-25: Only 47% of you guessed that David Rivera would win, but the average predicted margin was Rivera by 0.45%.

  • PA-07: 75% of you correctly guessed that Pat Meehan would win, by 2.96% on average.

  • VA-11: 79% of you guessed that Gerry Connolly would win, and correctly so; the average predicted margin was 2.81%.

In the three-way races:

  • MN-Gov: Average prediction was Dayton 44.45; Emmer 39.68; Horner 14.75.

  • AK-Sen: Average prediction was McAdams 31.88; Miller 33.36; Murkowski 33.62.

This could almost be a testament to the wisdom of crowds (…or alternatively, the central limit theorem) – as a collective whole, only one race would have been called incorrectly. If averages were an entry, it would have placed 21st.

So, of course, having done our best Census Bureau impression (at least we haven’t congratulated ourselves excessively!) – who won?

itskevin, abgin, and UpstateNYer come on down! (And by “come on down”, I mean “email DavidNYC with contact information” …) Sidenote: remember, you had to have submitted your entries before 5pm EDT on Election Day – and had (and still have) a valid account at the time of announcement of contest.

Full results are available here. Thanks to everyone who participated!

If you didn’t win, don’t worry, there may or may not be a prediction contest for the Chicago mayoral race, too. I see David’s babka and raise him one deep dish. That, or some dead fish wrapped in a copy of the Trib, depending on how we feel.  

Just Whistling Dixie: Unlikely Pro-Democratic Maps for Four Southern States (AL, KY, LA, VA)

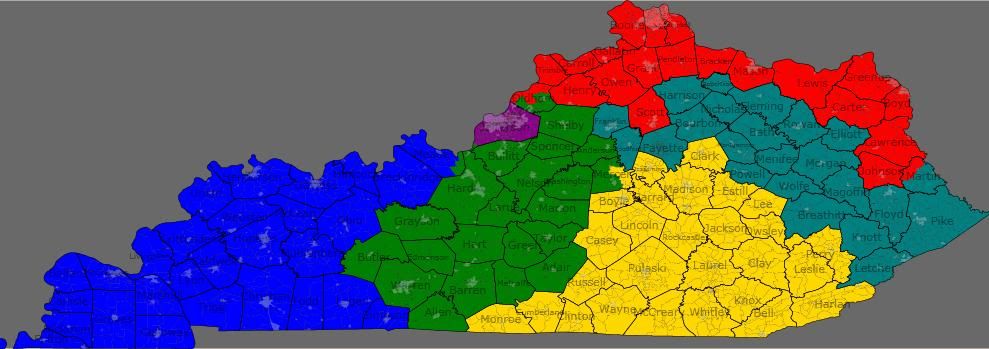
After the jump, I present a survey of maps that are demographically possible if political improbable. They are presented mostly for holiday slow-time discussion fodder. The states covered are Alabama, Kentucky, Louisiana, and Virginia. Republicans will control the process in Alabama; the Democrats control a single house of the legislature in the other three states. So the Democrats are unlikely to get maps as good as these. My redistricting instincts tend towards “good government” aesthetics, so these maps are about what’s possible with relatively compact districts.

Alabama

Top-line results: 5 R – 2 D. (Neutral year, open seat, quality candidates, my impression)

This map creates two majority-black districts in Alabama, while pushing the Huntsville-based 5th in slightly more Democratic direction.

The estimates in Dave’s App put Alabama at 4.66M people. The actual Census figure is 4.78M.

The 1st and 2nd engage in extensive territory swapping with the 2nd. The 1st gains gains the southeastern corner of the state; the 2nd gains much of Mobile proper. This roughly doubles the black percentage of the 2nd, taking it to 53% black, 43% white. Martha Roby should be in trouble. The 7th is very slightly diluted, dropping from 61% to 59% black. Making the 2nd majority black also let me shore up Mike Roger’s 3rd, which lost about 8 points off its black percentage.

In the north, the 5th needed to shrink. Glancing over the last decades worth of county-level results, the eastern side of the district seemed slightly more Democratic than the western side, so I lopped off Jackson County. Mo Brooks would probably still be fine here, but I’d rate this as the district most likely to flip to the Democrats outside of the majority-black ones.

I’m not entirely sure what the Republican will do with their control. The current 4th and 6th are R+26 and R+29 respectively, so a well-executed unpacking of those districts should end shoring up the other four GOP-held districts.

Kentucky

Top-line results: 3 R – 2 D – 1 S (Neutral year, open seat, quality candidates, my impression)

This map shores up Ben Chandler’s 6th district, while pushing the Paducah-based 1st into a potentially swingy seat. (I might be over-estimating Democratic chances there.)

The estimates in Dave’s App put Kentucky at 4.04M people. The actual Census figure is 4.34M.

Looking at recent governor and US senator races, I noticed that the geographically largest areas of Democratic support in Kentucky is in the central portion of western eastern half of the state. That support is currently cracked into parts of three districts. I consolidated that support into Chandler’s 6th (teal), which should go from swingy to solidly Democratic.

In doing so, I forced the 5th (yellow) to the west, eating up areas that are contributing to Republican margins in the 1st (blue). (The new 5th is very Republican — it’s the only district without a single county that went Democratic in either of the last two US Senate races.) This new 1st should be winnable for a Democrat under the right circumstances — for example, by eyeballing it, I estimate that Mongiardo probably won in the 2004 Senate race.

I actually think that my 6th might have a decent shot of being created if the state House Democrats can force incumbent-protection. It’s just that the first will need to be solidified for the Republicans by some territory swaps with the 2nd and 5th.

Louisiana

Top-line results: 3 R – 2 D – 1 S. (Neutral year, open seat, quality candidates, my impression)

This map creates two majority-black districts in Louisiana, while trying to make the Shreveport-based 4th as Democratic as possible.

The estimates in Dave’s App put Louisiana at 4.41M people. The actual Census figure is 4.53M.

The 2nd (green) and 6th (teal) are the intended majority black districts. The actual figures are more like 49.6% in each. The 4th (red) is 54% white, 41% black. I hope that’s enough to make the 4th competitive for the Democrats.

Most speculation I’ve seen indicated the Republicans will be trying to make a single Baton Rouge-to-New Orleans majority-black district. Given the recent rate of party switching in the Louisiana state legislature, I imagine they’ll probably succeed.

Virginia

Top-line results: 5 D – 4 R – 2 S (Neutral year, open seat, quality candidates, my impression)

I originally presented this map in a comment in diary by drobertson. It fits the theme though, so I’m reposting it for consideration. This map is probably the most “good government” of these maps – each district basically corresponds to an existing political/cultural region of Virginia.

Its most notable feature is that presents two plurality black districts in the southeastern part of the state.

The estimates in Dave’s App put Virginia at 7.77M people. The actual Census figure is 8.00M.

1st (blue) – Peninsulas – Obama 46, McCain 54

2nd (green) – Suburban Hampton Roads – Obama 49, McCain 51

3rd (purple) – Urban Hampton Roads – Obama 69, McCain 31 — VRA: 49% black, 42% white

4th (red) – Richmond, Petersburg, and South Virginia – Obama 61, McCain 39 — VRA: 50% black, 44% white

5th (yellow) – Piedmont – Obama 47, McCain 53

6th (teal) – Shenandoah – Obama 43, McCain 57

7th (grey) – Richmond suburbs – Obama 42, McCain 58

8th (slate blue) – Arlington, Alexandria, north Fairfax- safe D

9th (cyan) – southwest Virginia – Obama 40, McCain 60

10th (magenta) – Prince William and Loudoun – Obama 56, McCain 44

11th (lime) — south Fairfax and Manassas – ???

The presidential percentages are back-of-the-envelope style. I used the 2008 figures to the nearest hundred and counted split cities/counties as if they were wholly within the district they were most in. I didn’t feel like delving into Fairfax precincts for the 8th/11th. The 8th should be just as safe as it is now, and I think, though I’m not 100% certain, that this version of the 11th is more Democratic than the current one. (Drobertson questioned this assertion at the time I made it, but agreed that this new district ought to be better for Gerry Connolly if not Generic D.)

The 2nd is more Republican than listed, but I don’t know how much more. I counted Isle of Wight and Suffolk as if they are wholly in it, but they are both donating their most heavily black precincts to the neighboring 4th and 3rd, respectively.

There’s a similar dynamic for the 4th and 7th, which are probably even more firmly in their respective parties’ control than it appears. I counted all of Richmond and Henrico in the 4th, but the majority white parts of each are actually in the 7th.

Notes on incumbents: Wittman, Scott, Cantor, Goodlatte, Moran, and Connolley are all fine. Rigell and Forbes would share the 2nd. Hurt lives in the new 4th. Griffith lives in the new 6th. Wolf lives in the new 8th. I assume all three of them would continue to run in the same districts anyway — all of them are in counties adjacent to their districts.

In the real world, the Virginia state senate Democrats should be able to force incumbent-protection, but seperating Richmond from Hampton Roads for two black opportunity districts won’t be happening.

MN-Sen: Why Bachmann Will Run

http://polibeast.blogspot.com/…

I admit, I’m a pretty nostalgic guy. I’m the type who, despite my limitless political junkiness, would much prefer falling asleep at night to TV Land or Nick at Nite, as opposed to the chatter on MSNBC or FOX. My all-time favorite show is “The Wonder Years,” and, when I’m rich and have a hot wife, I plan to collect comic books and pinball machines, in due part because they remind me so strongly of past times. (Yeah, I’m THAT cool.)

There is a political sort of nostalgia I hold, too. For instance, I wish I were around for the 1984 election, where I would have so passionately championed the Mondale/Ferraro ticket. Here are two figures I hold the highest regard for, and who I only wish I were able to have voted for. I look back on the glory days of Scoop Jackson, John F. Kennedy, and other Democratic juggernauts with the same wide-eyed look as I do old sitcoms and Phil Spector records. There’s something about old Americana that I can’t help but love.

I hate to admit this, but, as of late, I’ve found myself nostalgic for, of all people, Katherine Harris. Yes, liberal readers, the former Florida Secretary of State and U.S. Congresswoman. You know, the one who was so obviously non-partisan, fair, and unbiased in the 2000 presidential race? Yeah, that one.

See, the thing is, I see this new crowd of Katherine Harrises, the Sarah Palin/Michele Bachmann/Christine O’Donnell coalition of right-wing women, are merely amateurs in comparison to the original Tea Party Queen (well, in all fairness, that title probably belongs of Phyllis Schalfly, but, c’mon, she was no fun). Harris was as loony, crazy, and uber-conservative as they come, and the U.S. House is less entertaining as a result of her absence. She was really something else.

The reason I find myself lately pondering Katherine Harris is that one of those aforementioned Tea Party gals, Michele Bachmann, appears poised to stage a very Katherine Harris-y move.

I get the sense that Bachmann, who’s really one of our most clueless and deranged U.S. House members, sees herself much in the same vein as Harris – that, like Harris thought of herself, she is something bigger and better than just an ordinary U.S. Congresswoman. Her political ambitions are too bombastic for her to remain in the U.S. House, and I firmly believe that, because of these ambitions, Bachmann will make a surprising power play in ’12.

I believe that Bachmann will run for the U.S. Senate against Minnesota Democratic incumbent Amy Klobuchar in ’12. Why?

Well, much like Harris in 2006, Bachmann rightfully realizes that the state’s conservative base would catapult her to a comfortable primary victory. This is true. She wouldn’t even have to worry about it. In ’06, Harris knew all along that she probably couldn’t beat incumbent Sen. Bill Nelson. What she realized, though, is that she could cruise through a primary, and, that if Nelson staged a blundering gaffe during the general election, she might at least have a small chance of winning. (That gaffe never happened, and she lost by 18 points.)

For Bachmann, it’s the same thing. Like Nelson in ’06, Klobuchar is a relatively popular incumbent, and, like Harris in ’06, Bachmann is far too conservative for her state’s electorate. What Bachmann hopes is that Klobuchar doesn’t run as sterling a campaign as Nelson in ’06 – that, somehow, Klobuchar screws up so royally that a Tea Party candidate can win statewide in one of the most blue states in the union.

Even if Bachmann loses, however, it’s a winning situation. She’s no longer just one of hundreds of U.S. House members. She took her shot at the big leagues, won her party’s nomination statewide, garnered tons of national press attention, and further established herself as a hero to the right. In the end, U.S. Senate victory or not, she’ll probably feel awfully good at the end of the day.

As for Harris, I’m sure she enjoyed the attention and thrill of the ’06 race. Sure, she’s no longer relevant, but, hey, does relevancy necessarily matter when you’re at home sitting on the gigantic pile of cash you built-up when you were relevant? Probably not a whole lot.

For Bachmann, I suspect a U.S. Senate run is a risk she’s more than willing to take. (Not that she has a snowball’s shot in hell of winning.)

http://polibeast.blogspot.com/…

Illinois Redistricting 12-4-2

Illinois looks to be one of the few bright spots for Democrats in redistricting.  An unexpected hold of the Governor’s seat gives Illinois Democrats the vaunted trifecta.  This map assumes blank things:

1) There will be 3 black VRA districts and a single Hispanic district.  In the next redistricting there will likely finally be 2 Hispanic seats.  For now the Hispanic community is too spread out to effectively draw a district.

2) Comebacks aren’t the most effective way to go.  Some of those had no right to be blue (see IL-14, IL-8), drawing a map based on those districts isn’t the wisest path for a Democratic gerrymander.

3) The Democrats won’t shy away from drawing districts that require a fight.  There’s an impulse toward the safest path in the Democratic party.  A map with about 10 surefire Democratic seats may be possible, but this year it’s worth it to push for the extra seats.

It’s been done to death, but it’s where I live and work so, without further ado:

Image Hosted by ImageShack.us

Image Hosted by ImageShack.us

Image Hosted by ImageShack.us

Image Hosted by ImageShack.us

CD 1 (Blue)- Bobby Rush (D)

W: 39% B: 54%

Major Cities: Orland Park, Tinley Park, Orland Park, Blue Island, Homer Glen, Chicago

Safe Democratic

Bobby Rush’s southwest side district remains mostly the same.  It is significantly less black than it was before, but it is still a majority.  The district reaches out and grabs a significant chunk of the current 13th district.  It will remain a safe Democratic district, if not so overwhelmingly.

Image Hosted by ImageShack.us

CD 2(Dark Green)-Jesse Jackson Jr. (D)

W: 32% B: 54% H: 11%

Major Cities: Chicago Heights, Calumet City, Peotone, Chicago

Safe Democratic

Similar to the 1st district the 2nd grabs some Republican leaning areas and becomes significantly less black.  Like the 1st it’s still a solid Democratic district and Rep. Jackson’s as long as he wants it.

Image Hosted by ImageShack.us

CD 3 (Purple)-Dan Lipinski (D) or Judy Biggert (R)

W: 64% H: 27%

Major Cities: Hinsdale, Burbank, Oak Lawn, Berwyn, Cicero, Chicago

Safe Democratic

Judy Biggert’s home is technically in the 3rd, but running here would be an uphill fight for her.  More likely she’ll decide that at 75 her decades of public service are enough.  The core of the Lipinski family’s 3rd district is still there.  It picks up more Hispanic areas in the east to offset the areas of DuPage it grabs.

Image Hosted by ImageShack.us

CD 4(Red)-Luis Gutierrez (D)

W: 19% H: 70%

Major Cities: Chicago

Safe Democratic

It’s still super-Hispanic.  The northern enclave is somewhat larger and the southern one somewhat smaller.  The connection between the sections is less painfully gerrymandered.

Image Hosted by ImageShack.us

CD 5(Yellow)-Mike Quigley (D)

W: 64% H: 23%

Major Cities: Addison, Bensenville, Elmwood Park, Chiago

Lean Democratic

The 5th district grabs a large chunk of downtown Chicago and a large chunk of DuPage County.  I’m most worried about this district’s safety, back of the envelope numbers and a couple of guesses say the district should be safe, but actual results would make me feel better about the seat.  Quigley does hold onto most of his base and the majority of the district is in Chicago.  Admittedly I’m being over cautious.

Image Hosted by ImageShack.us

CD 6(Teal)-Peter Roskam (R), Randy Hultgren (R), or Judy Biggert (R)

W: 75% A: 9% H: 10%

Major Cities: Wheaton, Naperville, Downers Grove, St. Charles, Barrington Hills

Safe Republican

Bench: Fred Crespo-HD 44

The 6th district becomes a suburban Republican vote sink.  Roskam’s district keeps its Wheaton base, grabs Republican strongholds in Naperville, St. Charles, and Barrington Hills.  All of the west and northwest suburban precincts that are unpleasant for Democrats get stuffed in here.  If Democrats insist on running a candidate who is more than a placeholder, state rep Fred Crespo held his seat in November and could run.  It’s a bad idea, but if the party insists.  On the Republican side both Roskam and Hultgren live in the district.  Both represented the 48th district in the state Senate and a primary fight between the two would be something to see.  A big part of Biggert’s base is in the district.  She could decide to run here, but is as likely to retire.  Which is disappointing because I’d pay to see a three-way brawl between sitting Republican Congressmen.

Image Hosted by ImageShack.us

CD 7(Silver)-Danny Davis (D)

W: 25% B: 53% H: 16%

Major Cities: Villa Park, Elmhurst, Bellwood, Oak Park, Chicago

Safe Democratic

Davis’ district picks up some new territory in DuPage.  It’s still a majority black district (though less than before).  And it’s still a Democratic district, though less than its current D+35.

Image Hosted by ImageShack.us

CD 8(Purple)-Joe Walsh (R) or Vacant

W: 67% H: 19%

Major Cities: Waukegan, Lake Forest, Highland Park, Vernon Hills, Grayslake, Gurnee

Lean Democrat

Bench-Rep. Melissa Bean, Sen. Susan Garrett LD-29, Sen. Terry Link-LD 30

The 8th pulls almost entirely out of Cook County and takes the whole of Lake County plus a sliver of Barrington.  It’s a swing district.  Bean may have been able to hold it this year, especially against Walsh.  This district leans ever so slightly Democrat.  Bean could run again here, she’s not a retread for most of the district.  She kept the score close throughout Lake County in 2010, and won it in 2008.  Even Dan Seals won the parts of Lake in the 10th in 2010 and 2008.  If Bean doesn’t make an attempt to reclaim her seat State Senators Susan Garrett and Terry Link are positioned to make a run for Congress.

Image Hosted by ImageShack.us

CD 9(Blue)-Jan Schakowsky (D)

W: 64% A: 11% H: 14%

Major Cities: Evanson, Park Ridge, Des Plaines, Evanston, Chicago

Safe Democrat

Schakowsky’s seat doesn’t change much.  She loses much of Skokie and Niles and picks up more of Chicago and Republicans areas around Northfield, Wheeling and Rosemont.  If anything her seat comes out stronger.

Image Hosted by ImageShack.us

CD 10(Pink)-Bob Dold (R)

W: 70% A: 14% H: 12%

Major Cities: Schaumberg, Rolling Meadows, Arlington Heights, Skokie, Northbrook

Lean Democrat

Bench: Rep. Elaine Nekritz HD-59, Sen. Jeff Schoenberg LD-9, Julie Hamos, Dan Seals

This seat should have been a Democratic seat ages ago.  Any gerrymander should be sure to put the 10th over the top.  The 10th now stays mostly within Cook County, ducking into DuPage for just a few thousand votes.  If Democratic strongholds in Schaumburg, Niles, Skokie, Northbrook and Winnetka combined with Democratic trending Hoffman, Elk Grove and Palatine can’t produce a Democrat in this district then there truly is a curse.  Popular state Senator Jeff Schoenberg could make a successful run for the seat, though the real boon would be state rep Elaine Nekritz.  Nekritz is an archetypical suburban Democrat: socially progressive and fiscally moderate.  She would run the table in a district like this.  Some area Democrats are hoping for a Julie Hamos comeback.  I dislike the idea personally because of the first rule of suburban Chicago politics: if you can’t beat Dan Seals you don’t get a second chance.  Which leads us to Dan Seals, who could take a fourth crack at the seat.  By no means should he, but by no means should he have run this year, so we’ll have to see.

Image Hosted by ImageShack.us

CD 11(Blue)-Adam Kinzinger (R) or Tim Johnson (R)

W: 79% B: 11%

Major Cities: Champaign-Urbana, Bloomington-Normal, Decatur, Danville, Kankakee

Tossup

Bench: Sen. Mike Frerichs-LD 52

The 11th grabs every Democratic leaning city in eastern Illinois.  The college towns Champaign-Urbana (People’s Republic of) and Bloomington-Normal as well as the union towns of Decatur and Danville make up half to two-thirds of the district.  The rest of the district is decidedly anti-Democrat.  Putting this district in the D-column comes down to a turnout fight.  Sen. Mike Frerichs is a Democrat who can win right-leaning voters.  He’ll be able to stop a Republican from running up the score in between the cities.  Tim Johnson lives in Urbana and represents the 15th district currently.  He could run here and have a chance to win, but up-and-comer Adam Kinzinger also live in the district.  Johnson has seniority, but Kinzinger has the potential to be a rising star of the party.  Here’s hoping for a cage match.

Image Hosted by ImageShack.us

CD 12(Blue)-Jerry Costello (D)

W: 79% B: 16%

Major Cities: East St. Louis, Edwardsville, Carbondale, Alton, Cairo

Safe Democrat

The 12th is relatively unchanged.  It picks up some new territory in Calhoun County and around Edwardsville, drops some of Williamson and Jefferson Counties, and remains a safe district for incumbent Costello.

Image Hosted by ImageShack.us

CD 13(Pink)-Randy Hultgren (R) or Vacant

W: 61% B: 11% H: 24%

Major Cities: Joliet, Aurora, Lockport, Romeoville, Batavia

Lean Democratic

Bench: Rep. Bill Foster, Rep. Linda Chapa LaVia-HD 83, Sen. Linda Holmes-LD 42, Sen. Arthur Wilhelmi-LD 43.

The 13th district picks up Aurora and Joliet for its loses in DuPage.  This district is distinctly more Democratic.  It’s not a district to take for granted, but in a fair fight expect a Democratic win.  Bill Foster could run for this district from Batavia, or any member of the deep bench in the area could rally a coalition of minority and working class voters in the area.  Sen. Wilhelmi would, I believe be the strongest candidate on the Democratic side.  Hultgren could run here if the party moved to protect Roskam.  It would ultimately be a fools errand; in 2010 Foster pounded Hultgren 61-37 in Aurora.

Image Hosted by ImageShack.us

CD 14(Brown)-Joe Walsh (R) or Vacant

W: 71% H: 19%

Major Cities: Elgin, Rockford, McHenry, Crystal Lake, Batavia

Tossup

Bench: Rep. Jack Franks-HD 63, Rep. Keith Farnham-HD 43, Sen. Mike Noland-LD 22

Joe Walsh could run here.  He’s claiming his home is in McHenry now.  McHenry County was good to Walsh in 2010 and he may want to stay with his base.  The district is not as Republican as it looks at first glance.  Democratic Rockford and Elgin make up about half of the district while McHenry county not is the wasteland it was five or ten years ago.  Democrat Jack Franks has kept his northwest McHenry county seat Democratic for more than a decade now.  If Franks runs it’s a narrow advantage for the Democrats, if he doesn’t it’s a complete tossup.

Image Hosted by ImageShack.us

CD 15(Orange)-Tim Johnson (R) or John Shimkus (R)

W: 93%

Major Cities: Charleston, Effingham, Colinsville, Metropolis, Centralia

Safe Republican

Bench: Rep. Jay Hoffman-HD 112, Rep. Brandon Phelps-HD 118, Sen. Gary Forby-LD 59

The Republicans have to go somewhere.  This is one of them.  Any democrat running here is a ConservaDem placeholder.  The interesting thing to watch could be two powerful Republicans wailing on each other.  If Johnson is pushed out of the 11th to make way for Kinzinger then it’s likely that he’ll hop the border and try to run in the 15th.  About a third of Johnson’s old 15th remains in the new 15th.  If neither Johnson nor Shimkus feel like retiring things could get fun down here, grab the popcorn.

Image Hosted by ImageShack.us

CD 16(Light Green)-Don Manzullo (R)

W: 87%

Major Cities: Freeport, Galena, Rochelle, DeKalb, Morris, Lasalle

Lean Republican

Bench: Rep. Careen Gordon-HD 75, Rep. Frank Mautino-HD 76

Manzullo’s old district, less Rockford, Boone County and McHenry County plus north-central Illinois.  This 16th will generally be a Republican hold, but is not as monolithic as the other downstate Republican seats.  Bureau, LaSalle, Jo Daviess, Carroll, and Stephenson are willing to vote Democratic if they’re given a good enough reason.  Combined with liberal Putnam county and left trending exurban counties (DeKalb, Kane, Kendall) this seat could turn blue for a short while in a Democratic wave year.

Image Hosted by ImageShack.us

CD 17(Purple)-Bobby Schilling (R) or Aaron Schock (R)

W: 82% B: 10%

Major Cities: Peoria, Quad Cities, Springfield, Galesburg, Sterling, Macomb

Lean Democratic

Bench: Rep. Mike Boland-HD 71, Sen. Mike Jacobs-LD 36, Sen. David Koehler-LD 46, Rep. Phil Hare.

This was a Democratic seat for some 30-years.  It still is; it fell prey to a weak candidate and a terrible year in an area that has passed recession and is economically depressed.  There is no problem with keeping a western Illinois Democratic district.  This map strengthens the 17th, cutting Republican Adams and Hancock Counties and picking up Peoria, Mason County, and the rest of Springfield while holding the Democratic core of Knox, Henderson, Mercer and Rock Island Counties.  A number of Democrats have expressed interest in taking back what will be one of DCCC’s top targets in 2012.  Any of them should have a good chance to beat the Republican.  Bobby Schilling currently represents the 17th, but Aaron Schock now lives in the district.  He’ll likely keep running in the 18th though.

Image Hosted by ImageShack.us

CD 18(Yellow)-Aaron Schock (R)

W: 95%

Major Cities: Quincy, Jacksonville, Pekin, East Peoria

Safe Republican

Bench: Sen. John Sullivan-LD 47, Sen. Deanna Demuzio-LD 49

Schock’s district gets stronger.  He picks up Macoupin County and its Democratic machine, but more than cancels it out with Adams, Hancock and Tazewell Counties.

Madigan may balk at this map.  It somewhat weakens Lipinski while strengthening Schakwsky (Madigan likes Lipinski and dislikes Schakowsky) and it likely takes Jack Franks out of the House, a seat that will probably flip without Franks.  Also, rather than going for a more sure 13-5 split the map tries to run up the score to 14-4.

This map isn’t necessarily a prediction of what we’ll see.  But it is, I believe, the most aggressive map Democrats can draw.  And as a Democrat its the map I hope to see.