Arkansas: 1D-1S-2R or 0D-2S-2R?

The redistricting process give the chance of have some improvement in Arkansas. Here the democrats keep still the trifecta and will draw the map what they want. Then this is a very interesting state for redistricting.

I think the democrats from Arkansas should take this chance for redistricting like the last time having the trifecta.

Looking to the results of the last election I think they are two possible combinations:

1D-1S-2R

0D-2S-2R

Arkansas 1D-1S-2R

The 1D-1S-2R can be the safest in the short term. And it would be better still if the democratic district can have the protection of the VRA.

I would like the democrats here find the VRA protection for one of the districts, because I think the republicans can draw a 4-0 map for them when they can, if they are not one district protected by the VRA.

The first map what I draw find the most black areas in the state for see if they are enough black in Arkansas for do a VRA district in the state. It is a map what shows the most black areas in the south and the east of the state with the size of a US House district. They are no-conected areas with the size of a district and over 50% black:

Photobucket

This areas would give the chance of create a minority-majority district with the blacks as first group if we try to connect the most black precints.

But it seems the current laws in the state leaves not divide the counties in different districts. If we take the most black option for a district in Arkansas we would have a district 38.32% Black like this:

Photobucket

It is not enough for have the protection of the VRA law. I would like the democrats from Arkansas think if it would be good to change the laws for make a VRA district or not.

But the next maps finding a good redistricting (since the democratic point) try to respect the current laws.

A little less black (38.25%) would be the most democratic district what the democrats from Arkansas can do. It is the AR-02 in the next map. This is the most democratic combination what I find, the best for unseat T Griffin.

This district would be 56.69% Obama, a 17.83% better than the average of the state (38.86% Obama). And being Arkansas R+9 still, that mean this district can be approximately D+8.

Photobucket

Taking this district as the new AR-02, and finding the most democratic combination possible between all the other counties for keep the seat of M Ross, we would have a map like this:

Photobucket

This new version for the AR-04 would be 42.59% Obama what is 3.73% better than the average of the state (38.86% Obama). That would give approximately a R+5 district. It is not easy to leave enough connected population for the AR-01 and AR-03 districts. The rating of both districts would be R+20 or little plus.

Arkansas 0D-2S-2R

Other different option would be to find a 0D-2S-2R combination with two swing district with rating close to EVEN. Just I need to find the most democratic option for come to this goal and this leaving decent deviations. It is not difficult to draw a D+ district including Pulaski county, but is so difficult to draw a EVEN district without this county. But well, this would be the district:

Photobucket

This version of the AR-04 (because includes Nevada county) is only 47.23% Obama, 8.37% better than the average of the state (38.86% Obama), and being Arkansas R+9, this district would be aproximately EVEN or R+1. This district would be 36% black.

The rest of the map with the best combination possible for AR-02 leaving enough space for AR-01 and AR-03 would be:

Photobucket

This version of AR-02 would be 47.22% Obama, 8.36% over the average of all the state (38.86%) and would be aproximately EVEN or R+1.

In this map again AR-01 and AR-03 would be R+15+.

I think the 1D-1S-2R option is better if:

– If we can have a VRA district in Arkansas (doing the necessary changes in the current law).

– While M Ross continues in the US House.

The 0D-2S-2R can be better if M Ross leaves the US House for run for Governor (as example).

By what margin will Bob Shamansky win?

View Results

Loading ... Loading ...

All I Want for Christmas is a Nevada Redistricting

Merry Christmas to everyone who celebrates it, whether on 25 December or otherwise. While waiting for the ham to be done, I drew up a map of Nevada with four shiny new districts, just what the U.S. Census Bureau ordered.

The way I drew it, we’re basically looking at a 2-2 map, with three if not all of those districts being somewhat “soft” (potentially competitive in the right cycle) due to the quirks of Nevada geography, politics, and geopolitics. Some people on other threads (the Missouri one, for example) have suggested that Gov.-elect Sandoval and the Republicans will probably be satisfied to shore up Rep.-elect Heck somewhat in exchange for letting the Democrats have their way, to an extent, with the new NV-04. I’m inclined to agree. Also, drawing a safe 1-3 map for a rapidly blueing state like Nevada is not terribly easy.

I don’t usually go out of order, but we should probably start at the top here (geographically rather than numerically) because Nevada is an oddly shaped state.

NV-02 (green, safe lean Republican)

Rep. Dean Heller, a Republican, is thought to be prepping a Senate bid against Sen. John Ensign, the scandal-tarnished Republican incumbent whose unreliability and moral flexibility has been a thorn in the side of Republican leadership in Nevada and in Washington for several years now. If he decides to forgo a bid for statewide office in favor of running for reelection, I doubt he’ll have a problem here. Washoe County may be swingy, but Heller is popular, and any Republican can run up crushing margins in the cow counties. If Heller runs for Senate in 2012, though, Republicans and Democrats alike will want to put a lot of effort into recruiting top-tier candidates here.

NV-01 (blue, safe Democratic)

Vegas, baby! This is Rep. Shelley Berkley’s district, and she’s considered the likeliest Democrat to run for Ensign’s seat in 2012. I figure she’ll vacate, and it’s just as well, because although Nevada isn’t a VRA preclearance state, the Department of Justice may lean on the incoming Sandoval administration to ensure a minority-majority seat. Latinos are actually about a quarter of Nevada’s population, they’re the fastest-growing demographic, and it’s pretty easy to draw a compact Latino-plurality district. This district is actually 28% white, 14% black, 6% Asian, and 49% Latino, going off 2008 population estimates, and I’ll bet dollars to doughnuts it’s outright Latino-majority in the new census data. Sandoval himself may do okay here, but it’s a safe Democratic district.

NV-03 (purple, likely Republican)

Rep.-elect Joe Heck edged Rep. Dina Titus, flipping the present “fair fight” incarnation of this district from blue to red, last month. One of Sandoval’s top priorities will be shoring him up. Adding a bunch of cow counties and consolidating the district’s hold on white-collar Clark County precincts is a decent way of accomplishing that. While Sharron Angle might lose this district, and Titus could conceivably take it back, it now tips pretty firmly in Heck’s favor.

NV-04 (red, likely Democratic)

One of the big reasons why the current NV-03 is a swing district is that it includes both Democratic and Republican areas along with some subdivisions that go both ways (no, not like that, most of those are pretty heavily Democratic). I gave most of those Republican areas to my NV-03, or at least I tried to, while NV-04 takes over most of the Democratic areas, centering around Spring Valley. It’s a mostly suburban district, though it includes just a bit of rural Clark County up Highway 95. Titus or another strong Democrat with a suburban base should be pretty solid here except in particularly gruesome cycles, although a socially moderate or libertarian Republican could potentially win it.

As a Christmas bonus, I’m also going to repost my revised and updated map for Missouri, which shrinks to eight districts in 2012’s redistricting, without much commentary:

This isn’t necessarily the most favorable map Democrats can possibly get, but it’s probably the most favorable map they’re likely to get in 2012. (There’s a whole discussion about this on the other diary.) It’s probably a 3-5 map, with Democratic Rep. Russ Carnahan’s MO-03 (purple) likely playing host to a deathmatch between Carnahan and Republican Rep. Jo Ann Emerson of Cape Girardeau in 2012.

A few quick notes: Democratic Rep. Lacy Clay’s MO-01 (blue) is 48% white, 47% black, remaining VRA-compliant. I was of the school of thought saying it couldn’t be done without throwing Carnahan overboard, but there you have it. Carnahan’s share of St. Louis County consists almost entirely of precincts that voted for then-Sen. Barack Obama in the 2008 presidential election, so I think Mr. Local Boy has a good base there. And Republican Rep. Todd Akin’s home in rich white Town and Country remains in his district of MO-02 (green).

Not much to add here. Democratic Rep. Emanuel Cleaver in MO-08 (slate blue), renumbered from the current MO-05, still doesn’t get a VRA district, but he’s a good politician who is popular with both white and black Democrats in Kansas City. I resisted the urge to dismember Republican Rep.-elect Vicki Hartzler’s MO-05 (yellow), renumbered from the current MO-04, because I didn’t think the Republicans in the Missouri state legislature would let such a plan get to Democratic Gov. Jay Nixon’s desk.

Hope everyone is dividing their time as they see fit between family, friends, and politics. Thoughts on either map are welcome and appreciated.

Upstate NY redistricting

Another try at New York.

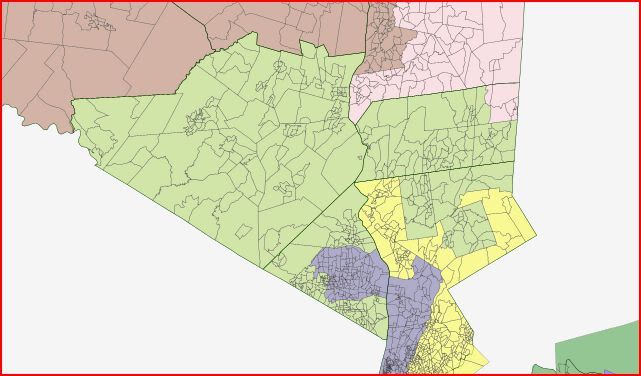
I am emphasizing upstate NY-from Westchester County upwards.  I am assuming that the Dems lose a seat in NYC, so the Rs will now have to take a hit upstate.

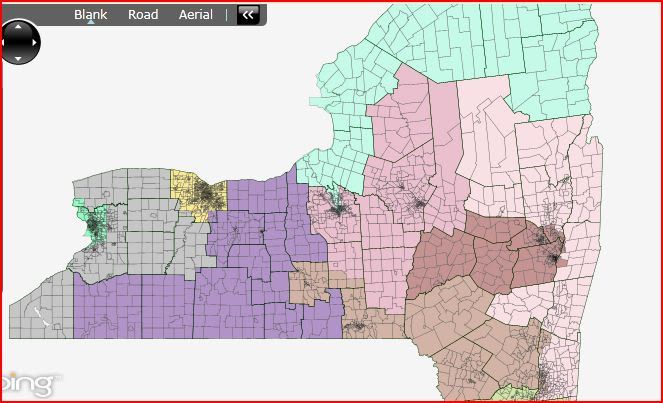
General map

Photobucket

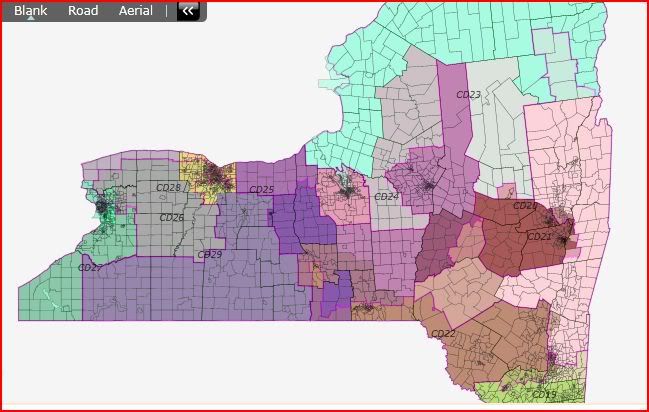
Old CDs overlaid on New map

In several instances, the ideal percentage for a party was reduced in an effort to keep some coherence in township boundaries.

for ease of reference, I am keeping the old CD numbers and general locations where possible.

Photobucket

Old CD17       New CD17

O72% M28%      O67% M32%

Rockland, Westchester, NYC

safe for Engle. An alternative would be to push CD17 completely into NYC, making CD18 a Westchester/Rockland District.  Either way, both CD17 and CD18 would be safe D.

OldCD18         NewCD18 Lowey

O62 M38         O70% M30%

Westchester County, NYC

Old CD19       New CD19  Hayworth

O51% M48%      O50% M49%

Could have hiked  the McCain % some if she didnt live in Westchester.

Loses Dutchess County, gains R portions of Rockland.

Old CD20       New CD20  Gibson

O51% M48%      O50% M49%

Similar configuration to the old.  Loses some of the more D portions of Dutchess, gains Fulton County.

Old CD21       New CD21 Tonko

O58% M40%      O58% M40%

Gains Otsego county, but similar configuration

Old CD22  New CD22 Hinchey

O59 M39   O58% M40%

Similar configuration to old district. Gains all of Tompkins County, parts of western Dutchess County. I could easily bring back up to 59% by breaking up townships in Dutchess.

Old CD23  New CD23 Owens

O52 M47   O58% M40%

Major surgey to bring in Syracuse City, but over half the district [the good half] is from Owens old CD23.  A brutal primary with a Syracuse politician could be fatal, but this seems the only way to bring in the necessary D voters. 200,000 of the district is now Syracuse.

CD24  disappeared into new CD24, CD29, CD25

Old CD25       New CD25 Buerkle and Hanna both R

O56% M43%      O50% M48%

Looks like a fight between Onondaga County Buerkle][sans Syracuse] and Oneida county [Hanna]

Old CD26       New CD26 Lee

O46% M52%      O45% M54%

Loses Monroe county, gains in Erie county, and gains Chautauqua county, but retains the general configuration of his old district.  I deliberately kept all of his old district in his new, outside of the above, since Lee probably has the clout vs Reed to do so.

Old CD27       New CD27 Higgins

O54% M44%      O63 M35

City of Buffalo

Old CD28       New CDRochester

O69% M30%      O58% M40%

I did read somewhere that Slaughter was not happy with the dumbell.  Well, now her district is confined to Monroe County.

Old CD29     New CD24 Reed

O48 M51      O46 M52

Mostly the old CD29, sans Monroe County. Gains 4 counties on the eastern edge from CD24 and CD25.

Map of Old CDs on new

Photobucket

Maps of Colorado Elections

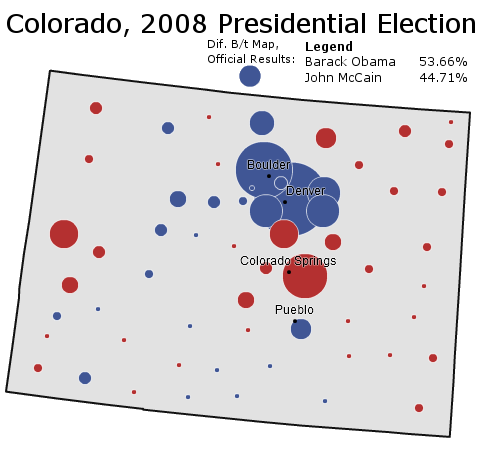
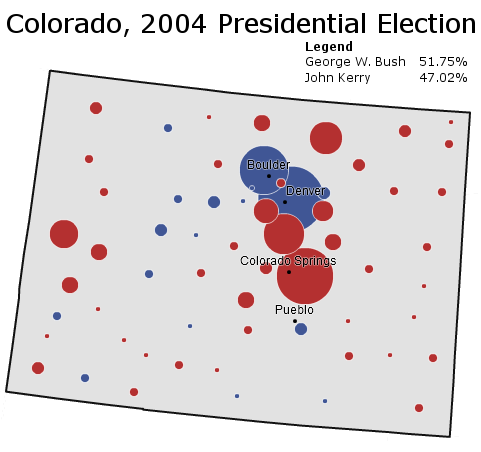
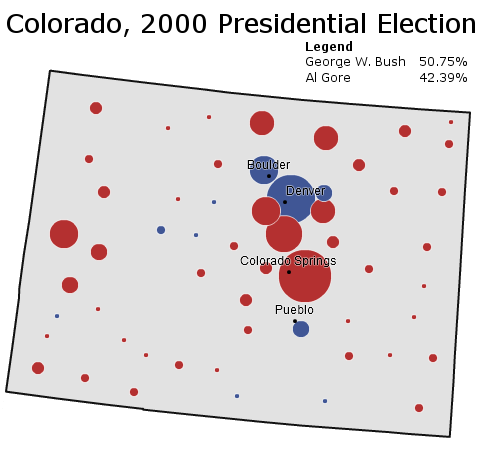
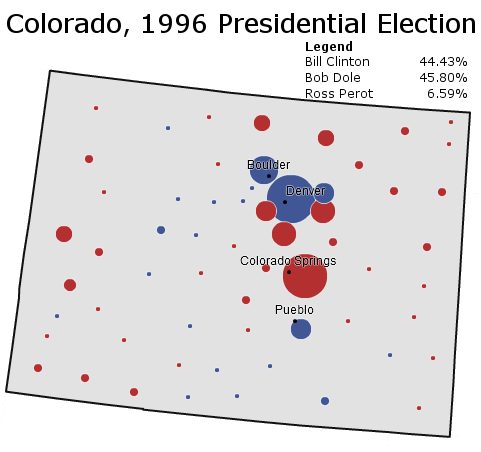
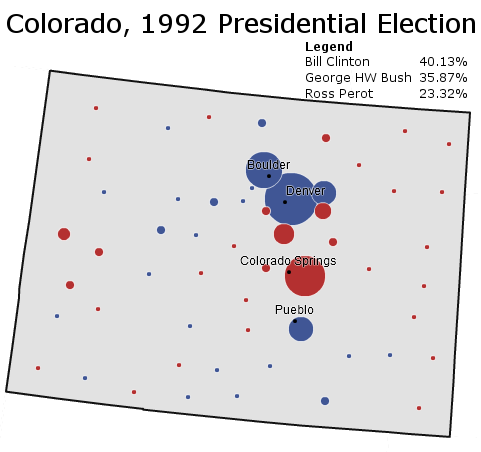
To follow up the series of posts on Colorado, I’ve posted a few recent presidential elections in the state (courtesy of the New York Times). Each map comes with some brief analysis.

Photobucket

Boosted by a Democratic National Convention held in Denver, Senator Barack Obama wins a thorough victory in the ultimate swing state of 2008. The Democratic candidate does especially well in the Republican-leaning suburbs of Denver – winning several outright and dampening margins in Douglas County and Colorado Springs.

More below.

Photobucket

Written off early as a sure Republican victory, Colorado surprises pundits in 2004 with a surprisingly strong Democratic performance. It is one of the few states where Democrats do better than in 2000 as they pick up the 2000 Ralph Nader vote.

______________________________________________________

Photobucket

Governor George W. Bush performs well throughout the Rocky Mountains in 2000, and Colorado is no exception. With Green Party candidate Ralph Nader pulling off a substantial bloc of liberal voters, Mr. Bush even cracks the Democratic “C” that composes the Democratic base of Colorado.

______________________________________________________

Photobucket

Conservative Colorado returns to form in 1996; President Bill Clinton loses the state by the barest of margins as conservative Ross Perot voters go Republican. Republican Bob Dole wins based off Republican strength in Colorado Springs and rural Colorado.

______________________________________________________

Photobucket

Surprise! – reliably Republican Colorado votes Democratic for the first time in a generation, and for the first time in a competitive race since the days of Harry Truman. To be fair, this map somewhat overstates Democratic strength: Republican margins are dampened by Ross Perot’s strength amongst conservatives.

–Inoljt, http://mypolitikal.com/  

Missouri Redistricting (Updated!)

I don’t know much about Missouri politics, but I do know the state is ending up with eight districts (down one) after redistricting, and Democratic Gov. Jay Nixon gets the opportunity to veto any map that is submitted by the legislature. So, I drew up a quick-and-dirty map.

I think Nixon and the Democrats are likely to settle for a 2-5-1 map. Anything better for the Democrats isn’t going to pass muster in the legislature, and anything better for the Republicans is going to get vetoed.

MO-01 (blue, safe Democratic)

Democratic Rep. William Lacy Clay gets to keep his safe urban district, which remains narrowly minority-majority (48% white, 47% black). Not much to add here. I definitely don’t think the northward excursion into St. Charles County will be enough to give a Republican an opening, especially with the racial demographics staying pretty much as is. If Clay gets to draw his own district, it might end up more confined to St. Louis City than in this drawing, but I think Nixon will be talking to Clay and other African American legislators to ensure a 2-5-1 map. If he can keep them safe, there’s no real reason for them to throw Democratic Rep. Russ Carnahan in MO-03 to the wolves altogether.

MO-02 (green, likely Republican)

This wealthy, white suburban district, currently held by Republican Rep. Todd Akin, has been consolidated somewhat. I think he should retain it barring a stern Democratic challenge, although a Democrat with suburban appeal might be able to make him sweat considering the lack of ruby-red rural areas. And I don’t know exactly where Rep. Carnahan lives, but if he and Akin are drawn into the same district, that would be a marquee battle.

MO-03 (purple, swing)

Assuming Rep. Carnahan runs in this district, I think he might have a tougher go of things than before. It includes a lot more of rural Missouri along the Mississippi River, though it includes enough of St. Louis and its suburbs to remain competitive. Republican Rep. Jo Ann Emerson has also been drawn into this district, so it’d be a classic urban-rural matchup.

MO-04 (red, safe Republican)

Rep.-elect Billy Long should be able to keep this seat Republican despite having a lot of new territory to cover.

MO-05 (yellow, likely Republican)

Republican Rep.-elect Vicki Hartzler gets some new ground, too, including most of the current MO-07, but I don’t really see this district swinging either way, maybe unless Democratic Rep.-elect Ike Skelton ran again. But I doubt he will.

MO-06 (teal, safe Republican)

It was a bit of a pain to keep Rep. Blaine Luetkemeyer, the Republican congressman for the current MO-09 (which encompasses most of this district), in this district. He’d be fine here.

MO-07 (grey, safe Republican)

Republican Rep. Tom Graves overcame his stiffest challenge in 2008 with flying colors. He’s solid here, despite this district including so much of (suburban) Jackson County. No reason to think he’s not safe.

MO-08 (slate blue, safe Democratic)

This district is basically Democratic Rep. Emanuel Cleaver’s current MO-05, urban Jackson and Clay counties stealing a few precincts from the urban parts of Cass and Platte counties. Cleaver should be just fine here.

Thoughts? Expertise from more Missouri-savvy SSPers?

Colorado Bipartisan Map (Updated!)

Cross posted on my blog http://frogandturtle.blogspot….

By winning one race by only 157 votes, Republicans control one house of the Colorado State Legislature so Democrats do not hold the trifecta in Colorado anymore. So instead of a possible Democratic gerrymander where they could retake the 3rd and 4th districts, the Democrats will probably end up with a bipartisan incumbent protection which is more favorable to the Republicans. The new Republicans may feel vulnerable because many of the new ones are in marginal districts they won in a very Republican year so the Democrats might work out a deal at protecting those Republicans in exchange for controlling congressional redistricting. That is not very likely though and I drew this map assuming it is a bipartisan deal. Ed Perlmutter (D) of Colorado’s 7th district is strengthened as well as newly elected Scott Tipton (R) of Colorado’s 3rd district and Cory Gardner (R) of Colorado’s 4th Congressional district. In 2002, Colorado was 5-2 Republican and in 2008, it shifted to 5-2 Democratic. The Republicans have the majority in the delegation now though with 4-3. Although Republicans came back a bit in 2010, I still think Colorado is trending Democratic due to Democrats moving into the Denver area from California. This movement could make districts such as the 6th competitive in the future, but for now, all incumbents will be much safer. Now, here are the maps:

link for current maps: http://www.nationalatlas.gov/p…

Photobucket

Denver area

Colorado’s 1st Congressional District: Diana DeGette (D) Blue

Obama won 70% (estimate)

Demographics: 8% African American, 37% Hispanic, 49% White

Old Demographics: 10% African American, 33% Hispanic, 52% White

Major Cities: Denver, Barr Lake

Status: Safe Democratic

DeGette’s district actually becomes a bit more Republican. I removed the Democratic suburbs around Englewood and replaced them with more moderate suburbs such as Brighton and Barr Lake. DeGette may not like having the new territory (and she even loses some Denver neighborhoods) but since the district is still mostly in Denver, she should have no problems at all facing reelection. Her district is now the only minority majority district in Colorado.

Colorado 2 Jared Polis (D) Green

Obama won 66% (estimate)

Demographics: 15% Hispanic, 80% White

Old Demographics: 18% Hispanic, 76% White

Major Cities: Boulder, Broomfield, Aspen

Status: Safe Democratic

Polis was already safe but his district becomes a Democratic vote sink to shore up the 3rd district now held by Scott Tipton (R). If Democrats had the trifecta here, they could have unpacked this district to make the 3rd district Democratic enough for John Salazar (D) to retake but as it is, the 2nd will take Democratic areas out of the 3rd. The 2nd loses all of Adams and Larmier Counties. The 2nd is more of a Rocky Mountain district now by picking up Democratic ski resort counties such as Routt (Steamboat Springs,) Pitkin (Aspen,) and Gunnison (Crested Butte.)

Photobucket

North Colorado

Photobucket

South Colorado

Colorado 3 Scott Tipton (R) Purple

McCain won 52% (estimate)

Demographics: 22% Hispanic, 73% White

Old Demographics: 22% Hispanic, 73% White

Major Cities: Pueblo, Grand Junction

Status: Likely Republican

Under a bipartisan plan, Tipton will be strengthened but due to the current demographics, strengthening Tipton is difficult without making convoluted lines or putting the 4th district Republican in jeopardy. I strengthened Tipton by removing Pitkin County (Aspen) as well as some other ski areas that I put in the 2nd. I added conservative Park County and a few conservative rural counties in southeastern Colorado. Obama also over performed the district’s usual Democratic percentage here due to high turnout in the ski areas but the district may become competitive again if Hispanics keep trending Democratic. This would be an opening for Salazar who is Hispanic and could do win enough Hispanics to beat Tipton. Salazar has an uphill battle though with the ski areas in the 2nd district though.

Colorado 4 Cory Gardner (R) Red

McCain won 52% (estimate)

Demographics: 18% Hispanic, 78% White

Old Demographics: 19% Hispanic, 76% White

Major Cities: Fort Collins, Greeley, Lamar

Status: Lean Republican

Due to population purposes, strengthening this district was difficult but I still made Gardner safer. I removed some Democratic areas in Adams and Boulder Counties. The district needs to shed territory anyway due to population growth but I added Elbert County as well as the conservative rural parts of Adams and Arapahoe Counties. Betsy Markey (D) who held this district from 2008 to 2010 might be able to win in a Democratic year here but the district’s changes will make winning harder for her.

Colorado 5 Doug Lamborn (R) Yellow

McCain won 59% (estimate)

Demographics: 5% African American, 13% Hispanic, 76% White

Old Demographics: 5% African, 13% Hispanic, 75% White

Major Cities: Colorado Springs, Castle Rock

Status: Safe Republican

At a first glance, this district appears to undergo major changes but population wise, it does not. It just loses some rural counties to the west to make the 3rd district more Republican while picking up a large portion of Douglas County. Lamborn was already safe with strongly Republican Colorado Springs in his district but he is just as safe now, if not safer.

Colorado 6 Mike Coffman (R) Teal

McCain won 52% (estimate)

Demographics: 9% Hispanic, 82% White

Old Demographics: 8% Hispanic, 84% White

Major Cities: Parker, Centennial

Status: Likely Republican

Coffman’s district says pretty similar demographically but his district becomes more difficult to hold. He picks up a large portion of Lakewood which formally was in the Democratic leaning 7th district while losing part of heavily Republican Douglas County. Although Coffman may be safe now, Jefferson and Araphaoe Counties are becoming more Democratic and now that they have more people in the district, Coffman may be in trouble in the end of the decade. That should however give him enough time to become entrenched in his district so he can fend away any challenge. The Republicans probably want Coffman to have more territory but that will be hard because the 3rd and 4th districts need their Republican areas.

Colorado 7 Ed Perlmutter (D) Orange

Obama won 62% (estimate)

Demographics: 7% African American, 27% Hispanic, 60% White

Old Demographics: 6% African American, 26% Hispanic, 61% White

Major Cities: Aurora, Lakewood, Arvada

Status: Safe Democratic

Although Obama won 59% under the current lines, the district was originally drawn as a swing district so Perlmutter will probably have a safer district on his wish list. This is what the new map does by adding in a few Denver neighborhoods. It also picks up more of Democratic Aurora while losing the less Democratic parts of Lakewood. Perlmutter also gains more of Adams County by picking up more of Westminister although he loses the rural eastern part to the 4th district. Perlmutter should be much safer, although he seemed to be doing fine already.

Updated:

After looking at the suggestions, here is my new version of Colorado:

Photobucket

Colorado

Photobucket

Denver area

Colorado 1

10% African American, 39% Hispanic, 46% White

(minority majority!)

Colorado 2

13% Hispanic, 81% White

I send it to Fort Collins to help shore up the 4th but Polis should be safe since he still has Boulder, he picked up Routt County and Fort Collins went for Obama.

Colorado 3

22% Hispanic, 73% White

This district is now basically split by picking up Eagle County.

Colorado 4

19% Hispanic, 77% White

This district is now safely Republican with the loss of Fort Collins and the inclusion of Douglas County.

Colorado 5

6% African American, 13% Hispanic, 75% White

The lines are basically the same as the old district.

Colorado 6

9% Hispanic, 83% White

Colorado 7

5% African American, 25% Hispanic, 63% White

This district gets a bit whiter but picks up some white parts of Denver so this district is more Democratic than it looks.  

By what margin will Bob Shamansky win?

View Results

Loading ... Loading ...

2010 Census Reapportionment Numbers

The Census Bureau has released its 2010 reapportionment numbers. All of today’s data dump can be seen here; the most important items of data are here, in the form of the map showing today’s winners and losers.

If this graph looks familiar, I’m using the last few rounds of Election Data Services projections as a yardstick for the actual results. (Kudos to them — or to the Census Bureau’s annual estimates, really. They basically nailed it.)


State Actual 2010 2009 2008 2007
Arizona 1 1 1 / 2 2 2
California 0 0 -1 / 0 -1 / 0 0 / 1
Florida 2 2 1 1 / 2 1 / 2
Georgia 1 1 1 1 1
Illinois -1 -1 -1 -1 -1
Iowa -1 -1 -1 -1 -1
Louisiana -1 -1 -1 -1 -1
Massachusetts -1 -1 -1 -1 -1
Michigan -1 -1 -1 -1 -1
Minnesota 0 0 -1 -1 -1 / 0
Missouri -1 -1 0 -1 -1
Nevada 1 1 1 1 1
New Jersey -1 -1 -1 -1 -1
New York -2 -2 -1 -1 -2
North Carolina 0 0 0 0 / 1 0 / 1
Ohio -2 -2 -2 -2 -2
Oregon 0 0 0 0 / 1 1
Pennsylvania -1 -1 -1 -1 -1
South Carolina 1 1 1 1 0 / 1
Texas 4 4 3 / 4 4 4
Utah 1 1 1 1 1
Washington 1 1 1 0 0

A few various other tidbits shared at today’s news conference: the fastest growth rates, among states, were Nevada, Arizona, Utah, Idaho, and Texas. Slowest growth were Michigan (the only one to decline since 2000), Rhode Island, Louisiana, Ohio, and New York. With a national population of 308,745,538, the average House district will have 710K constituents (up from 646K in 2000).

Gentlemen, start your redistricting engines!

UPDATE: Courtesy of Jeffmd, we’ve got the last 15 and first 15 (in other words, which states were most on the bubble, in order). Minnesota was the narrowest escapee, holding its 8th seat at North Carolina’s expense by less than 15,000 people.


# Last 15 # Next 15
435th Minnesota 8th 436th North Carolina 14th
434th California 53rd 437th Missouri 9th
433rd Texas 36th 438th New York 28th
432nd Washington 10th 439th New Jersey 13th
431st Florida 27th 440th Montana 2nd
430th South Carolina 7th 441st Louisiana 7th
429th Georgia 14th 442nd Oregon 6th
428th California 52nd 443rd Ohio 17th
427th Pennsylvania 18th 444th Virginia 12th
426th Texas 35th 445th California 54th
425th New York 27th 446th Illinois 19th
424th Michigan 14th 447th Texas 37th
423rd Illinois 18th 448th Massachusetts 10th
422nd California 51st 449th Pennsylvania 19th
421st Alabama 7th 450th Florida 28th

Census Reapportionment Predictions Thread

At 11am Eastern on Tuesday, the Census Bureau will release population data which will tell us how the House of Representatives will be reapportioned. What are your predictions for which states will gain seats – and which will lose? As a guidepost, you can check out Election Data Services’ most recent projection here. Have at it!