This is my first diary post using Dave’s App, so any suggestions are welcome 🙂
I tried to create a slight Democratic Gerrymander of Florida. I didn’t follow VRA very much, so I will be working to make a VRA map with 2 AA majority districts and 3 hispanic majority districts. I don’t believe the DOJ will require a 3rd in North Florida (Corrine Browns awful district.)
But being able to basically ignore the VRA in Florida opens amazing opportunities, especially in South FL. And luckily, some of the districts around the Tampa Bay area and a few others may end up being the actual districts with the new Fair Districts initiative being passed.
So, here are my maps:

Panhandle:
CD1 in Blue: It’s pretty hard to do anything here unless you want to send an arm from CD2 to to suck up Pensacola voters, but that would just look to crazy. This district is Safe Republican for the next decade at least.
76% White, 13% Black, 4% Hispanic
Rating: Safe R
CD2 in Green: This district is based in Tallahassee, and differs from the current district because it extends further north and east (Repubs drew an arm from Andrew Crenshaws district on the GA border over into CD2 to suck up Blue Dog voters and take out Allen Boyds home town in Monticello)
Here, I put a lot of traditionally Dem voting areas (Wakulla and Jefferson counties) along with very Democratic Leon county. This district is probably around even PVI, and I can easily see a Dem winning this (probably a moderate).
68% White, 24% Black, 4% Hispanic
Rating: Tossup

North Central FL and Jacksonville:
CD3 in Purple: This is a Gainesville based district. I toyed with trying to tie this to Tallahassee or Jacksonville, but decided to just give this district traditionally Democratic Madison county in the northwest part of the district, heavily Dem Alachua county and high AA parts of Ocala in the southern part of the district, and also extends over to Palatka in the east down through hispanic De Leon Springs. It has enough of an AA population along with the University of Florida to make it a competitive district. I am fairly unsure of what Obama % this district would be, but I think another fairly moderate Dem could easily hold this district barring another 2010.
70% White, 19% Black, 7% Hispanic
Rating: Tossup
CD4 in Red: This district sucks up heavily Republican suburbs of Jacksonville including all of Nassau county. It stretches further south to suck up rural white populations away from the east coast.
82% White, 8% Black, 5% Hispanic
Rating: Safe R
CD5 in Yellow: I decided to let Jacksonville have it’s own district, but at the same time keep it competitive for Dems. It’s only 55% white, but the Jacksonville area is very racially divided. However, with some liberal whites, a high AA populations, and some hispanics, this district will also probably be very competitive. It all depends on AA turnout in the city.
55% White, 34% Black, 6% Hispanic, 3% Asian
Rating: In Presidential years – Lean D In off years- Tossup
CD6 in Blue-Green: This district was designed to be as Dem as possible on the east coast. It takes in fairly wealthy beach towns, and heavily AA areas like Titusville and Holly Hill. It extends over towards Orlando to pick up heavily minority Sanford.
74% White, 12% Black, 10% Hispanic
Rating: Lean D
CD7 in Grey: I love this district. It covers heavily rural and Republican areas all through the big bend and central part of the state.
83% White, 7% Black, 8% Hispanic
Rating: Safe R
I’ll come back to CD 8 after the Tampa area.

Behold, Tampa!:
CD9 in Cyan: This is a solely Tampa based district and is plurality-white. It doesn’t include all of the New Tampa area (which is technically part of the city.) It stretches down a bit to take in Gibsonton and Riverview, and east to take in the diverse Brandon area and heavily AA Progress Village and Clair Mel City.
49% White, 21% Black, 25% Hispanic
Rating: Safe D
CD10 in Magenta? / Pink: A Tampa suburb district. This takes in Republican leaning areas in Pasco, down through heavily R Sun City, absorbing the rest of the R leaning Tampa suburbs.
72% White, 7% Black, 16% Hispanic
Rating: Likely R
CD11 in Pale Green: St. Petersburg district. If you look closely at the current district map, the actual city of St. Pete is gerrymandered out of this district, and linked to downtown Tampa and Bradenton to the south by water (awful.) So adding downtown St. Pete makes this district much more Dem friendly, considering it is already a Tossup. Once Bill Young retires, this would easily go D.
76% White, 12% Black, 7% Hispanic
Rating: Lean D after Young retires.
CD12 in Light-Bluish: Coastal Pasco and Hernando and Northern Pinellas. This district takes in Greek populations north of Clearwater, and suburban R leaning Pasco and Hernando. Bilirakis would probably run here and win, with his family name. As for the long term, this district may slowly trend D as its population explodes and suburbs continue to become slightly more D friendly.
Rating: Likely R, possibly Lean R by the end of the decade.

Now for the Orlando Area:
CD8 in Light Blue: This district is majority-minority when adding all minority groups. It includes the western half of Orlando, and heavily hispanic areas to the south and west of downtown Orlando. The Dem primary here would be interesting.
47% White, 25% Black, 20% Hispanic, 5% Asian
Rating: Safe to Likely D
CD14 in Ugly Brown/Green: I’m really unsure of the Obama % here. There is a decent minority vote here, along with the eastern half of downtown Orlando. I know this area is quickly growing, and becoming more D as the Puerto Rican population skyrockets. This district also slides east to pickup the space center and Merritt Island.
70% White, 7% Black, 17% Hispanic
Rating: Unsure… could be between Lean R and Lean D.
CD15 in Orange: One of my more gerrymandered districts that I am proud of. It is barely majority white. This takes in south Orlando, Kissimmee, St. Cloud, along with downtown Winter Haven and Lakeland. It could be tweaked maybe to make it majority-minority.
50% White, 12% Black, 33% Hispanic
Rating: Likely D

SW Florida and South Central FL:
CD 13 in Tan: I apologize for the colors here. This districts includes all of Brandenton, Sarasota, Venice, Punta Gorda, and Port Charlotte. Bye-bye, Vern Buchanan. He might run in CD10 or CD16 instead.
81% White, 7% Black, 10% Hispanic
Rating: Likely D
CD16 in Bright Green: Republican vote sink extraordinaire. Probably my favorite R vote sink in FL. This district sucks in all of the R heavy and R leaning areas from Hillsborough County all the way down through the spine of central FL, ending at Lake Okeechobee.
73% White, 9% Black, 16% Hispanic
Rating: Safe R
CD17 in Purple: Another fun east coast district, including Melbourne all the way down to Fort Pierce. Not too sure about this district either… I know the coastal areas are fairly swingy, but I assume Obama carried them narrowly, but lost the inland parts I put in CD16.
74% White, 12% Black, 10% Hispanic
Rating: Lean D to Tossup
CD18 in Pale Yellow: This district takes some very low population inland Everglades areas, and eat up part of the East coast and we approach the Miami area. I believe a lot of the white population here is wealthy, and also I think we are starting to get into some Jewish population areas. If anyone wants to help fill me in on the type of white population that lives here that would be awesome!
63% White, 17% Black, 16% Hispanic
Rating: Lean D to Tossup?
CD19 in Lime Greenish: This district includes Palm Beach. It has a decent AA and hispanic population (that I don’t think is too Cuban heavy yet.) We’re also getting into the more Jewish populated areas.
61% White, 14% Black, 22% Hispanic
Rating: Likely to Lean D
CD20 in Pale Pink: Fort Myers and Cape Coral. These heavily populated areas are Lean D, considering they are a huge hot-spot for retirees. This district is probably R leaning, but I may be wrong and it could elect the right D.
77% White, 6% Black, 14% Hispanic
Rating: Lean R
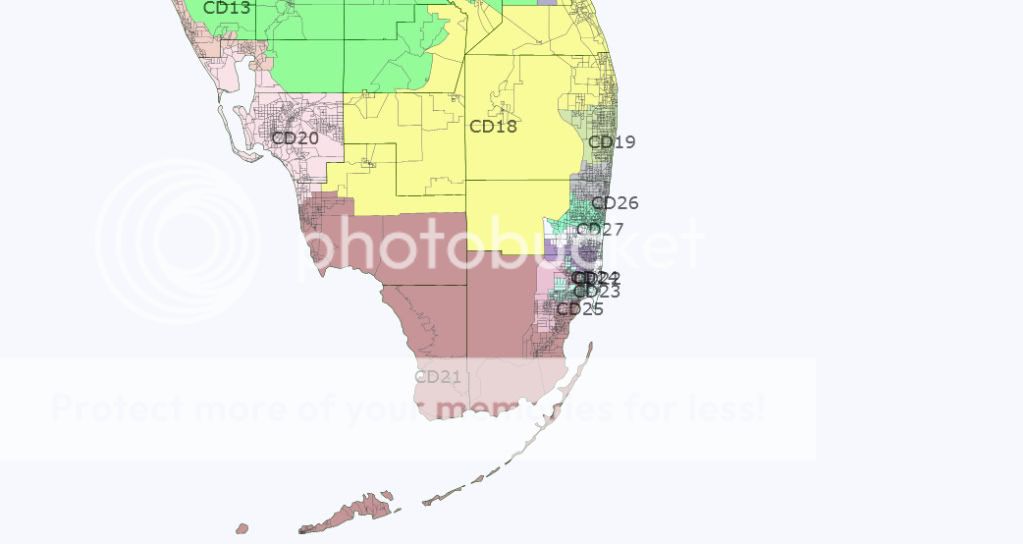
South Florida!:
CD21 in Brown: How do you make Rs in Florida pissed? Make them have a nasty primary between old white people in Naples and Cubans near Miami. Should be an R district, until the Cuban populations shift to Dems (hopefully soon)
48% White, 14% Black, 35% Hispanic
Rating: Likely R for now.
CD26 in a Greyish color below the Lime green district: Boca!
I apologize again for the picture here. This district should be heavily Jewish with a 12% AA population. I don’t think this district will leave the D column.
69% White, 12% Black, 15% Hispanic
Rating: Likely D
CD27 in Aquamarine: Ft. Lauderdale. This district was my leftovers kind of. It’s extremely diverse, but with over 30% AA and most of the white population being Jewish, it seems like it should be a Dem district.
42% White, 34% Black, 19% Hispanic
Rating: Safe to Likely D

Miami Area:
CD22 in White: Hollywood. A barely white majority district, diluting some of the Cuban power in the area. With the Jewish population and % AA population combined, it should be Lean D.
50% White, 8% Black, 36% Hispanic
Rating: Lean D
CD24 in Purple: North Miami. This is the only AA majority district I have here, so the VRA would be sad.
14% White, 52% Black, 30% Hispanic
Rating: Safe D

A closer look at the South Miami Area:
CD23 in Teal-ish color: Miami Cuban areas. Can’t get much more Cuban than this district.
9% White, 6% Black, 83% Hispanic
Rating: Safe R for one of the Diaz-Balarts or Ms. Ileana.
CD25 in Light Pink: Hialeah. This sucks in Hialeah and makes a C shape to suck in more Cuban populations to the south.
14% White, 5% Black, 79% Hispanic
Rating: Safe R