Help Support Dave’s Redistricting App

(Bumped – promoted by DavidNYC)

Guys, it’s time to shell out to help Dave’s Redistricting App. I mean it.

For two years, countless Swingnuts have drawn innumerable maps using Dave’s App, which filled a huge void in an enormously crucial way. Indeed, as we wade further and further into redistricting season, it’s almost impossible to imagine what things would be like without the app. If it weren’t for one man’s vision, energy, talent, and dedication, we’d still be mucking around with Microsoft Paint. In short, Dave’s has been a total game-changer for us, and we owe him a great deal.

Until now, we haven’t had a good way to show our appreciation for Dave’s generosity, but fortunately Dave’s app recently became a project of Progressive Congress – and we can support his efforts through his new partner to improve and expand the app. As Dave himself explained:

This means that more members and visitors of Progressive Congress will get to know about DRA and that more users of DRA will get to know about Progressive Congress. This means that the Progressive Congress team will be providing advice and guidance for DRA. (Some of Darcy [Burner]’s suggestions have already been included in the app, in fact.) This means that Progressive Congress and DRA will be teaming up to help you better understand what’s going on with redistricting and what you can do about it. And this means working together to make government better for the people!

In seven-and-a-half years of running SSP, I don’t think I’ve ever solicited money for anyone or anything other than Democratic candidates running for office. This is going to be my one big exception, and I’m going to be blunt here:

If you’ve ever drawn a map with Dave’s App, or enjoyed a diary that featured maps drawn with the app, you need to plunk down some change to support Dave.

It’s important that we support Dave’s hard work over the last two years and his continued work in the future, so any amount is appreciated. I know you can skip Starbucks for a week to find $5 or $10. (If a monetary contribution is genuinely beyond your means, then you should contact Dave to see how you can help with adding new data to the app.) And here’s a nice side-benefit: All contributions are tax-deductible.

I just threw down $100, and I hope everyone else here joins in. While there are many things which have made the Swing State Project a great site, I think it’s safe to say that Dave’s Redistricting App is definitely one of them, and I’m proud to support him. I hope you’ll do the same.

UPDATE: I just got a report from Progressive Congress, and we’ve raised $590 from 18 people so far. I’d love to hit $600 and 20 donors. Who can put us over the top?

What If Mexico Was Part of the United States?

The previous two posts in this serious dealt with what would happen if Canada’s electoral votes were added to the United States. This post will examine what would happen if the same occurred with Mexico.

A note to all Mexican readers: this post was written for serious political analysis along with it. It is not meant to offend, and sincere apologies are offered if any offense at all is taken.

More below.

Mexico is a lot bigger than Canada. Canada has a population of 34 million; Mexico has a population of 112 million. Indeed, it’s one of the most populous countries in the world. The effect of adding Mexico to the United States would have far more of an impact than adding Canada.

One can calculate the number of electoral votes Mexico has this way. The first post in this series noted that:

A state’s electoral vote is based off the number of representatives and senators it has in Congress. For instance, California has 53 representatives and 2 senators, making for 55 electoral votes.

The United States Census estimates its population at approximately 308,745,538 individuals. The House of Representatives has 435 individuals, each of whom represents – on average – approximately 709,760 people. If Canada was part of the United States, this would imply Canada adding 48 (rounding down from 48.47) representatives in the House.

This is a simplified version of things; the process of apportionment is quite actually somewhat more complicated than this. But at most Canada would have a couple more or less representatives than this. It would also have two senators, adding two more electoral votes to its 48 representatives.

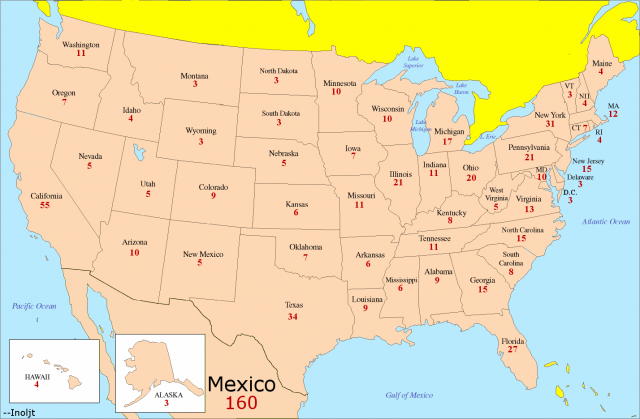
Mexico’s population in 2010 was found to be exactly 112,322,757 individuals. Using the same estimates as above, one would estimate Mexico to have 158.25 House representatives. Adding the two senators, one gets about 160 electoral votes in total:

Photobucket

This is obviously a lot of votes. For the sake of simplification let’s also not consider Mexico’s powerful political parties in this hypothetical.

How would Mexico vote?

Well, it would probably go for the Democratic Party (funny how that tends to happen in these scenarios). This is not something many people would disagree with. Most Mexican-Americans tend vote Democratic. The Democratic platform of helping the poor would probably be well-received by Mexicans, who are poorer than Americans. Moreover, the Republican emphasis on deporting illegals (often an euphemism for Mexican immigrants, although some Republicans make things clearer by just stating something like “kick out the Mexicans”) would probably not go well in Mexico.

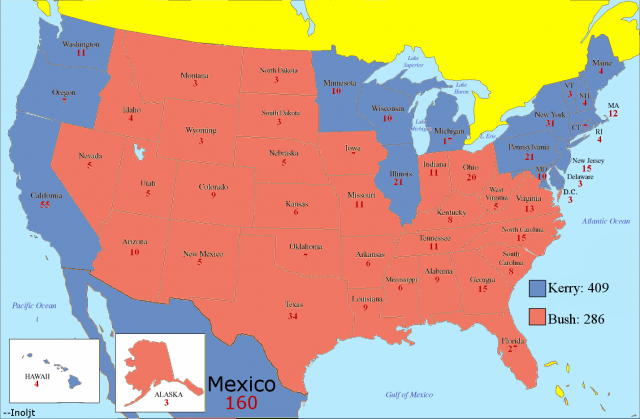
Here’s what would happen in the 2004 presidential election, which President George W. Bush won:

Photobucket

Senator John Kerry wins a pretty clear victory in the electoral vote. He gains 409 electoral votes to Mr. Bush’s 286 and is easily elected president.

What states would Mr. Bush need to flip to win?

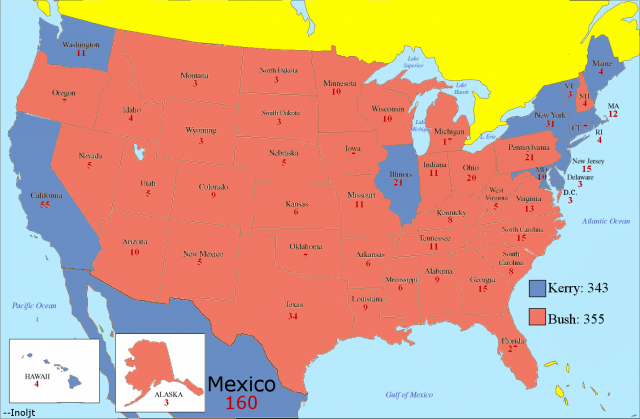
In the previous post, where Canada was added to the United States, Mr. Bush would merely have needed to flip one: Wisconsin. Given his 0.4% loss in the state, this would require convincing only 6,000 voters to switch.

Mexico is a lot harder. In order to win, Mr. Bush needs to shift the national vote 4.2% more Republican. This flips six states: Wisconsin, New Hampshire, Pennsylvania, Michigan, Minnesota, and finally Oregon (which he lost by 4.2%). They go in order of the margin of Mr. Bush’s defeat to Mr. Kerry:

Photobucket

But there’s a caveat here: in this scenario the entirety of Mexico is assumed to only have two senators. The fifty states have 435 representatives and 100 senators, making for 535 electoral votes in total (plus Washington D.C.’s three). Mexico, on the other hand, has 158 representatives and two senators, making for only 160 electoral votes. Obviously, Mexico’s influence is strongly diluted.

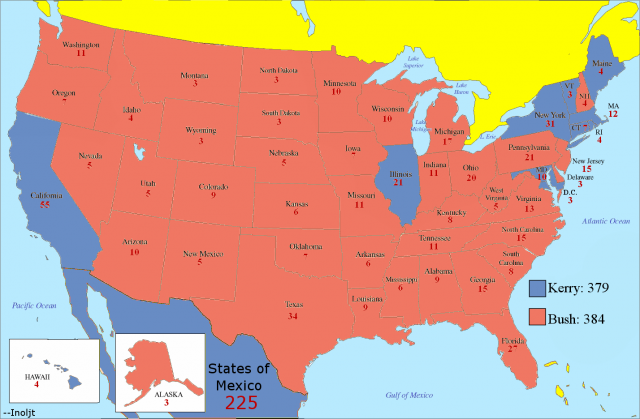
Mexico itself is organized into 31 states and one federal district. Assume that instead of the entire country voting as one unit, Mexico is divided in the electoral college into these districts. Each Mexican state (and Mexico City) would receive two senators, giving Mexico 222 electoral votes instead of 160.

But that’s not all. There are several states in America – Wyoming, for instance – whose influence is magnified due to their low population. The “Wyomings” of Mexico are Baja California Sur, Colima, and Compeche – which each have less than a million residents. Overall, this would probably add three more electoral votes to Mexico.

This means that Mr. Bush has to flip three more states to win:

Photobucket

New Jersey, Washington, and Delaware go Republican under this scenario. To do this, Mr. Bush would have to shift the national vote 7.59% more Republican (the margin by which he lost Delaware).

One can see that Mexico has a far more powerful effect than Canada; a double-digit Republican landslide has turned into a tie here. That’s what happens when one adds a country of more than one hundred million individuals.

Before Democrats start celebrating however, one should note that this the hypothetical to this point has been in no way realistic. It assumes that the residents of America will not alter their voting habits in response to an extremely fundamental change.

The next post explores some conclusions about what the typical election would look like if the United States became part of Mexico.

–Inoljt

Massachusetts Redistricting: Eliminating Tierney

Right now, Massachusetts redistricting is just a big guessing game. John Olver, the oldest member of the Massachusetts delegation and arguably the easiest to get rid of, has said he’s running for re-election, and his allies in the state legislature probably aren’t rushing to press him for retirement. Speculation has turned to which member of Congress will run against Scott Brown, because that would solve the problem of whose district to eliminate. But what if no one runs against him? None of the Mass congresscritters are really that ballsy, and if rumors are true that John Kerry is going to be tapped for SoS and create an easier shot at an open seat, it makes sense that they would be biding their time. So what if every incumbent files for re-election? What would the legislature do?

More after the flip.

Although I admittedly have little to back up this theory, I propose the possibility that John Tierney could be the lucky winner. Fairly or unfairly, he has an ethical cloud over him because of his wife, and he represents the second-most Republican district in the state. While the folks on Beacon Hill are far from squeaky clean themselves, the ethics problems combined with an aversion to having to prop him up should his problems get worse could provide motivation to eliminate his district. Admittedly, given the location of the district, it’s a bit hard to slice it up in a way that won’t give Tierney a shot at re-election. But this map should make his life a lot harder, and his ethics problems combined with establishment support for the other nine congresscritters and his district being split up should mean that there will be no Tierney in 2013.

In addition to eliminating Tierney, this map also attempts to shore up relatively shaky Democratic incumbents.

Image Hosted by ImageShack.us

Image Hosted by ImageShack.us

Image Hosted by ImageShack.us

Image Hosted by ImageShack.us

Image Hosted by ImageShack.us

MA-01 Incumbent: John Olver (D-Amherst

This district mostly stays the same, although it drops Westfield and West Springfield and gains the college towns of Northampton and South Hadley, in addition to some R-friendly Worcester suburbs. In the end it should be about a wash and not much changed from the current D+14. Still safe, even for someone as liberal as Olver.

MA-02 Incumbent: Richard Neal (D-Springfield

Drops its stupid tail into Northampton and South Hadley and gains West Springfield and Westfield, as well as some more Worcester suburbs. It probably becomes a bit more Republican, but nothing too intense, going from D+9 to maybe D+6 or 7 (note that the most Democratic Republican-held district outside of IL, even after 2010, is D+4, and this area is not nearly as traditionally Republican as PA-06 or IL-10). Neal’s a big boy and he clearly wants to appeal to Republicans with his douchey praise of Scott Brown and conservadem record, so he’ll be alright.

MA-03 Incumbent: Jim McGovern (D-Worcester)

Drops some more Worcester suburbs, gains Framingham/Natick, and now contains the vast majority of Fall River. It was already D+9 and gets even safer. Sorry, Republicans, this one’s Safe D even in a 2010 repeat, and might have even voted for Coakley (I’m not sure).

MA-04 Incumbent: Barney Frank (D-Newton)

This is my favorite district just because it has 0 population deviation. Delicious! Frank represents a D+14 district and won by double digits in the worst Dem year imaginable against a legitimate opponent, so he can afford to take one for the team. He drops most of his part of Fall River and gains some conservative Plymouth County towns. Nevertheless, he retains the liberal Jewish Democratic strongholds of Brookline, Newton, and Sharon as well as the working-class Dem cities of Taunton and New Bedford. He even gains a few precincts from liberal Needham. At the very worst this should be like D+9 or 10, still more than safe.

MA-05 Incumbent: Niki Tsongas (D-Lowell)

And now we start with the dismantling of Tierney. I didn’t want to weaken Tsongas too much; although she won by double-digits in 2010, that was the second-weakest incumbent congressman performance in Massachusetts, only behind Barney Frank. And while Barney Frank faced a fairly strong challenger, Tsongas only had to deal with a some dude. Besides, she won by a surprisingly narrow single-digit margin in her first election to the seat in 2007. So I gave her solidly Dem parts of Tierney’s district like Bedford and Newburyport while retaining heavily Hispanic Lawrence and liberal MetroWest suburbs like Acton and Concord, while adding new ones like Lexington and half of Waltham (including Brandeis University). Tsongas should be able to breathe easier now.

MA-06: Incumbent: John Tierney (D-Salem), Ed Markey (D-Malden)

And now the dismantling of John Tierney really begins. This district eats up Republican parts of Tierney’s old district, but also includes Tierney’s hometown of Salem as well as Democratic suburbs from Markey’s district like Medford, Malden, and Arlington. It also contains the other half of Waltham, including Bentley University. This district contains about ~250,000 people or so from Tierney’s district, but it should contain more from Markey’s (it also contains a few ten thousand people from Tsongas’). Given that Markey will have the establishment behind him and is a superior fundraiser (unlike Tierney, Markey wasn’t in a competitive race at all and still outraised Tierney more than 3-to-2), not to mention Markey’s part of the district is more Democratic and will have disproportionate pull in a primary, I wouldn’t call this a viable option for Tierney. After Markey beats Tierney, he should be golden in the general; even though this district will drop from D+15 to D+10 or 11, Markey won 2-1 in a year when many Dem incumbents in safe districts were held to below 60.

MA-07 Incumbent: Michael Capuano (D-Somerville)

Aside from the new 6th, this is the district with the most of Tierney’s territory. Again, it’s safe D in the general, as it adds heavily Democratic Lynn from Tierney’s district and retains Cambridge, Somerville, Allston-Brighton, Back Bay, and Fenway (bounded by JP to the south and Northeastern University’s campus to the east). All of those areas will have disproportionate pull in a primary, and with the exception of Lynn, they will all support Capuano. As with Markey, Capuano should easily dominate Tierney in fundraising, as he raised $3.7 million dollars in his unsuccessful Senate primary campaign (Tierney only raised about a million dollars in his whole 2010 House campaign). In 2006, when both Tierney and Capuano faced Some Dude opponents but were absolutely safe, Capuano outraised Tierney 3-2 despite representing the safer district. Don’t really see Tierney winning here either.

MA-08 Incumbent: Stephen Lynch (D-South Boston)

Drops Brockton and gains most of Boston from Capuano. Should be a wash PVI-wise, if anything it might get slightly more Democratic. Maybe Sonia Chang-Diaz can primary Lynch’s sorry ass now. Needless to say, if we’re looking at a wash or even improvement in a district that’s already D+11, the general is not an issue.

MA-09 Incumbent: William Keating (D-Quincy)

Helped by facing a flawed opponent in 2010, Keating overcame two indies siphoning the Dem vote to win by a semi-comfortable 5 points. He should be even more comfortable now that his district adds heavily Democratic Brockton.  

That’s it for the map. I would love to hear everyone’s comments and suggestions.

But wait! As a bonus, I present to you…the ScottBrownmander!

Isn’t it wonderful? Scott Brown, with his newfound and curiously politically convenient love of minorities, would agree. Scott just wants to see a minority congressman from Massachusetts so badly, he would do anything to make a minority-majority district, even creating an ugly gerrymander! Unfortunately for Scott, even this ultra-packed gerrymander is 40% white VAP, with the next highest groups being blacks at 25% and Hispanics at 20%. With such a splintered electorate, no way any one minority group can get enough votes to overcome the white plurality. Fortunately for Scott however, this map is okay! Turns out his goal is to pack Democratic minority voters into one district, not to ensure minority representation. Phew! Crisis averted.