With Texas looking to gain four seats after the Census, I decided to gerrymander Texas to protect the current twenty Republican representatives. In my plan, I try to create a realistic-looking map and I try to follow the VRA. In my opinion, there will need to be at least two, maybe three new VRA-protected Hispanic-majority seats. My plan draws two, but they’re not slam-dunks for Democrats, unless Arizona’s “papers, please” law mobilizes Hispanics to actually, well, vote. Republicans will pick up two of the new seats for sure, and probably the third.
With the GOP likely in control of the House, definitely the Senate, a quite possibly the governor’s mansion, this is what I think the trifecta might do.
In the end, only two white Democrats should survive this plan, unless Gene Green gets primaried by an ambitious Hispanic politician. Also, Ciro Rodriguez-who doesn’t even live there in the 23rd anymore-gets a pretty tough district.
In the end, this plan should result in a 26-10 Republican majority, while substantially protecting all Republican incumbents. At the end of the decade, though, this could change. The ideal population numbers are all within a 1000, meaning the districts can change a little to get to the ideal number, 0. There is 3,963 people who I can’t find on the map; they voted 62-38 for McCain.
After reading the write up, scroll down to see my summary at the end.
Please enjoy!
P.S. I worked forever on this, so I will go crazy if I see some b.s. diary go up and bump it down. Y’all know what I’m talking about.


METROPLEX

TX-3 PURPLE
Incumbent: Sam Johnson (R-Plano)
Counties: Collin
Cities of Note: Plano, Allen, Frisco, Wylie, McKinney
Obama: 38%
McCain: 61%
Old District (Obama-McCain): 42-57
White: 76 Black: 5 Hispanic: 10 Asian: 9 Native American: 0 Other: 0
Projected: Safe Republican
The district is completely based in Collin County, which has grown tremendously. Johnson is safe and will be succeeded by a conservative Republican if he retires.
TX-5 YELLOW
Incumbent: Jeb Hensarling (R-Dallas)
Counties: Anderson, Henderson, Wood, Rains, Cherokee (Part), Dallas (Part), Tarrant (Part), Kaufman (Part)
Cities of Note: Arlington, Mansfield, Dallas, Mesquite
Obama: 41%
McCain: 58%
Old District (Obama-McCain): 36-63
White: 71 Black: 13 Hispanic: 13 Asian: 4 Native American: 0 Other: 0
Projected: Safe Republican
TX-12 LIGHT BLUE
Incumbent: Kay Granger (R-Fort Worth)
Counties: Tarrant (Part), Wise (Part), Parker (Part)
Cities of Note: Fort Worth
Obama: 37%
McCain: 62%
Old District (Obama-McCain): 36-63
White: 67 Black: 5 Hispanic: 23 Asian: 5 Native American: 0 Other: 0
Projected: Safe Republican
The district gets smaller, but Granger should continue to be comfortable here.
TX-17 DARK BLUE
Incumbent: VACANT
Counties: Hood, Somerville, Johnson, Hill, Tarrant (Part)
Cities of Note: Arlington
Obama: 35%
McCain: 64%
Old District (Obama-McCain): 32-67
White: 77 Black: 7 Hispanic: 12 Asian: 4 Native American: 0 Other: 0
Projected: Likely Republican if Edwards runs; Safe Republican otherwise
Chet Edwards must be really annoying for Republicans. I drew a new Arlington-based district, with some of Edwards’ old exurban territory. Like I wrote, part of the DeLaymander’s success was that Democratic incumbents had to run in areas unfamiliar to them. As talented as he is, I don’t see Edwards winning in reflexively Republican urban areas in Tarrant County. Plus, Waco isn’t even in the district, so he’d have to move. This might finally dislodge him.
TX-24 DARK PURPLE
Incumbent: Kenny Marchant (R-Coppell)
Counties: Dallas (Part), Tarrant (Part), Denton (Part)
Cities of Note: Coppell, Irving, Dallas
Obama: 39%
McCain: 60%
Old District (Obama-McCain): 44-55
White: 65 Black: 7 Hispanic: 20 Asian: 8 Native American: 0 Other: 0
Projected: Safe Republican
TX-26 GRAY
Incumbent: Michael Burgess (R-Lewisville)
Counties: Denton (Part), Tarrant (Part)
Cities of Note: Denton, Lewisville, Frisco
Obama: 35%
McCain: 64%
Old District (Obama-McCain): 41-58
White: 80 Black: 5 Hispanic: 11 Asian: 4 Native American: 0 Other: 0
Projected: Safe Republican
TX-30 DALLAS ORANGY COLOR
Incumbent: Eddie Bernice Johnson (D-Dallas)
Counties: Dallas (Part), Tarrant (Part)
Cities of Note: Dallas, Fort Worth
Obama: 83%
McCain: 17%
Old District (Obama-McCain): 82-18
White: 22 Black: 52 Hispanic: 22 Asian: 3 Native American: 0 Other: 0
Projected: Safe Democratic
The district now goes into Tarrant to take in black-majority precincts to create a new VRA-protected black-majority seat in the Metroplex.
TX-32 ORANGE
Incumbent: Pete Sessions (R-Dallas)
Counties: Rockwall, Dallas (Part)
Cities of Note: Dallas, Garland, Richardson, Rockwall
Obama: 40%
McCain: 58%
Old District (Obama-McCain):
White: 71 Black: 7 Hispanic: 15 Asian: 6 Native American: 0 Other: 0
Projected: Safe Republican
Adding Rockwall County makes Sessions safer.
TX-33 DARKISH BLUE (Entirely in Dallas)
Incumbent: VACANT SEAT
Counties: Dallas
Cities of Note: Dallas
Obama: 67%
McCain: 32%
White: 25 Black: 17 Hispanic: 53 Asian: 4 Native American: 0 Other: 0
Projected: Safe Democratic
A new Dallas-based VRA-protected Hispanic seat.
HOUSTON AREA


TX-2 GREEN
Incumbent: Ted Poe (R-Humble)
Counties: Harris, Liberty, Orange, Jasper, Orange, Jefferson (Part)
Cities of Note: Humble, Baytown, Beaumont
Obama: 36%
McCain: 63%
Old District (Obama-McCain): 40-60
White: 68 Black: 15 Hispanic: 13 Asian: 3 Native American: 0 Other: 0
Projected: Safe Republican
Poe gets safer by subtracting a chunk of Beaumont and adding Jasper, Newtown, and Orange Counties. The Harris part of the district remains very conservative, so Poe should have no problems here until 2020 redistricting-or a sooner redistricting, if history is a guide.
TX-7 LIGHT GRAY
Incumbent: VACANT
Counties: Fayette, Harris (Part), Colorado (Part), Fort Bend (Part), Lavaca (Part)
Cities of Note: Houston
Obama: 40%
McCain: 60%
Old District (Obama-McCain): 41-58
White: 70 Black: 8 Hispanic: 14 Asian: 8 Native American: 0 Other: 0
Projected: Safe Republican
By splitting remaining territory in Harris, one can make two pretty-safe urban Republican seats based in Houston. A lot of this is Culberson’s old district, but I think he’d run in the new 36th, which contains his home and is one point more Republican. The district might be competitive eventually, but for now it’s safely Republican.
TX-8 LIGHTISH BLUE
Incumbent: Kevin Brady (R-The Woodlands)
Counties: Hardin, Tyler, Polk, San Jacinto, Walker, Grimes, Madison, Leon, Houston, Cherokee, Montgomery (Part), Jefferson (Part)
Cities of Note: Beaumont, Huntsville
Obama: 31%
McCain: 68%
Old District (Obama-McCain): 26-74
White: 75 Black: 13 Hispanic: 9 Asian: 2 Native American: 0 Other: 0
Projected: Safe Republican
When the district was drawn in the DeLaymander, it was designed to unseat any East Texas Democrats. Now that it has done so, I can stop wasting so many Republican votes. I split Brady’s base in Montgomery, and I added some Democratic precincts in Beaumont. Still, it’s insanely Republican, and Montgomery should continue to grow, making it even more so.
TX-9 TURQUOISE
Incumbent: Al Green (D-Houston)
Counties: Harris (Part), Fort Bend (Part)
Cities of Note: Houston
Obama: 76%
McCain: 23%
Old District (Obama-McCain): 77-23
White: 17 Black: 37 Hispanic: 34 Asian: 12 Native American: 0 Other: 1
Projected: Safe Democratic
TX-14 ARMY GREEN
Incumbent: Ron Paul (R-Lake Jackson)
Counties: Chambers, Matagorda, Jackson, Calhoun, Brazoria (Part), Harris (Part), Galveston (Part)
Cities of Note: Galveston, Baytown, Texas City, League City, Freeport
Obama: 37%
McCain: 62%
Old District (Obama-McCain): 33-66
White: 59 Black: 11 Hispanic: 27 Asian: 3 Native American: 0 Other: 0
Projected: Safe Republican
An urban-suburban-exurban leftovers district, Paul and his nutty views should be safe here.
TX-18 HOUSTON YELLOW
Incumbent: Sheila Jackson-Lee (D-Houston)
Counties: Harris
Cities of Note: Houston
Obama: 79%
McCain: 20%
Old District (Obama-McCain): 22-77
White: 18 Black: 46 Hispanic: 31 Asian: 4 Native American: 0 Other: 0
Projected: Safe Democratic
The 18th is another safe black-plurality district in Houston.
TX-22 BROWN
Incumbent: Pete Olson (R-Sugar Land)
Counties: Harris (Part), Fort Bend (Part), Brazoria (Part), Galveston (Part)
Cities of Note: Sugar Land, Pearland, Pasadena
Obama: 39%
McCain: 60%
Old District (Obama-McCain): 41-58
White: 63 Black: 8 Hispanic: 18 Asian: 11 Native American: 0 Other: 0
Projected: Safe Republican
The old DeLay seat, it gets smaller, but is still safe for Olson, who beat a great candidate in Lampson in 2008.
TX-29 GREENISH GRAY
Incumbent: Gene Green (D-Houston)
Counties: Harris
Cities of Note: Houston
Obama: 66%
McCain: 33%
Old District (Obama-McCain): 62-38
White: 18 Black: 11 Hispanic: 68 Asian: 2 Native American: 0 Other: 0
Projected: Safe Democratic
TX-36 YELLOWY ORANGE
Incumbent: John Culberson (R-Houston)
Counties: Harris
Cities of Note: Houston
Obama: 39
McCain: 60
Old District (Obama-McCain): 41-58 (7th District)
White: 64 Black: 8 Hispanic: 20 Asian: 8 Native American: 0 Other: 0
Projected: Safe Republican
See TX-7 for analysis.
AUSTIN/SAN ANTONIO

TX-10 PINK
Incumbent: Michael McCaul (R-Austin)
Counties: Lee, Burleson, Washington, Austin, Waller, Travis (Part), Montgomery (Part), Harris (Part)
Cities of Note: Austin, Conroe
Obama: 36%
McCain: 62%
Old District (Obama-McCain): 44-54
White: 72 Black: 9 Hispanic: 15 Asian: 4 Native American: 0 Other: 0
Projected: Safe Republican
Seeing how Montgomery County has grown tremendously since 2000, I split it up into two districts to help McCaul. The district loses some precincts in Austin and Harris County. If I were a Republican (I’m not), I’d feel pretty good about McCaul until 2020.
TX-20 BEIGE
Incumbent: Charlie Gonzalez (D-San Antonio)
Counties: Bexar
Cities of Note: San Antonio
Obama: 71%
McCain: 27%
Old District (Obama-McCain): 64-36
White: 14 Black: 7 Hispanic: 77 Asian: 1 Native American: 0 Other: 1
Projected: Safe Democratic
The district gets more Hispanic and more Democratic. Gonzalez should be, and will be, fine.
TX-21 DARK RED
Incumbent: Lamar Smith (R-San Antonio)
Counties: Kendall, Comal, Hays (Part), Travis (Part), Bexar (Part)
Cities of Note: San Antonio, Austin
Obama: 38%
McCain: 61%
Old District (Obama-McCain): 41-58
White: 74 Black: 3 Hispanic: 19 Asian: 4 Native American: 0 Other: 0
Projected: Safe Republican
Smith is entrenched and should be fine here. I’d be concerned about Travis County’s booming population down the road, but for now the Travis part is swingy or leans Republican. Safe.
TX-25 PINKISH RED
Incumbent: Lloyd Doggett (D-Austin)
Counties: Travis
Cities of Note: Austin
Obama: 71%
McCain: 27%
Old District (Obama-McCain): 59-40
White: 49 Black: 11 Hispanic: 34 Asian: 5 Native American: 0 Other: 0
Projected: Safe Democratic
Now entirely in Austin, Doggett is safe as can be.
TX-28 LIGHT URPLE
Incumbent: Henry Cuellar (D-Laredo)
Counties: La Salle, Frio, Atascosa, Webb (Part), Bexar (Part), Wilson (Part), Guadalupe (Part), Caldwell (Part), Bastrop (Part)
Cities of Note: Laredo, San Antonio, San Marcos, Bastrop
Obama: 53%
McCain: 46%
Old District (Obama-McCain): 56-44
White: 36 Black: 4 Hispanic: 57 Asian: 2 Native American: 0 Other: 0
Projected: Safe Democratic
The district changes a lot. It’s a lot more San Antonio heavy, and Cuellar’s home might not be even in the district. Still, it should elect a Hispanic Democrat,
TX-35 PURPLE
Incumbent: Ciro Rodriguez (D-San Antonio)
Counties: Mitchell, Nolan, Sterling, Coke, Runnels, Coleman, Concho, Schleicher, Menard, Sutton, Kimble, Edwards, Real, Kerr, Bandera, Bexar (Part), Guadalupe (Part), Caldwell (Part), Brown (Part)
Cities of Note: San Antonio, Seguin
Obama: 39%
McCain: 60%
White: 58 Black: 7 Hispanic: 31 Asian: 3 Native American: 0 Other: 0
Projected: Likely Republican
A new district in the San Antonio area, I combined a strip of San Antonio with Republican-leaning suburbs and parts of rural West Texas. Should be safe, unless Hispanics start voting. Rodriguez lives in the district I think.
FAJITA STRIPS

TX-15 ORANGE
Incumbent: Ruben Hinjosa (D-Mercedes)
Counties: Refugio, Goliad, Bee, Aransas, Jim Wells, Brooks, Hidalgo (Part), Cameron (Part), San Patricio (Part)
Cities of Note: McAllen, Harlingen
Obama: 62%
McCain: 37%
Old District (Obama-McCain): 60-40
White: 17 Black: 1 Hispanic: 81 Asian: 1 Native American: 0 Other: 0
Projected: Safe Democratic
Probably now the most Hispanic district in the nation, this would pass VRA muster because there is a new Hispanic district that borders it, the 34th District. McAllen based, it’s pretty similar to today’s 15th district. The new 15th should get incredibly more Democratic over the next decade if trends continue, especially if McAllen continues to grow.
TX-27 BLUEISH GREEN
Incumbent: Solomon Ortiz (D-Corpus Christi)
Counties: Nueces, Kleberg, Kenedy, Willacy, Cameron
Cities of Note: Brownsville, Corpus Christi
Obama: 53%
McCain: 46%
Old District (Obama-McCain):
White: 27 Black: 2 Hispanic: 69 Asian: 2 Native American: 0 Other: 0
Projected: Safe Democratic
TX-34 LIGHT GREEN
Incumbent:
Counties: Starr, Zapata, Jim Hogg, Duval, McMullen, Live Oak, Karnes, Gonzales, DeWitt, Victoria, Hidalgo (Part), Wilson (Part) Lavaca (Part), Colorado (Part), Wharton (Part), Fort Bend (Part)
Cities of Note: McAllen, Rosenberg, Victoria
Obama: 49%
McCain: 50%
Old District (Obama-McCain):
White: 27 Black: 3 Hispanic: 69 Asian: 1 Native American: 0 Other: 0
Projected: Tossup
A newly-created McAllen-based district, it’s swingy territory. I think it should elect a conservative Hispanic Democrat, but it has a R-leaning bent and should probably would, at first, elect a Republican Hispanic.
EVERYTHING ELSE

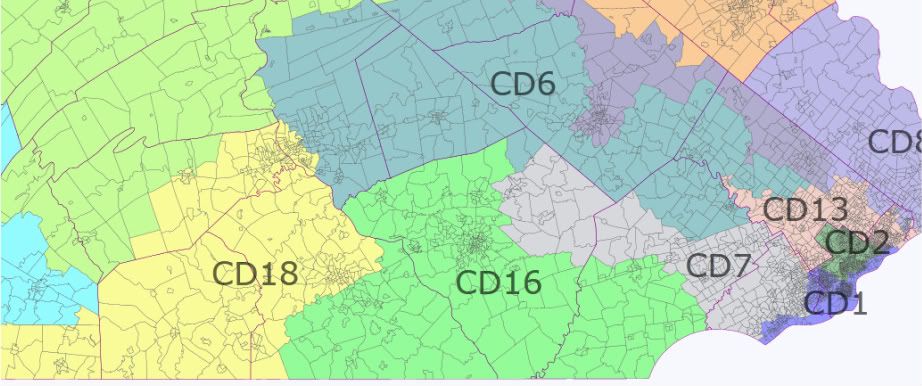
TX-16 GREEN
Incumbent: Silvestre Reyes (D-El Paso)
Counties: El Paso (Part)
Cities of Note: El Paso
Obama: 65%
McCain: 34%
Old District (Obama-McCain): 66-33
White: 18 Black: 3 Hispanic: 77 Asian: 2 Native American: 0 Other: 1
Projected: Safe Democratic
No difference really, but it gets smaller. Safe Democratic.
TX-1 DARK BLUE
Incumbent: Louie Gohmert (R-Tyler)
Counties: Smith, Upshur, Gregg, Harrison, Nacogdoches, Shelby, Panola, Angelina, San Augustin, Sabine, Marion (Part)
Cities of Note: Tyler, Longview, Lufkin, Marshall
Obama: 30%
McCain: 69%
Old District (Obama-McCain):
White: 70 Black: 19 Hispanic: 9 Asian: 1 Native American: 0 Other: 0
Projected: Safe Republican
Not much has changed. It loses a little land due to population growth. East Texas should keep electing Republicans. Gohmert, as crazy as he is, is safe.
TX-4 RED
Incumbent: VACANT
Counties: Fannin, Lamar, Red River, Bowie, Cass, Morris, Camp, Titus, Hopkins, Delta, Hunt, Marion (Part), Kaufman (Part), Collin (Part), Dallas (Part)
Cities of Note: Paris, Dallas, Mesquite
Obama: 35%
McCain: 64%
Old District (Obama-McCain):
White: 73 Black: 14 Hispanic: 10 Asian: 3 Native American: 0 Other: 0
Projected: Safe Republican
It’s pretty much Ralph Hall’s district, but I couldn’t justify keep Rockwall County in the district; Sessions needed to be made safer. Hall is getting up there in age, and he survived a good teabagging this year in the primary. Anyway, he could move here or another very conservative Republican could run here.
TX-6 DARK TURQUOISE
Incumbent: Joe Barton (R-Ennis)
Counties: Ellis, Navarro, Freestone, Limestone, Falls, Robertson, Brazos, Bell (Part), Milam (Part)
Cities of Note: Ennis, Bryan, Temple, Killeen
Obama: 36%
McCain: 63%
Old District (Obama-McCain): 40-60
White: 65 Black: 15 Hispanic: 16 Asian: 4 Native American: 0 Other: 0
Projected: Safe Republican
I make no apologies (heh) to Barton for taking out Arlington, as he gets an exurban and pretty safe new district. However, Edwards might consider taking a shot at him, as Temple and Bryan are now in the district. Still, I would feel good about Barton’s chances.
TX-19 LIGHT GREEN
Incumbent: Randy Neugebauer (R-Lubbock), Chet Edwards (D-Waco)
Counties: Lubbock, Crosby, Motley, Dickens, King, Stonewall, Haskell, Throckmorton, Young, Erath, Comanche, Bosque, McLennan, Hamilton (Part), Palo Pinto (Part), Hamilton (Part), Bell (Part)
Cities of Note: Lubbock, Waco
Obama: 33%
McCain: 66%
Old District (Obama-McCain): 27-72
White: 66 Black: 10 Hispanic: 20 Asian: 2 Native American: 0 Other: 0
Projected: Leans Republican
This district will be a Lubbock vs. Waco district, with a spaghetti strange of rural West Texas in between. Edwards would have to get acquainted with a new district in inhospitable West Texas. Edge to “It’s a Baby Killer.”
TX-13 BEIGE
Incumbent: Mac Thornberry (R-Clarendon)
Counties: A lot
Cities of Note: Wichita Falls, Amarillo, Denison
Obama:
McCain:
Old District (Obama-McCain): 23-76
White: Black: Hispanic: Asian: Native American: Other:
Projected:
TX-11 LIGHT ARMY GREEN
Incumbent: Mike Conaway (R-Midland)
Counties: A lot
Cities of Note: Midland, Abilene, Amarillo
Obama: 22
McCain: 77
Old District (Obama-McCain): 24-75
White: Black: Hispanic: Asian: Native American: Other:
Projected: Safe Republican
I think this becomes the safest GOP seat in the country…
TX-23 LIGHT BLUE
Incumbent: OPEN SEAT
Counties: Medina, Uvalde, Dimmit, Zavala, Maverick, Kinney, Val Verde, Terrell, Brewster, Presidio, Jeff Davis, Culberson, Hudspeth, Reeves, Loving, Winkler, Ector, Howard, Glasscock, Ward, Crane, Upton, Reagan, Tom Green, Irion, Crockett, El Paso (Part), Webb (Part), Andrews (Part)
Cities of Note: El Paso, Laredo, San Angelo, Odessa
Obama: 42%
McCain: 57%
Old District (Obama-McCain):
White: 36 Black: 3 Hispanic: 60 Asian: 1 Native American: 0 Other: 0
Projected: Likely Republican
A VRA-protected seat, it’s more Hispanic than the current 23rd. It’s way more Republican now, a net of 18 points more. Ciro Rodriguez doesn’t live here anymore, and the district is based in three different population centers: San Angelo, Odessa, and Northern Laredo. A Blue Dog Hispanic could win here eventually, as Hispanics in the area might, you know, vote eventually. This district is likely going to go to an Hispanic Republican, but down the road, the huge 23rd might flip.
TX-31 LIGHT MUSTARD YELLOW
Incumbent: John Carter (R-Round Rock)
Counties: Williamson, Burnett, Blanco, Gillespie, Llano, Mason, San Saba, McCulloch, Mills, Lampasas, Coryell, Hamilton (Part), Hamilton (Part), Milam (Part)
Cities of Note: Round Rock, Cedar Park, Georgetown
Obama: 36%
McCain: 62%
Old District (Obama-McCain): 41-57
White: 75 Black: 6 Hispanic: 15 Asian: 3 Native American: 0 Other: 0
Projected: Safe Republican
Again, this redistricting took countless hours. I kinda dared myself to try it out. I think it turned out pretty well…
Some thoughts: the DeLaymander was absolutely brilliant–in a nefarious sort of way. Just looking at the districts though, it’s almost inevitable that some districts start flipping our way. I think I used West Texas more effectively than it is now. I’ll add more later.