North Carolina without an I-85 NC-12

I just wish I could see ten different ways of dealing with the Democrats in the Triad, rather than ten different variations that all deal with them the same way: using NC-12.

roguemapper

Two of the most recent NC redistricting diaries have featured roguemapper’s cri de couer against I-85-based NC-12s in their comments. Here, I’m only delivering two different ways of dealing with the Triad Dems instead of ten. I hope the comment section will make up for the missing eight.

The argument against an I-85-based NC-12 is threefold: (1) it was upheld in the courts as a partisan-based and not minority-based gerrymander; (2) creating a minority-majority NC-12 barely requires leaving Charlotte, let alone Mecklenburg County; and (3) state Republicans have said they don’t want one. I’m currently too lazy to source any of those statements and I’m not interested in arguing them. My purpose is to discuss North Carolina maps that treat that argument as true. Think about it like a move trailer, if it helps:

(booming movie announcer voice) In a world where North Carolina Republicans are committed to a compact, Charlotte-based, minority-majority NC-12… (/booming movie announcer voice)

I’m presenting two maps here. One is an  unaggressive and therefore unlikely map that cuts out Kissell but gives the Democrats a new district in the Triad. (It’s also got retrogression issues.) I’m posting it because I think it’s an interesting baseline for what a minimally gerrymandered map could look like. There’s a grand total of ten counties statewide that are split between two or more districts. The other is an extremely aggressive map which creates 10 McCain districts.

Pictures and discussion are after the jump.

(Note: I don’t generally like changing colors, because I’m used to the defaults and I assume others are too. But there are too many blues in the first 13 colors for a NC map. On the first map, NC-08 is Beige. On the second map, NC-12 is Beige.)
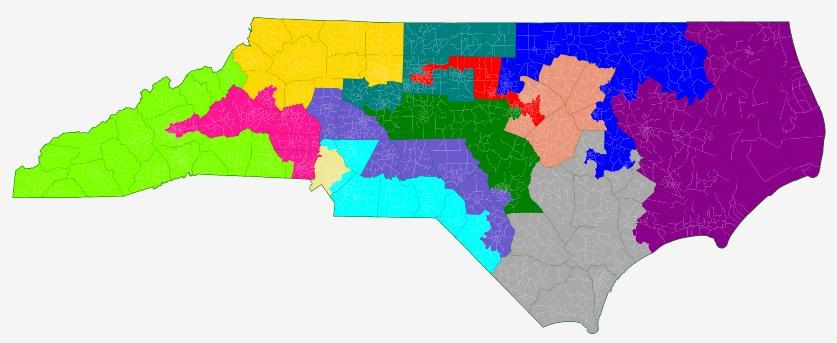
Map One


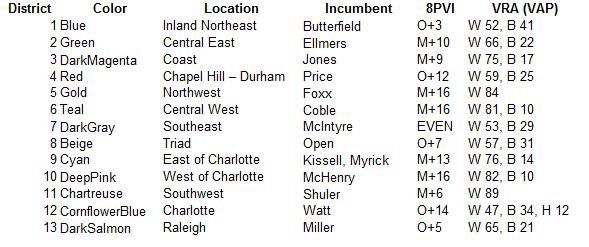
Not much to say about this one. It’s my best attempt to use county integrity as my first priority, with partisan effects as my second. All six Republicans should be fine in districts that McCain carried by at least 9 points by at least 5 pts. Correction: The preceding sentence was incorrect. My 8PVI rating means that McCain did at least 9 pts better than he did nationally in all six Republican districts, but that only means that he won them by at least 5 points, not 9. The seven Democrats have a more varied range of impacts. Shuler and Miller are in districts that are about one point more McCain-friendly. McIntyre’s district gets a seven point boost in Obama-friendliness. Kissell’s district is axed and relocated to the Triad. Miller and Watt hold steady.

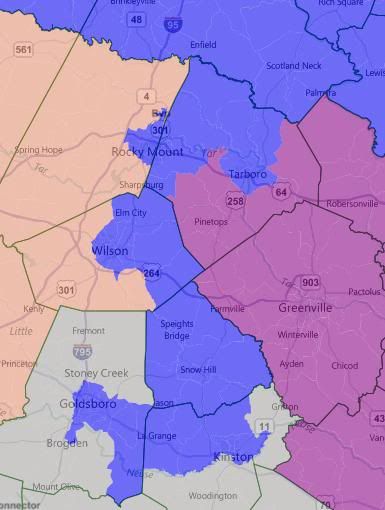
NC-01, obviously, would be contentious. There are retrogression concerns in having it become majority-white in terms of VAP (total population it’s merely plurality white). It’s also lost about six points worth of Obama-friendliness. Something like this would require a Republican legislature that’s willing to test the bounds what the courts will let them get away with. If they were willing to adopt the rest of the map (not likely), some playing around with borders of NC-01 and NC-03 should be able to result in better districts for both Jones and Butterfield and satisify retrogression concerns.  (Note that this map has Jones drawn out of his district.)

I don’t actually endorse this version of NC-01 — again, this particular map is meant to be a baseline for county-integrity. This is important primarily because the Republicans in charge of redistricting have been talking a big game about a clean map. I wanted something to be able to compare to their eventual map.
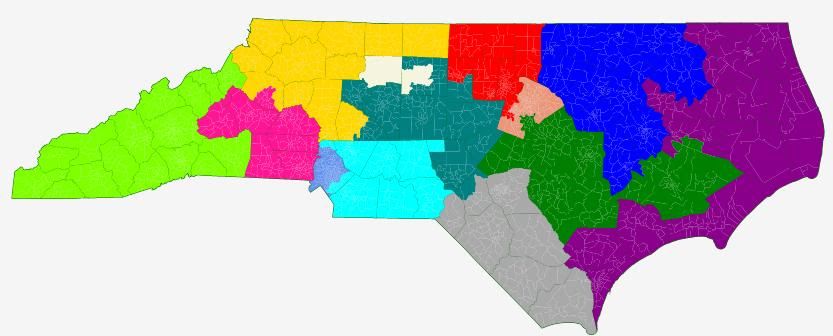
Map Two

There should be more to say about this one, since it is an actual proposal. But I’m tired, so I’m going to let the pictures tell most of the story. This is, ostensibly, a 10-3 map. Note that is a fairly clean map as well, with a total of 19 counties split between two or more districts.


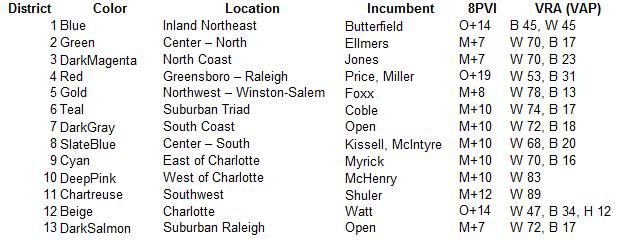
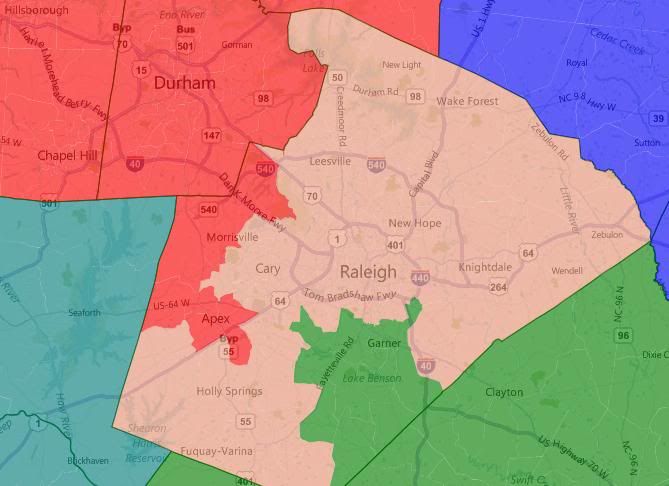
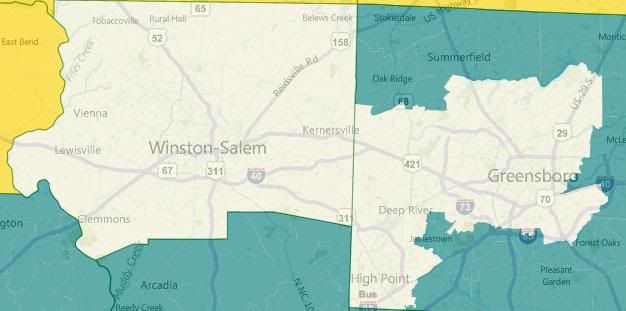
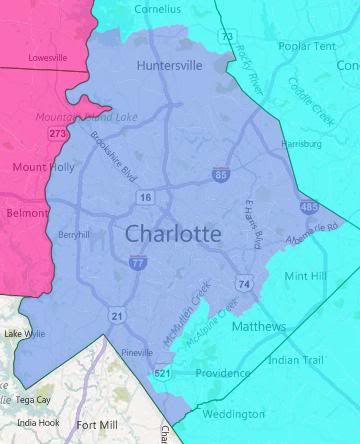
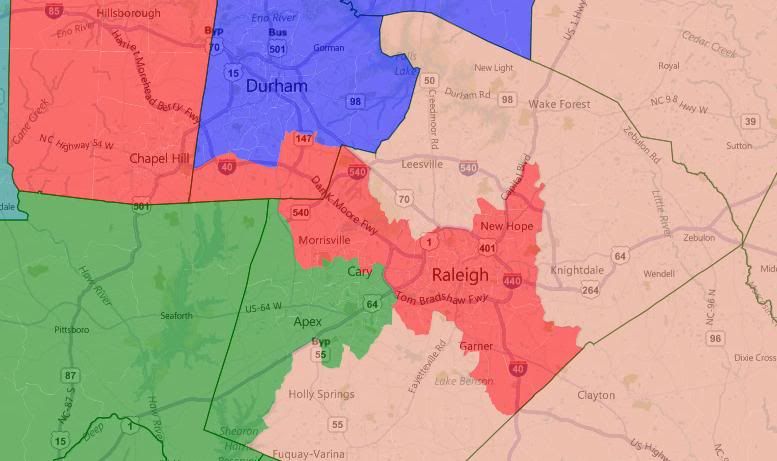
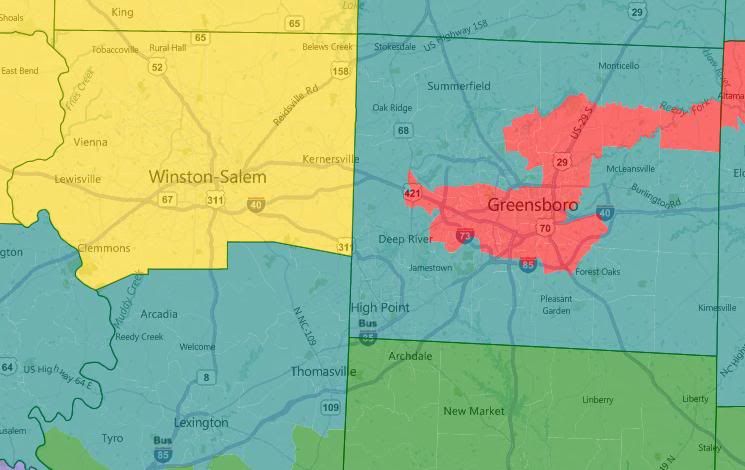
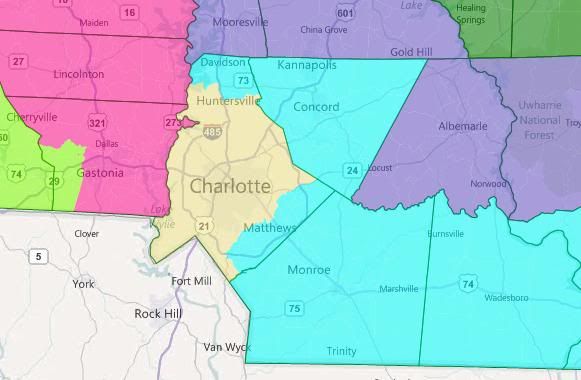
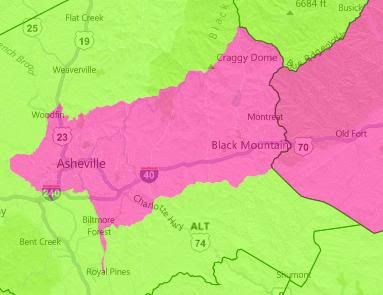
The three Democratic districts are Durham + the core of the old First, Greensboro + Chapel Hill + downtown Raleigh, and Charlotte. Foxx’s district is red enough to absorb all of Winston-Salem easily. McHenry’s is likewise red enough to absorb Asheville.

I’ve lumped two incumbent Democrats into one uber-Democratic seat in the north and two incumbent Democrats into one fairly-Republican seat in the south. I’m curious how the primary process would play out in this NC-04.

There are two new Republican open seats. Note how evenly spread Republican strength is — all in the McCain +7 to +12 range.


Update: Re-reading my diary, I realized that I incorrectly described the meaning of my 8PVI rating. I’ve struck through and corrected a sentence up in the Map One section. 8PVI is based on Cook PVI but only uses 2008 voting data. It’s a measure of how much better Obama or McCain did in a jurisdiction than they did nationwide. The nationwide balance was 53.5 Obama to 46.5 McCain. So O+10 means Obama won a jurisdiction 63.5 to 36.5. M+5 means McCain won a jurisdiction 51.5 to 48.5.

By what margin will Bob Shamansky win?

View Results

Loading ... Loading ...

10-3 Republican Non-Dummymander of North Carolina

Photobucket

This was intended to test the extent to which the GOP could wreak havoc with North Carolina redistricting, while remaining VRA-compliant.  The key to the map is taking Mel Watt’s 12th district, and sending it eastward instead of northward (which is what the Bush Administration was trying to force NC to do in the early 1990s.  This allows massive packing of Democrats in the RTP/Greensboro/Winston-Salem area into a heavily Democratic district, that is a borderline third VRA district.  As an additional bonus, it places McIntyre, Watt and Kissell in the same district.

This would obviously engender a Shaw v. Reno-type challenge, but again, this is simply meant to test boundaries.  You can smooth the lines out in the 12th and 1st to make them not all that much worse than they presently are, especially if you don’t try to pack the three Congressmen together into the 12th.

I assumed that any district that gave McCain at least 54% of the vote would be pretty safe for Republicans, especially considering that high African American turnout probably skews these districts a touch toward the Democrats right now.

Without further adieu . . .

First District (Butterfield) — 70% Obama, 30% McCain, 42% White, 50% Black, 5% Hispanic (old district 63% Obama, 37% McCain, 50% black, 43% white, 4% H.).  This district needs to gain population, and the only way to do that is to extend it into Raleigh or Durham.  I chose the latter.  In reality, it is difficult to keep this black-majority, but you probably don’t need to do that to remain VRA compliant, which allows some smoothing of the lines (at the expense of making the 3rd/13th more Democratic).

Second District (Ellmers) — 45% Obama, 54% McCain, 67% White, 23% Black, 6% Hispanic (old district 53/47 Obama, 58/29/10 W/B/H).  This district no longer resembles a dragon viewed from above.  Ellmers loses Democratic portions of Fayetteville and Wake County, and trades them for Republican areas there.

Third District (Jones) — 42% Obama, 57% McCain, 72% White, 21% Black, 4% Hispanic (old district 62/38 McCain, 75/16/5 W/B/H).  Jones’ district loses some heavily Republican precincts on the western edge of the 1st, and gains Democratic areas in Duplin and Pender. If the 1st has to be smoothed out some, I’d extend this one down to downtown Wilmington to shore up the 7th.

Photobucket

Fourth District (Price/new minority Rep) 79% Obama, 20% McCain, 45% White, 42% Black, 8%Hispanic (old district 62/37 Obama, 66/19/8 W/B/H) — This basically packs as many Democratic precincts in the area as possible into one district.  I think this is probably a third VRA district, since African Americans would probably control the Democratic primary, and the district would almost certainly elect whomever comes out of that primary.

Fifth District (McHenry) — 59% McCain, 40% Obama, 78% White, 16% Black, 4% Hispanic (old district 63/36M, 83/9/5 W/B/H).  I flipped the district numbers here just to make the maps more readable.  McHenry gets a lot of new territory, but most of it is reliably Republican and he should have little difficulty winning here.

Sixth District (Coble) — 43% Obama, 56% McCain, 83% White, 11% Black, 5% Hispanic (old district 63%/36% McCain, 82%W, 10%B,6%H).  Coble actually gets to keep a lot of his old territory.  You could smooth out the lines with the 13th and make it look a lot more “normal” without affecting its performance that much.

Seventh District (Open) — 44%Obama, 56% McCain, 69% White, 23% Black, 5% Hisp, 2% NA (old district 52%M/47%O, 64/21/6 W/B/H, 8% NA) — The black/hispanic percentages don’t change much; the key is moving Lumbee Native Americans from Robeson County into the minority-majority 12th.  McIntyre goes with them,and this new district should easily elect a Republican.

Eighth District (Open) — 44% Obama, 55% McCain, 81% White, 10% Black, 5% Hispanic (old district 52/47 Obama, 58/28/9 W/B/H) — Kissell gets moved into the 12th.  It would be pretty simple for him to move into this district, but it is much less hospitable for him.  The new GOP voters in Randolph County and thereabouts are true GOPers, not the remnants of Southern Democrats that inhabit the current 8th.

Photobucket

Ninth District (Myrick) — 44% Obama, 55% McCain, 83% White, 10% Black, 4% Hispanic (old district 55/45 McCain, 77/13/6) — The topline numbers don’t change on Myrick’s district, but the racial composition changes a hair.  It’s whiter now, meaning that in years where the GOP doesn’t completely alienate everyone, it will swing further to the right than its current makeup.

Tenth District (Foxx) — 43% Obama, 56% McCain, 88% White, 6% Black, 4% Hispanic (old district 61/38 McCain, 85/7/6).  She gets a chunk of Asheville, in order to shore up the GOP #s in the 11th, but this is still Republican enough that she should win handily.

Eleventh District (Shuler) — 57% McCain, 42% Obama, 89% White, 5% Black, 3% Hispanic (old district 52/47 McCain, 88/5/4 W/B/H) — Shuler loses most of Asheville, and I think he’d have a very, very difficult time winning this.  He’d have lost by about 6 points to a no-name in 2010.

Twelfth District (Watt, Kissell, McIntyre) — 72% Obama, 27% McCain, 38% White, 43% Black, 8% Native American, 7% Hispanic (old district 71/29 Obama, 41/44/11 W/B/H) — Not too much to say here, except that this is the lynchpin of the entire plan.  It’s what makes the 8th and 7th very, very difficult to win for Democrats.

Thirteenth District (Miller) — 45% Obama, 54% McCain, 77% White, 18% Black, 3% Hispanic (old district 60/40 Obama, 60/28/9 W/B/H).  I don’t know what precinct Miller is in; he may well be drawn into the First (or could easily be drawn there).  Regardless, I have a hard time seeing him winning here, except if 2012 is a very good Democratic year.

Thoughts?

36-0 Texas

The hardest thing for me to remember when making GOP friendly gerrymanders is that a 50% John MctCain district isn’t a toss-up but a likely R district, similar in theory to a 60% Obama District. 5 points more friendly to the gop then the nation as an average implies that, but it is somewhat tricky for me, at least, to wrap my mind around it. However, that was my goal when I started North Carolina: create as many districts that went GOP in 08 as possible. After getting an 11-2 in a state that went for Obama, i figured a 36-0 in Texas was possible. and it was. One district voted for Obama by less than 1000 votes, so I’m going to count it. A 59% Obama district would be okay for most of us here… Without further ado, MAPS!

As always, ask me and i will provide a zoomed in map of whatever area you wish if it isn’t clear from the big one.

http://img.photobucket.com/alb…

http://img.photobucket.com/alb…

El Paso: http://img.photobucket.com/alb…

District 1 (Blue):  Mccain 56%, 56% Hispanic

El Paso and Odessa

District 2 (Green): M 53%, 63% H

Rest of El Paso and some nearby counties

San Antonio and Austin: http://img.photobucket.com/alb…

District 3 (Purple): M 50%, 60% H

South San Antonio

District 4 (Red): M 51%, 50% H

North and West Antonio

District 5 (Yellow):  M 51%, 40% H, 10% Black, 3% Asian

East and North San Antonio

District 6 (Teal): M 50%, 72% H

Laredo and some Border counties, then up to West Texas

District 7 (Gray): M 50%, 66% H

McAllen and Border areas all the way up to Bastrop and Fayette Counties

District 8(Violet) M 51%, 62% H

Brownsville, Mcallen and then up.

District 9(Sky Blue): M 51%, 59%  H

Brownsville, Harlingen, up to Williamson and Milam counties.

District 10 (Pink):  M 50%, 35% H, 16% B, 3% A

Corpus Christi and up

Houston:  http://img.photobucket.com/alb…

District 11 (Lemon-Lime Green): M 55%,  55% White

South of  Houston

District 12 (Blue-Line Green) :  M 56%, 22% H, 20% H, 11% A

Some of the south-west of Houston and then surroundin areas.

District 13(Light Brown): M 53%, W 52%

Houston and some areas north

District 14(Gold):  M 57%,  W 61%

Houston and some areas north

District 15 (Orange): M 52%, 32% H, 19% B, 4% A

South of Houston, with a bit of the city

District 16(Lime Green):  M 52%, 39% H, 12% B, 4% A

Houston and Areas East

District 17(Navy blue): M 52%, 41% H,  16% B

Houston and Areas North East

District 18 (Golden Yellow):  M 56%, 56% W

North of Houston

District 19 (Puke Green): M 56%, 65% W

Wraps around 11-17

District 20 (Light Pink): M 52%, 59% W

Wraps around Austin and takes part of the city then to Abilene

District 21 (Blood Red): M 54%, 66% W

Parts  of Austin then  going to sparsely populated Northern Texas

District 22 (Poo Brown):  M 51%, 79% W

Austin and North Texas

Dallas-FW: http://img.photobucket.com/alb…

District 23 (Robin’s Egg Blue): M 54%, 57% W

Dallas and some northern suburbs

District 24 (Dark Purple):  M 56%, 59% W

Dallas and Some Eastern areas

District 25 (Rose): M 54%,  59% W

Dallas then to some less populated eastern areas

District 26 (Silver) M 58%,   54% W

Dallas, FW, then to North Texas

District 27 (Sea Green) M 49%, 54% W

Dallas, FW, then to North Texas

District 28 (Pinkish Purple) M 60%, 57% W

Irving, then up to North Texas

District 29 (Gray Green): M 53%, 60% W

Waco and Forth Worth

District 30 (slightly lighter shade of rose then

the one touching it): M 55%, 60% W

Parts of Arlington, Dallas and Fort Worth

District 31 (Tan): M 61%, 71% W

North Fort Worth and Dallas then North

District 32 (Red Orange): M 64%, 79% W

North FW and then northern areas surrounding it

District 33 (I can’t name that many different shades of blue): M 63%, 80% W

North of Dallas

District 34 (Somewhat dark-green): M 69%, 75% W

Wraps around a lot of other districts, filling in a lot of gaps

District 35 (Royal Purple): M 62%, 64% W

Everything Else Part 1

District 36 (Not Flyers Orange, but I’m using it anyways): M 68%, 69% W

Everything Else, Part 2

This is not a perfect 36-0 Map. The last 5-6 districts could bleed some republican voters to some of the more borderline districts. However, in an ok to good year, the republicans win all 36 seats barring an exceptional democratic candidate.

Dave’s seems to have deleted my other maps. I’ll redo them later and either edit this diary or do a new one, depending on what you guys thing.

Redistricting North Carolina

This is my first shot at this, so be gentle 🙂

Meant to create:

1 Heath Shuler: 11

4 blue districts: 1, 4, 7, 12

8 red districts: 2, 3, 5, 6, 8, 9, 10, 13

http://img413.imageshack.us/im…

NC-1 (dark blue): Butterfield (D)

Obama 59%.

Mostly the same as before. The way I drew it, its only plurality black, not majority black. It could probably be tinkered with easily to be majority black though.

NC-2 (bright green): Ellmers (R)

McCain 55%

Loses Raleign and Chatham county, and most of Cumberland county. Picks up some nice R areas elsewhere.

NC-3 (purple): Jones (R)

McCain 58%

Pretty ugly. This was the leftover territory district for me.

NC-4 (red): Price (D)

Obama 72%

Congrats David Price. Obama vote dump. Loses carefully chosen sections of Chatham, Durham, Orange,and holds all of Chapel Hill and Raleigh.

NC-5 (yellow): Foxx (R)

McCain 55%

Absorbs a piece of Guilford county and the Greensboro area. Probably weaker than before.

NC-6 (olive green): Coble? (R)

McCain 55%

Not sure where Coble lives:

Covers most of Davidson, Rowan, Cabarrus, a bit of the Charlotte suburbs, and another piece of Guilford county.

NC-7 (grey): McIntyre (D)

Obama 58%

Another Democratic voting dump. Retains a piece of New Hanover and keeps Fayetville. All these counties voted for Elaine Marshall over Burr for Senate this year.

With a bit of fancier line drawing this can probably hit 60% Obama easily.

NC-8 (purple): Coble (R)

McCain 55%

See 6.

Yields territory to the new 6th and grabs Chatham and a piece of Wake County. Less Repbulican than before. Either 6 or 8 gets a new Republican.

NC-9 (teal): Mynick (R)

McCain 55%

Mostly unchanged.

NC-10 (pink): McHenry (R)

McCain 58%

Absorbs half of Buncombe. Picks up some of the 5ths territory.

NC-11 (bright green): Shuler (D)

McCain 56%

Breaks Buncombe in 2. Grabs some territory from the 5th and 10th. Shuler can win this anyway, though. A future Democrat probably can’t.

NC-12 (pale blue): Watt (D)

Obama 68%

Mostly unchanged. Picks up some more Dem territory at both ends, but maintains the general 2 city and corridor structure. Almost certianly less than 50% white at this point.

A professional could probably hit 70% Obama with this, and shore up the new 6th.

NC-13 (tan): Miller (D)

McCain 55%

Loses most of Raleigh and Greensboro. Grabs all of Alamance county and some areas from the old 2nd.

Designed to knock off Brad Miller.

NC State Senate – Dem Leadership Turnover

The North Carolina State Senate will see considerable turnover in the Democratic Leadership by the end of 2010. Democrats currently hold a 30-20 majority, and have controlled the Senate Chamber since the 1870s. All members face re-election every 2 years.

3 Democrats have announced they will not run in 2010, and Majority Leader Tony Rand resigned today to accept a new position in state government. The retirements include 3 (now 4) of the 5 most senior Democrats in the Senate.

1/17 Update – Another retirement announced – Sen Charlie Albertson will not run in 2010.

Majority Leader Tony Rand has resigned after 27 years to accept Governor Bev Perdue’s appointment as Chair of the State Parole Commission. Gov Perdue will appoint Rand’s replacement.

http://www.fayobserver.com/Art…

Sen David Hoyle, co-chair of the Senate Finance Committee, has announced he will not run for re-election in 2010 after serving for 18 years in the State Senate.

http://jackbetts.blogspot.com/…

Sen Julia Boseman has announced she won’t seek a 4th term in 2010. Boseman is NC’s only openly gay or lesbian legislator.

http://www.starnewsonline.com/…

Sen RC Soles, Chairman of the Commerce Committee and NC’s longest serving State Senator, has announced he will not run for re-election in 2010. Soles was first elected to the Legislature in 1968, serving 40 years. Soles shot and wounded an intruder in his home earlier this year, and may face charges.

http://www.wral.com/news/state…

The seats held by Hoyle, Boseman, and Soles were all considered competitive in 2008.

http://www.wral.com/news/local…

1/17 update: Sen Charlie Albertson announced Friday he will not run for re-election in 2010. His district #10 is a D +3 district. Albertson has served in the legislature for 20 years. He is the 3rd most senior Democrat in the Senate.

http://www.wral.com/news/local…

Redistricting North Carolina (w/ data)

Well I really liked Johnny Longtorso’s map of North Carolina, so I decided to expand on that and create a similar map while figuring out the partisan data for each district. Nothing fancy, just county level voting for the 2008 election. The map is 9-4-1, either 9-5 or 10-4 depending on whether a Democrat can defeat Myrick.

Unfortunately, according to the new census report North Carolina will probably not get a 14th district. Plus it probably violates VRA, but it’s an example of how the VRA hurts Democrats in redistricting. So this map is a bit useless, but I like it.  

Congressional District 1: Butterfield (D)

County Obama Vote McCain Vote
Vance 13,166 7,606
Warren 7,086 3,063
Franklin 13,085 13,273
Nash 23,099 23,728
Wilson* 19,652 17,375
Greene 3,796 4,272
Edgecombe 17,403 8,445
Halifax 16,047 8,961
Northampton 6,903 3,671
Hertford 7,513 3,089
Gates 2,830 2,547
Bertie 6,365 3,376
Martin 6,539 5,957
Pitt 40,501 33,927
Washington*
Total 183,985 139,290
New % 56.91%
Old % 62.72%

This is now a 41% Black district (still majority minority) down from 50.6%. And probably a violation of the VRA. Butterfield Got 70.28% in the old district. Likely Democratic (Safe with Butterfield).

Congressional District 2: Etheridge (D)

County Obama Vote McCain Vote
Harnett 16,785 23,579
Johnston 26,795 43,622
Wake* 110,410 76,809
Wilson*
Total 153,990 144,010
New % 51.67%
Old % 52.33%

Leans Democratic. (Safe with Etheridge).

Congressional District 3: Jones (R)

County Obama Vote McCain Vote
Brunswick 21,331 30,753
Onslow 19,499 30,278
Craven 19,352 24,901
Carteret 11,130 23,131
Pamlico 2,838 3,823
Beaufort 9,454 13,460
Hyde 1,241 1,212
Dare 8,074 9,745
Tyrrell 933 960
Washington 3,748 2,670
Chowan 3,688 3,773
Perquimans 2,772 3,678
Camden 1,597 3,140
Pasquotank 10,272 7,778
Currituck 3,737 7,234
Pender* 9,907 13,618
New Hanover* 49,145 50,544
Total* 119,666 166,536
New % 38.14%
Old % 41.81%

District 3 basically gets all the Republican friendly coastal counties in one district. It’s also is the most visually gerrymandered district as it avoids taking Wilmington from the the 7th district. Safe Republican.

Congressional District 4: Price (D)

County Obama Vote McCain Vote
Alamance 28,918 34,859
Orange 53,806 20,266
Durham 103,456 32,353
Chatham 17,862 14,668
Lee 10,784 12,775
Total 214,826 114,921
New % 65.15%
Old % 63.32%

District consists of Durham, Chapel Hill, and Burlington. Looses parts of Wake, gains the entirety of Almanace, Chatham and Lee counties. It’s a very compact district and keeps all the counties together, but I think that there are a bit too many Democrats in this district (I’d aim for more around 60%). Safe Democratic.

Congressional District 5: Foxx (R)

County Obama Vote McCain Vote
Mitchell 2,238 5,499
Avery 2,178 5,681
Watauga 14,558 13,344
Caldwell 12,081 22,526
Alexander 5,167 11,790
Iredell 27,318 45,148
Wilkes 8,934 20,288
Ashe 4,872 7,916
Alleghany 2,021 3,124
Surry 10,475 18,730
Yadkin 4,527 12,409
Davie 6,178 13,981
Stokes 6,875 14,488
Total 107,422 194,924
New % 35.53%
Old % 39.37%

Ugh. So this one really hurt as I passionately hate Virginia Foxx. So that’s probably the best news about this map being ruined with North Carolina only getting 13 districts. Hopefully more  Republican areas can get eaten up by 10th district and Winston-Salem can be incorporated into the 5th to make at least a 45%+ area where Foxx shouldn’t be able to win. As it stands, this Northwestern congressional district is Obama’s worst district aptly home to batshit insane Foxx. Safe Republcian.

Congressional District 6: Coble(R)

County Obama Vote McCain Vote
Rowan 23,391 37,451
Davidson 22,433 45,419
Randolph 16,414 40,998
Rockingham* 17,255 23,899
Guilford* 45,000 45,000
Guilford* 142,101 97,718
Total* 124,493 192,767
New % 39.24%
Old % 36.52%

Without the 14th district, this too probably will get more Democratic as it will get Greensboro and cede some Republican area to the too Democratic 4th district. But as it stands it is Safe Republican.

Congressional District 7: McIntyre(D)

County Obama Vote McCain Vote
Columbus 11,076 12,994
Bladen 7,853 7,532
Duplin 8,958 10,834
Sampson 11,836 14,038
Lenoir 13,378 13,401
Wayne 22,671 26,952
Jones 2,378 2,817
Pender* 9,907 13,618
New Hanover* 49,145 50,544
Cumberland* 15,400 10,000
Total 152,602 162,730
New % 48.39%
Old % 47.20%

Considering that this is a McCain district, I made sure that I kept all of McIntyre’s base intact I gave most of Robeson County to the 8th to strengthen Kissell, though I attempted to snake McIntyre’s home (Lumberton) into the district.  This district is a percentage better than before. My reason for adding the rest of Sampson, all of Lenoir and Wayne is because while the counties are all either Republican or Tossup, they all seem like McIntyre can do well and build a Democratic base in.

Since from what I can see Generic Democrat did about 3% better than Obama this district is Tossup Democratic. (Safe for McIntyre).

Congressional District 8: Kissell(D)

County Obama Vote McCain Vote
Total 138,448 118,982
Anson 6,456 4,207
Montgomery 4,926 6,155
Richmond 9,713 9,424
Moore 17,624 27,314
Scotland 8,151 6,005
Hoke 9,227 6,293
Robeson 23,058 17,433
Cumberland* 59,293 42,151
Total 138,448 118,982
New % 53.78%
Old % 52.96%

I made Kissell’s district a bit more Democratic by  grabbing more of Fayetteville and Robeson and Republican Moore, but loosing all the Republican territory in Cabarrus, Stanly, and Union and Republican part of Mecklenburg (Charlotte) which he lost 34.7k to 46.4k. This is now Leans to  Likely Democratic.

Congressional District 9: Myrick (R)

County Obama Vote McCain Vote
Union 31,189 54,123
Stanly 8,878 19,329
Cabarrus 31,546 45,924
Mecklenburg* 76,958 30,848
Total 148,571 150,224
New % 49.72%
Old % 45.11%

This is a pretty spiteful gerrymander specifically to get rid of Myrick  

Congressional races 2010: North Carolina, North Dakota

Previous diaries

Summary:

 NC has 13 representative: 8 D and 5 R

 ND has 1 representative: A Democrat

 Possibly vulnerable – I don’t see any

Sources:

House vote in 2008 from WaPo

VoteView (ranked from 1 for most liberal to 447 for most conservative; more than 435 because some districts had more than one rep in the 110th congress)

Race Tracker

Obama vote by CD from Swing State

National Atlas for maps

and my previous diaries.

District: NC-01

Location Northeast NC, bordering VA and Pimlico Sound map

Cook PVI D + 9

Representative G.K. Butterfield (D) Not confirmed

VoteView 69.5

First elected 2004

2008 margin  70-30 against Dean Stephens

2006 margin  Unopposed

2004 margin 64-36

Obama margin 63-36

Bush margin 2004 42-57

Current opponents None confirmed

Demographics 39th most rural (52.3$), 15th lowest income (median = $28K), 74th fewest Whites (44.4%), 24th most Blacks (50.5%)

Assessment Safe

District: NC-02

Location Central NC, including Raleigh map

Cook PVI R + 2

Representative Bob Etheridge (D) Not confirmed

VoteView 168

First elected 1996

2008 margin 67-31 against Dan Mansell

2006 margin  67-33

2004 margin 62-38

Obama margin 47-52

Bush margin 2004 54-46

Current opponents None confirmed

Demographics 43rd most rural (50.5%)

Assessment

District: NC-03

Location  Most of the Atlantic coast of NC map

Cook PVI R + 16

Representative Walter Jones (R)

VoteView 294.5

First elected 1994

2008 margin 66-34 against Craig Webber

2006 margin 69-31

2004 margin  71-29

Obama margin 37-62

Bush margin 2004 69-32

Current opponents None confirmed

Demographics 39th most Republican

Assessment Long shot

District: NC-04

Location The ‘research triangle’ including Chapel Hill, Durham, and Cary map

Cook PVI D + 8

Representative David Price (D) Not confirmed

VoteView 98.5

First elected 1996

2008 margin 63-37 against William Lawson

2006 margin  65-35

2004 margin  64-36

Obama margin 62-37

Bush margin 2004 44-55

Current opponents 3 Republicans have declared

Demographics Not unusual on what I track

Assessment Looks safe, I am not sure why there is so much R interest

District: NC-05

Location  Northwest NC, bordering TN and VA map

Cook PVI R + 15

Representative Virginia Foxx (R) Not confirmed

VoteView 432

First elected 2004

2008 margin 58-42 over Roy Carter

2006 margin  57-43

2004 margin  59-41

Obama margin 38-61

Bush margin 2004 66-33

Current opponents None confirmed

Demographics 22nd most rural (57.1%)

Assessment Long shot

District: NC-06

Location Central NC map

Cook PVI R + 18

Representative Richard Coble (R) Not confirmed

VoteView 383

First elected 1984

2008 margin 67-32 over Teresa Bratton

2006 margin  71-29

2004 margin  73-27

Obama margin 36-63

Bush margin 2004 69-30

Current opponents None confirmed

Demographics 56th most rural (48.4%), 25th most Republican

Assessment

District: NC-07

Location Southern NC, bordering SC and the Atlantic map

Cook PVI R + 5

Representative Mike McIntyre (D)

VoteView 223

First elected 1996

2008 margin 67-32 against William Breazeale

2006 margin  73-27

2004 margin 73-27

Obama margin 47-52

Bush margin 2004 54-45

Current opponents Breazeale is running again

Demographics 30th most rural (54.9%), 70th most Blacks (23.1%)

Assessment Safe

District: NC-08

Location  Central part of southern NC, bordering SC map

Cook PVI R + 2

Representative Larry Kissell (D) Not confirmed

VoteView NA

First elected 2008

2008 margin 55-45 against Robin Hayes

2006 margin  NA

2004 margin NA

Obama margin 52-47

Bush margin 2004 54-45

Current opponents There is a lot of R interest, see the Wiki, but only Linwood Faulk is confirmed

Demographics 58th most Blacks (26.6%)

Assessment Kissell ousted Hayes fairly easily, this should be safe

District: NC-09

Location  A strange shaped district in southern NC, bordering SC map

Cook PVI R + 11

Representative Sue Myrick (R)

VoteView 402.5

First elected 1994

2008 margin 62-36 against Harry Taylor

2006 margin  67-33

2004 margin  70-30

Obama margin 44-55

Bush margin 2004 63-36

Current opponents None confirmed

Demographics 73rd highest income (median = $55K) (3rd highest in the deep south, after GA-06 and GA-07)

Assessment Long shot

District: NC-10

Location Western NC, but east of NC-11, running from TN to SC map

Cook PVI R + 17

Representative Patrick McHenry (R)

VoteView 417

First elected 2004

2008 margin 58-42 against Dan Johnson

2006 margin  62-38

2004 margin 64-36

Obama margin 36-63

Bush margin 2004 67-33

Current opponents None confirmed

Demographics 46th most rural (50.1%), 34th most Republican

Assessment  Long shot

District: NC-11

Location Westernmost NC, bordering TN, GA, and SC map

Cook PVI R + 6

Representative Heath Shuler (D)

VoteView 232

First elected 2006

2008 margin 62-36 against Carl Mumpower

2006 margin  54-46

2004 margin NA

Obama margin 47-52

Bush margin 2004 57-43

Current opponents Possibly a primary; no confirmed Republican, but a lot of potential candidates, see the Wiki.

Demographics 25th most rural (56.1%)

Assessment Shuler seems to fit this district, looks pretty safe

District: NC-12

Location A really weird, snaky district, NC’s “Black” district.  Includes Charlotte and Winston Salem.  It was the subject of 4 Supreme Court cases. Still, it borders the NC5,6,8,9, and 10th map

Cook PVI D + 16

Representative Melvin Watt (D) Not confirmed

VoteView 57.5

First elected 1992

2008 margin 72-28 against Ty Cobb

2006 margin  67-33

2004 margin  67-33

Obama margin 71-29

Bush margin 2004 37-63

Current opponents None confirmed

Demographics 28th most Blacks (44.6%)

Assessment Safe

District: NC-13

Location Central part of northern NC, bordering VA  map

Cook PVI D + 5

Representative Brad Miller (D) Not confirmed

VoteView 151

First elected 2002

2008 margin 66-34 against Hugh Webster

2006 margin 64-36

2004 margin 59-41

Obama margin 59-40

Bush margin 2004 47-52

Current opponents None confirmed

Demographics Not unusual on what I track

Assessment Safe

District: ND-AL

Location The whole state map

Cook PVI R + 10

Representative Earl Pomeroy (D)

VoteView 194.5

First elected 1992

2008 margin 62-38 against Duane Sand

2006 margin  64-35

2004 margin 60-40

Obama margin 45-53

Bush margin 2004 63-36

Current opponents None confirmed

Demographics 73rd most rural (44.2%), 18th fewest Blacks (0.6%), 33rd fewest Latinos (1.2%)

Assessment Safe

NC-sen Roy Cooper and GLBT rights (well one right)

http://equalitync.org/news1/20…

The one tidbit I was able to find in this regard, for readers’ information, was listed on Equality NC’s rundown of 2004 achievements (emphasis added by me):

“Fulfilling a campaign promise to Equality NC PAC, Attorney General Roy Cooper issued a non-discrimination policy for the Department of Justice that includes sexual orientation. He is the first statewide elected official to adopt such a policy in North Carolina.”

I hope he runs and beats Burr.

Richard Burr’s idiotic comments!

Sen. Richard Burr (R-N.C) really screwed up in some recent comments that he made. He is making himself more and more vulnerable with each passing day.

Here is what he told a group of NC business leaders earlier this week, as reported by The Hendersonville Times-News:

“On Friday night, I called my wife and I said, ‘Brooke, I am not coming home this weekend. I will call you on Monday. Tonight, I want you to go to the ATM machine, and I want you to draw out everything it will let you take. And I want you to tomorrow, and I want you to go Sunday.’ I was convinced on Friday night that if you put a plastic card in an ATM machine the last thing you were going to get was cash.” Burr added, “I think it is safe to say the economy has not rebounded. If anything, we have gone deeper into what economists call ‘recession.’ I would tell you it’s not a recession. I would define this as a depression.”

http://politicalticker.blogs.c…

Advocating runs on the banks is a really idiotic thing to do, and I am really looking forward to getting a new Senator in 2010. I really hope that Roy Cooper will run for Senate!

What do you all think of these comments and will this impact Sen. Burr’s future at all?

Richard Burr’s 15 minutes of fame

Sen. Richard Burr (R-NC) is finally making national news after four years as a do-nothing GOP wallflower. But… it’s probably not the knid of publicity that will help him come 2010.

Yesterday, the House passed a bill that would give the FDA power to regulate tobacco products by a vote of 298-112. Next, the bill will head to the Senate, where one senator has threatened to filibuster it. That senator is… Richard Burr.

I can understand Burr’s opposition to the bill. North Carolina is the number one tobacco-producing state in the country, and the congressional district Burr represented from 1995 to 2005 includes Winston-Salem, the home of the R.J. Reynolds Tobacco Company.

But Burr’s opposition to this bill has been reported in virtually every news story on this bill, including these stories from the New York Times, the Wall Street Journal, and the Associated Press. This is bad politically for Burr for several reasons:

1. It will empower national Democrats to defeat him in 2010. Burr’s decision to filibuster this bill, which many Democrats and liberals support, turns him from just another Southern Republican into a specific opponent. He is making himself more vulnerable because he is giving Democrats a real reason to strongly dislike him besides the fact that he is a Republican. They will want him out because of this action.

2. It doesn’t really help him a lot back home. Although North Carolina has long been known for it’s tobacco (people used to joke that the state motto was “Tobacco is a vegetable”), the tobacco industry no longer commands the influence it once had. The NC House just approved a bill to ban smoking in most businesses and restaurants, and polling showed that roughly two-thirds of North Carolinians supported the ban. By being so vocal, Burr will alienate urban and surburban voters in RTP and Charlotte who want tobacco to be more regulated. Most tobacco farmers would probably have voted for him anyway, so he will potentially lose more votes than he will gain from this. This

3. It furthers his image as an obstructionist. The Senate GOP has fallen in love with the filibuster, and Burr has been no exception. He has very few accomplishments he can point to other than being an ultraconservative, partisan Republican who opposed the Democrats who have controlled Congress for most of his term. The one time he gets a lot of national exosure, it is for opposing rather than supporting something.

In my opinion, Burr is the most endangered Republican incumbent in 2010 other than Jim Bunning. And unlike in Kentucky, it is unlikely that the GOP leadership will try to get Burr to retire or defeat him in a primary.

So I think this race is being overlooked by many national pundits, and it will prove to be one of our best pickup opportunities next November.

By what margin will Bob Shamansky win?

View Results

Loading ... Loading ...