UPDATED: The Age Gap

Most people agree voters tend to get more conservative as they age, but the age gap in 2008 (and 2004 as well) was huge compared to previous elections like 2000 and the previous few.  In this diary, I’m going to examine the age gap in every state from the 2008 presidential election to see which states are trending towards us in future elections and which away from us.  This would help the Democratic party focus its resources on states like North Carolina, which we all know IS trending towards us, and away from states like West Virginia, which aren’t.  However, when examining the data, I found quite a few surprises as well.  I’m going to start with states with about an average age gap (the Obama percentage of those under 30 minus that of seniors).

17% Gap:

This is still quite large, but these states don’t seem to be trending either way:

Missouri and Arkansas

  As it turned out, this actually surprised me a lot.  So what seems to be happening in these states, which obviously ARE trending red in PVIs, is that older Democrats are voting Republican more so than younger people are more Republican than their parents/grandparents.  This seems to be a phenomenon in quite a few Upper South states.

18% Gap:

Tennessee

  See Missouri and Arkansas for an explanation.  It’s a “the party left me” scenario.

Illinois

  This states seems to be holding quite steady.  The nice thing about the age gap is there’s no need to account for home-state effect, since EVERY voter in Illinois had Obama as their home-state senator.

Massachusetts

  Another blue state that doesn’t seem to be moving much either direction.

Nebraska and Kansas

  Two extremely similar states.  Despite Omaha moving leftward relatively quickly, I guess the rest of Nebraska must be making up for it somehow.

16%:

Florida

  Whites are moving right, but Hispanics are moving left.  They cancel each other out, basically.

Pennsylvania

  The west is moving right more quickly than the east is moving left, but the east is more populous.  Neutral as well.

Michigan

  The Grand Rapids area is moving leftward slightly as the Detroit area shrinks in clout and the suburbs hold relatively steady or move slightly left.  FL, MI, and PA are big swingy states (Michigan is Lean D, PA Tilt D, FL Tilt R in an average year) that are here to stay in the battleground.

15%:

Wisconsin

  Another Tilt/Lean D state that doesn’t have much of a trend.  The Midwest generally seems to be exemplifying this

Maryland

  A strongly blue state that’s not moving anymore, although it moved quite a bit in the 60s/70s/80s.  

Virginia

  There are two possibilities here:

1–It turns out that the state is no longer moving, and while no longer safe for Republicans, won’t become Lean D anytime soon or

2–The new Democrats moving here are in their late 20s or 30s and so mostly don’t fit into this younger age group.  I’m not sure which is the case, but you’ll see this again when it comes to a couple other states.

14%:

Montana

 At this point, it could almost be called a slight red trend, since the age gap is quite small, and older people in Montana actually tend to be more Democratic.

19%:

New Mexico

 Possibly a slight Democratic trend, but this evidence seems to show that New Mexico won’t become Safe D anytime soon.

Ohio

 This one surprised me.  I consider this state to be trending Republican long-term, as is much of the Great Lakes Region, but I may be wrong.  Your thoughts?

13%:

Vermont

 This states seems to have gotten as blue as possible at this point, so maybe that’s the reason the age gap is small.  Or it’s because everyone’s a Democrat.

20%:

Delaware

 Basically in the same boat as Maryland, maybe still getting a bit bluer.

Louisiana?!?!

 One of my big WTF states.  I’m not sure if there are more Black young people than White or what’s going on here.  Is Darth Jeff still around? Or GOPVoter of course.

Slight R:

12%:

Colorado

 Another surprise.  But I think this is similar to the Virginia case, where many young professionals in their 30s or late 20s move here and are more liberal.

Kentucky

 Definitely trending GOP.  No surprise here.

Hawaii

 Seems to have maxed out it’s blue-ness.

10%:

Rhode Island

 Extremely white and religious for such a blue state.  Plus it’s not really growing.  Anyways, not so much of an Obama age gap.

Minnesota

 The older people are actually more liberal than the younger ones here.  Minnesota is basically a Tilt D state, and should be a true toss-up soon, in my opinion.

Slight D:

22%:

New Jersey

 Many young Hispanics who vote overwhelmingly for our side.  

23%:

Texas

 This was a popular number.  Texas is in the D-trending states, but it’s not moving as fast as many others, as Texas Hispanics are more conservative than their California or East Coast counterparts.

Washington

 Still moving leftward, and I’m not sure it’s even winnable for the GOP anymore barring a landslide.

New York

 More minorities and few young people in Upstate, which is basically hemorrhaging population as we speak.

South Carolina

 Same boat as Texas, slowly moving left, but it’ll take multiple decades, most likely.

Maine

 Much of the Northeast is still moving our way.

Strongly Moving GOP:

9%:

Arizona

 You can’t chalk this up to John McCain.  Arizona just doesn’t seem to be trending our way like everybody thinks.  A 9% age gap in a state known for conservative seniors isn’t good whatsoever.

8%:

Idaho

 Did we THINK it was moving our way?

7%:

Oklahoma

 Same here.

6%:

South Dakota

 Same.  Another small rural Republican state not moving our way.

Wyoming

 See South Dakota.

5%:

New Hampshire

 This one’s a shocker.  Anyone wanna explain, because I really don’t understand it.

4%:

Oregon

 I think this is an extreme young professionals example.  Because Oregon is certainly not trending Republican like Wyoming.

3%:

West Virginia

  No surprise.

2%:

Georgia

 Either another extreme young professional effect, or we’ve been wasting our energy.  Only three states have a smaller age gap.

1%:

North Dakota

 Maybe Kent Conrad just saved himself a loss.

-1%:

Alaska and Utah

 That’s right, older people are MORE liberal here than younger ones.

Strong Dem Trend:

Here they are.  

26%:

Indiana and Nevada

Both of these states had big swings leftward over the past three years or so, and while many people think Indiana is an anomaly, I’m not so sure.  It swung back right in 2010, which Nevada didn’t really, but the youth in both states are extremely liberal compared to older folks, and in Indiana, they’re still mostly white as well.

27%:

Connecticut

Long a bastion of Yankee Republicanism, I was surprised to see how this was the Northeastern state with the biggest age gap, as it’s held almost completely stable since Bush 41 left office.  But here it is.

28%:

California

This was the leading vote-getter, and while it’s quite liberal, the age gap isn’t quite as large.  While the youth are like 3/4 Obama supporters, the seniors just aren’t conservative enough for a large age gap

29%:

Alabama

This was possibly the biggest shocker.  A red state that seems to be trending redder every election, and yet such a large age gap.  What gives?  More Blacks?  I’m not sure, since I really don’t think there are more liberal whites here in large numbers.  Maybe Gradydem can explain?

and..the top 2 are:

31%:

North Carolina

A swing state to stay, with huge college centers in Chapel Hill, Durham, and to a smaller extent Asheville and Boone.  I wasn’t surprised at all, but by number one…

33%:

Mississippi

That’s right.  Mississippi.  Only one person guessed this, comment if it was you.  This is a state Obama should be contesting long before Texas and possibly before Georgia.  The only states he didn’t win he should be putting money into are Missouri, Montana, Arizona, South Carolina, Mississippi, and maybe Georgia, in my opinion.

By what margin will Bob Shamansky win?

View Results

Loading ... Loading ...

Macro vs. Micro – 10 “weak” candidates that won in wave elections

One of the things that has come up in this election is whether the macro vs. micro climate, and which is better in terms of determining the outcome of this year’s election. Simply put, Republicans have nominated some pretty bad candidates (Angle, Paul, and possibly Buck, although I think the verdict might still be out on the latter) who would be unelectable in a different year.

Anyway, I thought it would be a fun exercise to put together a list of 10 candidates who were preceived as weak choices for their respective parties at the time, but went on to win in “wave” elections. Feel free to disagree or nominate your own choices below.

Gary Hart (D) vs. Peter Dominick (R), CO-SE, 1974

Peter Dominick was a two term Senator who had served only two years before as the chairman of the NRSC. His opponent was the upstart campaign manager of George McGovern’s disasterous bid for the presidency, which lost the state of Colorado by a substantial margin. But Hart took advantage of the post-Watergate environment to crush Dominick 57.2%-39.5%, beginning a political career that would end in Monkey Business thirteen years later

Alfonse D’Amato (R) vs. Elizabeth Holtzman (D) and Jacob Javitz (I), NY-SE, 1980

D’Amato, the presiding supervisor of the town of Hempstead was given little chance against longtime New York Senator Jacob Javitz, but taking advantage of Javitz’s illness and the conservative tide in 1980, he upset Javitz in the primary. Javitz decided to run as an independent in the general election, but instead of taking moderate Republican votes away from D’Amato he split the liberal and moderate base with Elizabeth Holtzman, who was vying to be the first woman Senator from NY, and in the year of Reagan’s first landslide D’Amato won a close race.

John LeBoutillier (R) vs. Lester Wolff (D), NY-6th District, 1980

Another New York race. LeBoutillier was the original wingnut, a 27-year old rabidly conservative Republican who beat a 16-year incumbent to win election to this Long Island district in this very Republican year. He only lasted one term before being ousted. He’s currently a columnist for NewsMax.com

Jesse Helms (R) vs. Jim Hunt (D), NC-SE, 1984

The always very controversial Helms was considered dead meat against North Carolina’s very popular Democratic governor Jim Hunt. Up until the last couple weeks of the campaign, Hunt was still the favorite in what was then considered one of the nastiest campaigns ever run in American history. But Helms rode the Reagan landslide win that year to hang on to his Senate seat.

Kent Conrad (D) vs. Mark Andrews (R), ND-SE, 1986

Andrews was a longtime North Dakota congressman who joined the Senate in 1980, receiving 70 percent of the vote. He looked so unbeatable for reelection that the state’s Democratic congressman, Byron Dorgan, took a pass. But North Dakota tax commissioner Kent Conrad stepped up to the race, and in a bad year for farm-state Republicans, beat Andrews in a suprise upset

Steve Stockman (R) vs. Jack Brooks (D), TX-9th District, 1994

Jack Brooks had been a congressman for 40 years and was chairman of the powerful House Judiciary Committee. Stockman was pretty much of a nobody who held no political office, although he had run against Brooks once before, in 1992, losing pretty badly. However, Brooks sponsorship of a crime bill opposed by the NRA along with being in the Republican wave year of 1994 doomed Brooks. Stockman, who was dogged by controversy throughout his term, lost to Nick Lampson in 1996.

Rod Grams (R) vs. Anne Wynia (D), MN-SE, 1994.

Grams was a one term congressman and former broadcaster who is likely the most conservative senator ever to be elected from Minnesota. Wynia was a well respected state legislator who was the benificiary of a campiagn by prominent Minnesota DFLers to elect a woman to the Senate. But, in the year of Republican sweep, Grams beat her in a very close race. He lost to Mark Dayton six years later.

Bill Frist (R) vs Jim Sasser (D), TN-SE, 1994

One more from the 1994 election debacle. Bill Frist was a prominent Tennessee physician and major stockholder in his family’s health care company. Jim Sasser was on the short list to succeed George Mitchell as Senate Majority Leader, and he was from a state the Clinton-Gore ticket had won two years before. But Tennessee took on a decidedly conservative bent in 1994, and Sasser lost by 13 points

George Allen (R) v. Jim Webb (D), VA-SE, 2006

In this case, it may not be that Jim Webb was neccesarily a weak candidate, but George Allen was perceived as so strong. A popular former Virgina governor and future Presidential candidate, Allen was viewed as the prohibitive favorite to win reelection, but in an upset prompted by his own stumbles and a good campaign run by Webb, he lost in a very close race.

Kay Hagan (D) vs. Elizabeth Dole (R), NC-SE, 2008

We all are familiar with this recent one, so no need to rehash it. Suffice it to say that no one would have predicted two years before an obscure state legislator would beat the head of the NRSC so badly.  

Party ID Data per 2004/2008 Exit Polls

GOPVOTER made a query about this data earlier and though this diary is intended for him I’m sure it proves to be a useful resource for everyone here at SSP.

We all know turnout from Republicans will be up and Democrats down from two years ago, the question is how much? Personally, I’ve been working under the assumption, based on the fact the change in New Jersey (competitive right until the end last November, unlike Virginia) was a six-point movement in favor of the GOP, of adding three to the Republican number and taking three from the Democratic number. Obviously it won’t be uniform like that but I think it a decent average by which to view the likely electorate this fall.

From left to right, Democrats, Republicans, Independents.

2004

Alabama

34-48-18

Alaska

19-41-40

Arizona

30-44-26

Arkansas

41-31-29

California

39-33-27

Colorado

29-38-33

Connecticut

37-30-33

Delaware

41-32-26

Florida

37-41-23

Georgia

34-42-24

Hawaii

40-24-36

Idaho

22-50-27

Illinois

39-34-27

Indiana

32-46-22

Iowa

34-36-30

Kansas

27-50-23

Kentucky

44-40-17

Louisiana

42-40-18

Maine

31-30-38

Maryland

48-30-22

Massachusetts

39-16-44

Michigan

39-34-27

Minnesota

38-35-27

Mississippi

38-47-15

Missouri

35-36-29

Montana

32-39-29

Nebraska

24-53-22

Nevada

35-39-26

New Hampshire

25-32-44

New Jersey

39-31-30

New Mexico

40-33-27

New York

45-29-26

North Carolina

39-40-21

North Dakota

27-41-32

Ohio

35-40-25

Oklahoma

40-43-16

Oregon

32-34-34

Pennsylvania

41-39-20

Rhode Island

39-16-45

South Carolina

33-44-23

South Dakota

32-47-21

Tennessee

32-40-28

Texas

32-43-24

Utah

19-58-24

Vermont

31-27-41

Virginia

35-39-26

Washington

36-32-33

West Virginia

50-32-18

Wisconsin

35-38-27

Wyoming

25-53-22

2008

Alabama

37-45-18

Alaska

20-37-43

Arizona

32-39-30

Arkansas

36-32-31

California

42-30-28

Colorado

30-31-39

Connecticut

43-27-31

Delaware

48-31-21

Florida

37-34-29

Georgia

38-35-28

Hawaii

45-20-34

Idaho

24-48-28

Illinois

47-28-26

Indiana

36-41-24

Iowa

34-33-33

Kansas

26-49-25

Kentucky

47-38-15

Louisiana

42-38-21

Maine

35-26-39

Maryland

51-28-21

Massachusetts

43-17-40

Michigan

41-29-29

Minnesota

40-36-25

Mississippi

40-45-15

Missouri

40-34-26

Montana

33-33-35

Nebraska

29-48-22

Nevada

38-30-32

New Hampshire

29-27-45

New Jersey

44-28-28

New Mexico

44-28-28

New York

50-26-25

North Carolina

42-31-27

North Dakota

28-38-33

Ohio

39-31-30

Oklahoma

41-44-14

Oregon

36-27-37

Pennsylvania

44-37-18

Rhode Island

42-16-42

South Carolina

38-41-20

South Dakota

36-42-22

Tennessee

32-33-35

Texas

33-34-33

Utah

21-50-29

Vermont

37-23-39

Virginia

39-33-27

Washington

36-26-39

West Virginia

48-34-19

Wisconsin

39-33-29

Wyoming

26-52-22

What if the 2003 Texas redistricting had never happened?

This diary takes a look at what might have happened if the 2003 Texas redistricting had never occurred. I compared the 2000 demographics and presidential results for the map used in the 2002 elections with the 2008 demographics and presidential results under the same lines. I used Dave’s App to do this, with the Test Data setting to get the political data, but the regular voting district map (without the Test Data setting) to get the correct demographic estimates. I also looked at the shifts for the districts during this time period and elaborated a bit on what might have occurred had this map remained in place for the rest of the decade. Please vote in the survey at the end as well. Thanks and enjoy!
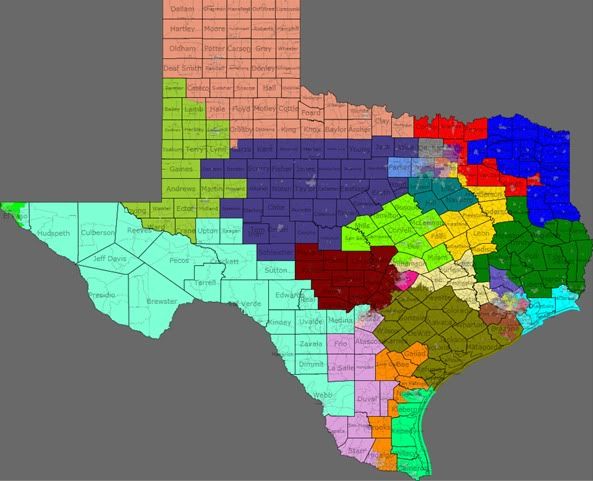
Statewide Map

Photobucket

East Texas

Photobucket

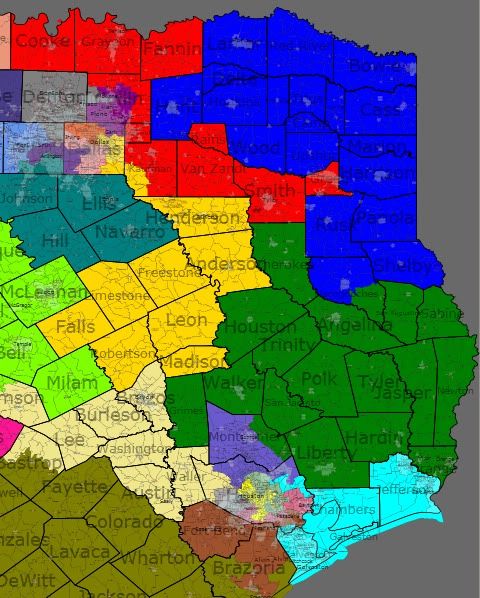
District 1 (Blue); Northeast Texas-Texarkana, Paris, Greenville, Nacogdoches, Marshall

2002 winner and winning percentage: Max Sandlin (D), 56%

% white % black % Hispanic % Asian Total district population
2000 population 75 16 7 0 651,619
2008 population (est.) 72 15 11 1 683,417
Change from 2000 to 2008 -3 -1 +4 +1 +31,798
2000 presidential results 2008 presidential results Partisan swing from 2000 to 2008
64% Bush-36% Gore 69% McCain-30% Obama +5% Republican, -6% Democratic

District 2 (Green): East Texas-Lufkin, Orange, Huntsville, Liberty

2002 winner and winning percentage: Jim Turner (D), 61%

% white % black % Hispanic % Asian Total district population
2000 population 76 14 9 0 651,619
2008 population (est.) 73 13 12 1 683,417
Change from 2000 to 2008 -3 -1 +3 +1 +37,712
2000 presidential results 2008 presidential results Partisan swing from 2000 to 2008
63% Bush-37% Gore 70% McCain-29% Obama +7% Republican, -8% Democratic

District 4 (Red): North and East Texas-Longview, Tyler, Sherman

2002 winner and winning percentage: Ralph Hall (D), 58%

% white % black % Hispanic % Asian Total district population
2000 population 77 12 9 1 651,620
2008 population (est.) 72 11 14 1 773,426
Change from 2000 to 2008 -5 -1 +5 0 +121,806
2000 presidential results 2008 presidential results Partisan swing from 2000 to 2008
70% Bush-30% Gore 70% McCain-29% Obama 0% Republican, -1% Democratic

District 9 (Light Blue): East Texas and Harris County-Beaumont, Port Arthur, Galveston, Texas City

2002 winner and winning percentage: Nick Lampson (D), 59%

% white % black % Hispanic % Asian Total district population
2000 population 60 21 14 3 651,619
2008 population (est.) 56 21 19 3 675,944
Change from 2000 to 2008 -4 0 +5 0 +24,325
2000 presidential results 2008 presidential results Partisan swing from 2000 to 2008
55% Bush-45% Gore 56% McCain-43% Obama +1% Republican, -2% Democratic

Dallas/Fort Worth Area

Photobucket

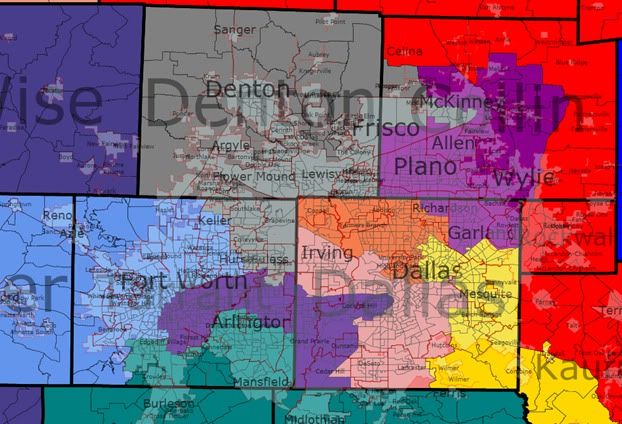
District 3 (Purple):Collin County and northern Dallas County-Richardson, Garland, Plano, McKinney

2002 winner and winning percentage: Sam Johnson (R), 74%

% white % black % Hispanic % Asian Total district population
2000 population 70 7 14 7 651,620
2008 population (est.) 61 9 18 10 898,778
Change from 2000 to 2008 -9 +2 +4 +3 +247,158
2000 presidential results 2008 presidential results Partisan swing from 2000 to 2008
72% Bush-28% Gore 60% McCain-39% Obama -12% Republican, +11% Democratic

District 5 (Yellow): Dallas County and Central/East Texas-Dallas, Mesquite, Palestine, Athens

2002 winner and winning percentage: Jeb Hensarling (R), 58%

% white % black % Hispanic % Asian Total district population
2000 population 63 16 18 2 651,620
2008 population (est.) 56 17 23 2 677,043
Change from 2000 to 2008 -7 +1 +5 0 +25,423
2000 presidential results 2008 presidential results Partisan swing from 2000 to 2008
62% Bush-38% Gore 57% McCain-42% Obama -5% Republican, +4% Democratic

District 6 (Dark Teal): Tarrant County and Dallas/Fort Worth suburbs and exurbs: Arlington, Ennis, Cleburne, Corsicana

2002 winner and winning percentage: Joe Barton (R), 70%

% white % black % Hispanic % Asian Total district population
2000 population 72 10 14 3 651,620
2008 population (est.) 67 11 18 3 748,734
Change from 2000 to 2008 -5 +1 +4 0 +97,114
2000 presidential results 2008 presidential results Partisan swing from 2000 to 2008
67% Bush-33% Gore 61% McCain-38% Obama -6% Republican, +5% Democratic

District 12 (Periwinkle): Tarrant and Parker Counties-Weatherford, Fort Worth, Keller

2002 winner and winning percentage: Kay Granger (R), 92%

% white % black % Hispanic % Asian Total district population
2000 population 71 5 20 2 651,619
2008 population (est.) 64 5 26 3 788,643
Change from 2000 to 2008 -7 0 +6 +1 +137,024
2000 presidential results 2008 presidential results Partisan swing from 2000 to 2008
67% Bush-33% Gore 65% McCain-34% Obama -2% Republican, +1% Democratic

District 24 (Dark Purple): Dallas and Tarrant Counties-Fort Worth, Arlington, Dallas, Duncanville

2002 winner and winning percentage: Martin Frost (D), 65%

% white % black % Hispanic % Asian Total district population
2000 population 35 22 38 3 651,619
2008 population (est.) 28 22 45 4 836,571
Change from 2000 to 2008 -7 0 +7 +1 +184,952
2000 presidential results 2008 presidential results Partisan swing from 2000 to 2008
46% Bush-54% Gore 36% McCain-63% Obama -10% Republican, +9% Democratic

District 26 (Dark Gray): Denton, Tarrant, and Collin Counties-Denton, Lewisville, Flower Mound, McKinney

2002 winner and winning percentage: Michael Burgess (R), 75%

% white % black % Hispanic % Asian Total district population
2000 population 78 5 11 4 651,619
2008 population (est.) 70 7 16 6 897,454
Change from 2000 to 2008 -8 +2 +5 +2 +245,835
2000 presidential results 2008 presidential results Partisan swing from 2000 to 2008
73% Bush-27% Gore 63% McCain-36% Obama -10% Republican, +9% Democratic

District 30 (Salmon): Dallas County: Dallas, Irving

2002 winner and winning percentage: Eddie Bernice Johnson (D), 74%

% white % black % Hispanic % Asian Total district population
2000 population 25 41 31 2 651,620
2008 population (est.) 19 39 39 2 726,340
Change from 2000 to 2008 -6 -2 +8 0 +74,720
2000 presidential results 2008 presidential results Partisan swing from 2000 to 2008
31% Bush-69% Gore 21% McCain-78% Obama -10% Republican, +9% Democratic

District 32 (Burnt Orange): Dallas County-Dallas, Farmer’s Branch, University/Highland Park, Irving

2002 winner and winning percentage: Pete Sessions (R), 68%

% white % black % Hispanic % Asian Total district population
2000 population 55 9 27 6 651,619
2008 population (est.) 44 9 38 7 703,588
Change from 2000 to 2008 -11 0 +11 +1 +51,969
2000 presidential results 2008 presidential results Partisan swing from 2000 to 2008
65% Bush-35% Gore 53% McCain-46% Obama -12% Republican, +13% Democratic

Houston Area

Photobucket

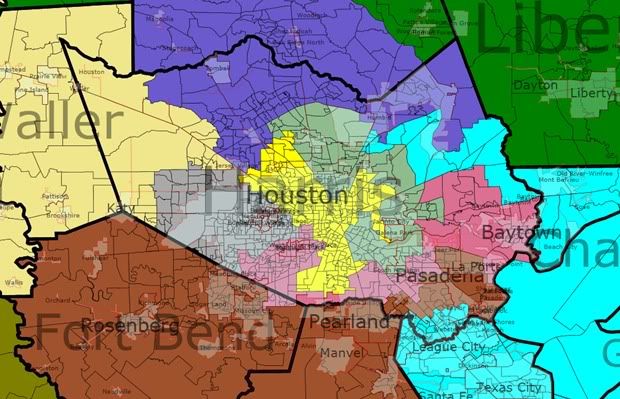
District 7 (Gray): Harris County-western Houston, the Villages

2002 winner and winning percentage: John Culberson (R), 89%

% white % black % Hispanic % Asian Total district population
2000 population 50 11 26 11 651,620
2008 population (est.) 43 11 32 12 746,517
Change from 2000 to 2008 -7 0 +6 +1 +94,897
2000 presidential results 2008 presidential results Partisan swing from 2000 to 2008
68% Bush-32% Gore 55% McCain-44% Obama -13% Republican, +12% Democratic

District 8 (Dark Lavender): Harris and Montgomery Counties-Jersey Village, Humble, Conroe

2002 winner and winning percentage: Kevin Brady (R), 93%

% white % black % Hispanic % Asian Total district population
2000 population 77 5 13 3 651,619
2008 population (est.) 71 6 18 4 846,293
Change from 2000 to 2008 -6 +1 +5 +1 +194,674
2000 presidential results 2008 presidential results Partisan swing from 2000 to 2008
78% Bush-22% Gore 71% McCain-28% Obama -7% Republican, +6% Democratic

District 18 (Banana Yellow): Harris County-Houston

2002 winner and winning percentage: Sheila Jackson-Lee (D), 77%

% white % black % Hispanic % Asian Total district population
2000 population 21 42 33 3 651,620
2008 population (est.) 18 41 38 3 779,948
Change from 2000 to 2008 -3 -1 +5 0 +128,328
2000 presidential results 2008 presidential results Partisan swing from 2000 to 2008
26% Bush-74% Gore 22% McCain-77% Obama -4% Republican, +3% Democratic

District 22 (Brown): Fort Bend, Brazoria, and Harris Counties-Rosenberg, Sugarland, Pearland, Pasadena

2002 winner and winning percentage: Tom DeLay (R), 63%

% white % black % Hispanic % Asian Total district population
2000 population 60 10 20 8 651,619
2008 population (est.) 52 12 23 12 866,297
Change from 2000 to 2008 -8 +2 +3 +4 +214,678
2000 presidential results 2008 presidential results Partisan swing from 2000 to 2008
68% Bush-32% Gore 59% McCain-40% Obama -9% Republican, +8% Democratic

District 25 (Dark Pink): Fort Bend and Harris Counties-Houston, Belaire, University Place, South Houston, Baytown

2002 winner and winning percentage: Chris Bell (D), 55%

% white % black % Hispanic % Asian Total district population
2000 population 37 23 34 5 651,619
2008 population (est.) 32 22 40 5 683,417
Change from 2000 to 2008 -5 -1 +6 0 +156,401
2000 presidential results 2008 presidential results Partisan swing from 2000 to 2008
48% Bush-52% Gore 41% McCain-59% Obama -7% Republican, +7% Democratic

District 29 (Grayish Green): Harris County-Houston, Jacinto City, Galena Park, South Houston

2002 winner and winning percentage: Gene Green (D), 95%

% white % black % Hispanic % Asian Total district population
2000 population 20 15 62 2 651,620
2008 population (est.) 16 13 68 2 825,305
Change from 2000 to 2008 -4 -2 +6 0 +173,685
2000 presidential results 2008 presidential results Partisan swing from 2000 to 2008
39% Bush-61% Gore 31% McCain-69% Obama -8% Republican, +8% Democratic

Central Texas

Photobucket

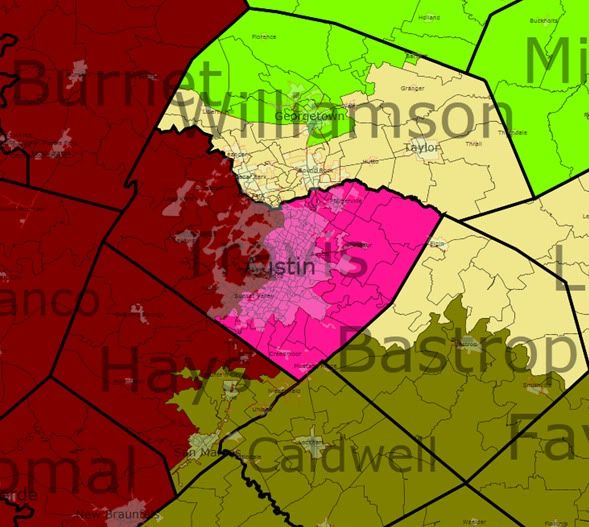
District 10 (Magenta): Travis County-Austin

2002 winner and winning percentage: Lloyd Doggett (D), 84%

% white % black % Hispanic % Asian Total district population
2000 population 50 11 33 4 651,619
2008 population (est.) 45 10 38 5 809,987
Change from 2000 to 2008 -5 -1 +5 +1 +158,368
2000 presidential results 2008 presidential results Partisan swing from 2000 to 2008
47% Bush-53% Gore 28% McCain-70% Obama -19% Republican, +17% Democratic

District 11 (Lime Green): Central Texas-Waco, Georgetown, Temple, Killeen

2002 winner and winning percentage: Chet Edwards (D), 52%

% white % black % Hispanic % Asian Total district population
2000 population 64 15 16 2 651,620
2008 population (est.) 61 15 20 2 742,620
Change from 2000 to 2008 -3 0 +4 0 +91,000
2000 presidential results 2008 presidential results Partisan swing from 2000 to 2008
67% Bush-33% Gore 61% McCain-38% Obama -6% Republican, +5% Democratic

District 14 (Bronze): Texas Hill Country and Texas Coastline-Victoria, San Marcos, Calhoun, Seguin

2002 winner and winning percentage: Ron Paul (R), 68%

% white % black % Hispanic % Asian Total district population
2000 population 58 8 32 1 651,620
2008 population (est.) 54 8 35 1 751,893
Change from 2000 to 2008 -4 0 +3 0 +100,273
2000 presidential results 2008 presidential results Partisan swing from 2000 to 2008
66% Bush-34% Gore 62% McCain-37% Obama -4% Republican, +3% Democratic

District 21 (Maroon): Central/West Texas-San Antonio, Austin, New Braunfels

2002 winner and winning percentage: Lamar Smith (R), 73%

% white % black % Hispanic % Asian Total district population
2000 population 77 2 17 2 651,619
2008 population (est.) 74 2 20 3 779,551
Change from 2000 to 2008 -3 0 +3 +1 +127,932
2000 presidential results 2008 presidential results Partisan swing from 2000 to 2008
73% Bush-27% Gore 62% McCain-37% Obama -11% Republican, +10% Democratic

District 31 (Beige): Central Texas and Houston suburbs/exurbs: Round Rock, Bryan, Sealy, Katy

2002 winner and winning percentage: John Carter (R), 69%

% white % black % Hispanic % Asian Total district population
2000 population 69 9 17 3 651,620
2008 population (est.) 64 9 21 4 780,639
Change from 2000 to 2008 -5 0 +4 +1 +129,019
2000 presidential results 2008 presidential results Partisan swing from 2000 to 2008
72% Bush-28% Gore 60% McCain-38% Obama -12% Republican, +10% Democratic

West Texas

Photobucket

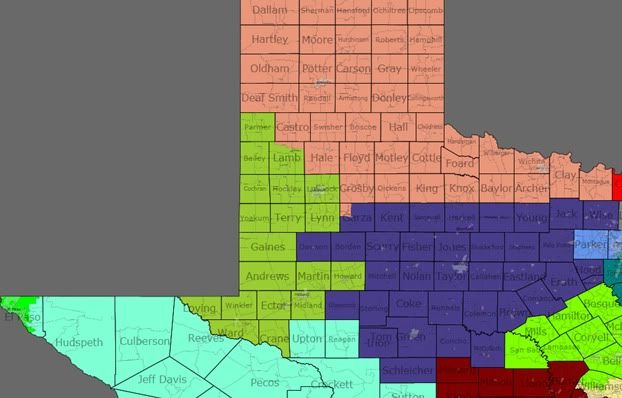
District 13 (Tan): West Texas-Wichita Falls, Amarillo

2002 winner and winning percentage: Mac Thornberry (R), 79%

% white % black % Hispanic % Asian Total district population
2000 population 70 6 22 1 651,619
2008 population (est.) 65 6 26 1 654,677
Change from 2000 to 2008 -5 0 +4 0 +3,058
2000 presidential results 2008 presidential results Partisan swing from 2000 to 2008
75% Bush-25% Gore 76% McCain-23% Obama +1% Republican, -2% Democratic

District 16 (Bright Green): El Paso County: El Paso

2002 winner and winning percentage: Silvestre Reyes (D), unopposed

% white % black % Hispanic % Asian Total district population
2000 population 17 3 78 1 651,619
2008 population (est.) 14 3 81 1 683,417
Change from 2000 to 2008 -3 0 +3 0 +59,428
2000 presidential results 2008 presidential results Partisan swing from 2000 to 2008
41% Bush-59% Gore 33% McCain-66% Obama -8% Republican, +7% Democratic

District 17 (Iris): West Texas: Abilene, San Angelo

2002 winner and winning percentage: Charlie Stenholm (D), 51%

% white % black % Hispanic % Asian Total district population
2000 population 75 4 20 1 651,619
2008 population (est.) 71 4 23 1 683,417
Change from 2000 to 2008 -4 0 +3 0 +16,986
2000 presidential results 2008 presidential results Partisan swing from 2000 to 2008
72% Bush-28% Gore 75% McCain-24% Obama +3% Republican, -4% Democratic

District 19 (Pea Green): West Texas-Lubbock, Big Spring, Midland, Odessa

2002 winner and winning percentage: Larry Combest (R), 92%

2003 special election winner and winning percentage: Randy Neugebauer (R), 51%

% white % black % Hispanic % Asian Total district population
2000 population 58 6 34 1 651,619
2008 population (est.) 53 6 39 1 689,654
Change from 2000 to 2008 -5 0 +5 0 +38,035
2000 presidential results 2008 presidential results Partisan swing from 2000 to 2008
76% Bush-24% Gore 73% McCain-27% Obama -3% Republican, +3% Democratic

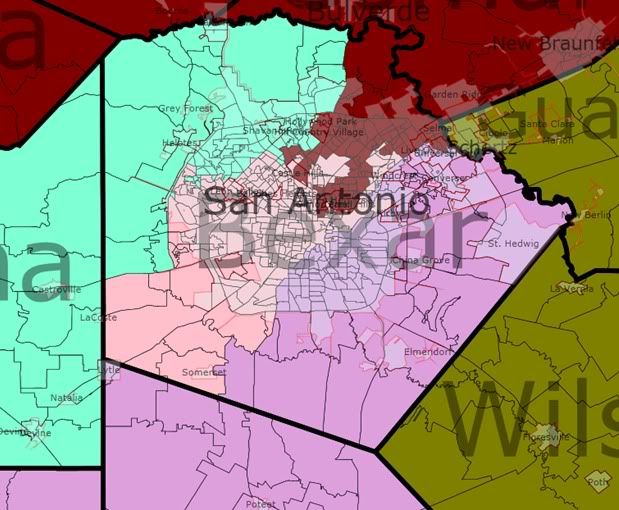
San Antonio and South Texas

Photobucket

Photobucket

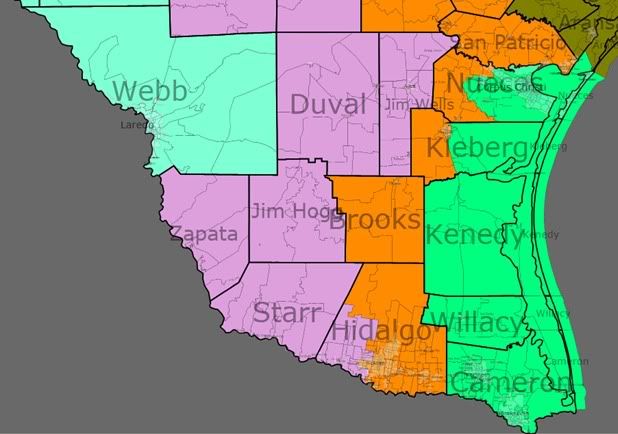
District 15 (Tangerine): South Texas- McAllen, Kingsville

2002 winner and winning percentage: Ruben Hinojosa (D), unopposed

% white % black % Hispanic % Asian Total district population
2000 population 17 3 78 1 651,619
2008 population (est.) 14 3 81 1 711,047
Change from 2000 to 2008 -3 0 +3 0 +59,428
2000 presidential results 2008 presidential results Partisan swing from 2000 to 2008
41% Bush-59% Gore 33% McCain-66% Obama -8% Republican, +7% Democratic

District 20 (Light Pink): Bexar County-San Antonio

2002 winner and winning percentage: Charlie Gonzalez, unopposed

% white % black % Hispanic % Asian Total district population
2000 population 24 5 68 1 651,619
2008 population (est.) 21 5 71 2 776,861
Change from 2000 to 2008 -3 0 +3 +1 +125,242
2000 presidential results 2008 presidential results Partisan swing from 2000 to 2008
43% Bush-57% Gore 36% McCain-63% Obama -7% Republican, +6% Democratic

District 23 (Light Blue): West and South Texas: El Paso, Eagle Pass, Laredo, San Antonio

2002 winner and winning percentage: Henry Bonilla (R), 52%

% white % black % Hispanic % Asian Total district population
2000 population 30 1 67 1 651,619
2008 population (est.) 27 1 69 1 728,212
Change from 2000 to 2008 -3 0 +2 0 +76,593
2000 presidential results 2008 presidential results Partisan swing from 2000 to 2008
59% Bush-41% Gore 50% McCain-49% Obama -9% Republican, +8% Democratic

District 27 (Spring Green): South Texas-Corpus Christi, Harlingen, Brownsville

2002 winner and winning percentage: Solomon Ortiz, 61%

% white % black % Hispanic % Asian Total district population
2000 population 25 2 72 1 651,619
2008 population (est.) 21 2 75 1 717,846
Change from 2000 to 2008 -4 0 +3 0 +66,227
2000 presidential results 2008 presidential results Partisan swing from 2000 to 2008
49% Bush-51% Gore 43% McCain-56% Obama -6% Republican, +5% Democratic

District 28 (Rose): South Texas and Bexar County: San Antonio, McAllen

2002 winner and winning percentage: Ciro Rodriguez (D), 71%

% white % black % Hispanic % Asian Total district population
2000 population 21 8 70 1 651,620
2008 population (est.) 19 7 72 1 761,316
Change from 2000 to 2008 -2 -1 +2 0 +109,696
2000 presidential results 2008 presidential results Partisan swing from 2000 to 2008
41% Bush-59% Gore 36% McCain-63% Obama -5% Republican, +4% Democratic

So what would have happened in the past three elections had this map stayed in place for the rest of the decade? Often people assume that the Anglo Democratic incumbents who were targeted would have been reelected had the redistricting not occurred. This is definitely true in the case of Martin Frost, Lloyd Doggett, and Chris Bell, whose already Democratic and urban districts have shifted even more to the left since 2000. But the other Anglo Democrats largely came from more rural, Republican-leaning areas, and their districts all went for Bush in 2000. This list includes Max Sandlin, Jim Turner, Ralph Hall, Nick Lampson, Chet Edwards, and Charles Stenholm. Now let’s look at a county map of Texas showing the change between 2000 and 2008, with the congressional districts where Gore outperformed Obama superimposed over the map.

Photobucket

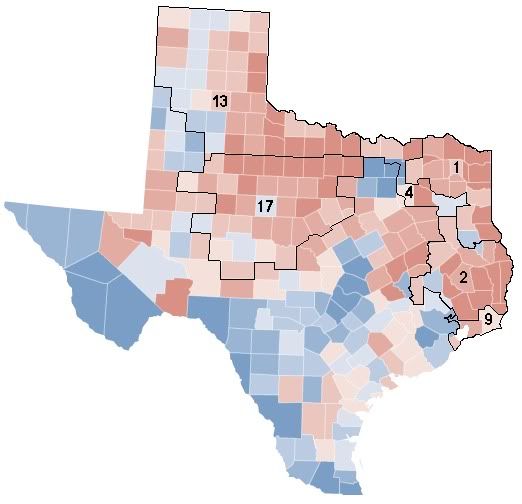
Despite a roughly 4% move towards the Democrats statewide between 2000 and 2008, there were 6 congressional districts where Obama  actually did worse than Gore: TX-01 (Max Sandlin (D)), TX-02 (Jim Turner (D)), TX-04 (Ralph Hall (D)), TX-09 (Nick Lampson (D)), TX-13 (Mac Thornberry (R)), and TX-17 (Charlie Stenholm (D)). Besides TX-13, all of these districts elected Democrats in 2002. In addition, all of the Anglo Democrats elected in districts that Bush won in 2000 saw their districts become more Republican over time, with one exception. TX-11 in Central Texas would have become notably more Democratic during this time period, and  its representative, Chet Edwards, is the only one of these men still in office as a Democrat.

However, I am not convinced that the marked rightward shift would have occurred inevitably had the boundaries not changed in the 2003 redistricting. Many residents in these districts were trending Republican at the presidential level, but felt comfortable continuing to vote for Democrats at the congressional level. But in 2004, the redrawn districts included areas that had previously been represented by Republicans or by other targeted Democratic members, meaning the advantage of incumbency was greatly diminished. This led to the defeat, party switching, or retirement of all the legislators listed above, but I believe, also contributed to these areas becoming more Republican at the presidential level in 2004 and 2008. Without the option to vote for a familiar incumbent Democrat for Congress further down the ballot, voters felt less inclined to vote for a Democrat at any level, including President. Had the 2003 redistricting not occurred, I believe not only that several of these lawmakers might still be in office, but Obama may have even performed better in these districts in 2008.

Other than the representatives just discussed, I believe that all of the other Democratic and Republican incumbents would still be in office right now, with the possible exceptions of John Culberson (R, 7th) and Henry Bonilla (R, 23rd), whose districts would have become much more competitive by the end of the decade. But I think this analysis shows that in the long-term, Texas is turning blue, and it is only a matter of time before the shifts to the Democrats in the Houston area, the Dallas/Forth Worth Area, and Central Texas finally push Texas into the Democratic column.

By what margin will Bob Shamansky win?

View Results

Loading ... Loading ...

Breaking up Texas

After reading this entry http://www.fivethirtyeight.com… by Nate Silver at FiveThirtyEight about dividing Texas up into 5 states I became interested in other possibilities.  After all, as the second most populous state in the nation there is certainly enough people to make several decently sized states.  To pay homage to Nate Silver for the idea I decided to keep a few of the states names, one of which is almost identical to what he did since it was so awesome.  Using Daves redistricting application this is my vision of Texas.  A few major differences between the 538 version and my version is that I have no problem splitting up metropolitan areas.

Plainland

The plains of west Texas are conservative.  So conservative that Plainland would be the most conservative state in the United States giving Barack Obama a mere 24% of the vote to John McCain’s 75%.  If you are not familiar with Texas do not let the geographic size fool you, it is the least populated of the new states.  If a Liberal, Progressive or Democrat gets off on getting crushed in elections and wants to put on a token campaign Plainland is the place.

Population:  2,547,860

Demographics:  71% White, 4% Black, 23% Hispanic, 2% Asian

2008 Vote:  McCain 75% Obama 24% Other 1%

Major Cities:  Lubbock, Amarillo, Witchita Falls

Congressional Seats: 3

East Texas

East Texas is slightly more populated that Plainland.  The small population increase may be enough to give East Texas an additional congressional seat.  The partisan difference between Plainland and East Texas is minimal.  Giving Barack Obama 29% of the vote compared to John McCain’s 70%.  Don’t expect much love for Liberals, Progressives or Democrats here since Plainland would be the second most conservative state in the United States based on 2008 Presidential Election results.  East Texas expands down into the greater Houston Metro area and is home, like Plainland, to several of the lesser populated DFW Metro area counties.

Population:  2,775,191

Demographics:  75% White, 13% Black, 10% Hispanic, 2% Asian

2008 Vote:  McCain 70% Obama 29%, Other 1%

Major Cities:  Tyler, Longview, College Station-Byran

Congressional Seats: 4

Trinity

Names after the trio of major cities which comprise the majority of the states population, Dallas-Fort Worth-Arlington.  The four county conglomeration comprises the overwhelming majority of the population with the most of the remainder along I-35 running south including the cities of Waco, Killeen-Temple, Georgetown and Round Rock.  Dallas and Fort Worth would run the show and I suspect a death match of monumental proportions would ensue to see who gets the title of “State Capitol.”  At last we have a state where there is a county which voted for Barack Obama.  Dallas County gave Barack Obama a respectable 57% of the vote in 2008, also Dallas County has by itself has a population roughly equal to Plainland.  However in Trinity Dallas County was the only county to vote for Obama.  Based on the 2008 results Trinity would essentially be a smaller  version of old Texas mirroring the 55%-44% McCain-Obama results.  Given the large population Trinity would be home to 11 congressional seats.  

Population:  7,620,736

Demographics:  62% White, 13% Black, 20% Hispanic, 5% Asian

2008 Vote:  McCain 55% Obama 44%, Other 1%

Major Cities:  Dallas, Fort Worth, Arlington, Waco

Congressional Seats: 11

Gulf Land

With a population of 9,142,795 Gulfland is the most populous of the new states.  Austin would remain as the state Capital and the largest city is Houston.  Barack Obama would have won Gulf Land in by a slim 3% margin, roughly 73,000 votes.  As a slightly GOP leaning swing state Democrats would have to rely on serious get out the vote efforts in Travis, Harris and Hidalgo Counties to pull off wins.  One item I have neglected to speak about up to this point is demographics.  As seen in Plainland and East Texas they are rather bland, very white, Trinity is a bit more diverse.  However Gulfland would join the rank of majority-minority states at 44% white, 38% hispanic, 13% black and 5% asian.  

Population:  9,142,795

Demographics:  44% White, 13% Black, 38% Hispanic, 5% Asian

2008 Vote:  Obama 51% McCain 48% Other 1%

Major Cities:  Houston, Austin, Corpus Christi, McAllen-Edinburg

Congressional Seats: 13

El Norte

This would be a Democratic strong hold.  Obama would have won El Norte with a 13% margin, larger than Pennsylvania.  The cities of San Antonio and El Paso bring the majority of the population here.  However El Norte is not that populous, in fact it’s population is only about half a million larger than Plainland.  However that may be enough to give El Norte 5 seats.  

Population:  3,155,854

Demographics:  28% White, 5% Black, 64% Hispanic, 4% Asian

2008 Vote:  Obama 56% McCain 43% Other 1%

Major Cities:  San Antonio, El Paso

Congressional Seats: 4 or 5

The congressional seat estimates were done in an incredibly rough manner.  

By what margin will Bob Shamansky win?

View Results

Loading ... Loading ...

Ohio, Part 4

By: http://thepolitikalblog.wordpr…

This is the last part of my review of the swing state Ohio.

Republican Ohio

What parts of Ohio vote Republican?

All of it, of course, except for the parts that vote Democratic.

That is a pretty facetious answer to a fairly serious question, but there is something to it. Blue Ohio has a set of defined, separate characteristics. Red Ohio does too, but not to the same degree. It is far easier to describe Democratic Ohio than Republican Ohio.

The following map is a good beginning in exploring Republican Ohio.

Photobucket

These are the places which most heavily supported John McCain (for those who are curious, the most Democratic counties were Cleveland, Toledo, Ohio University, and Youngstown). They are located primarily in the southwestern portion of the state, away from the Democratic ‘7’. Interestingly, practically none are part of Appalachia – considered Obama’s weakest region in the country.

Southwest Ohio historically – and to this day remains – the most conservative part of Ohio. Geographically, it is the Republican base; even in Democratic landslides, it often will vote for the red candidate.

There is another trait the highlighted counties have in common: most are semirural and somewhat less populated. Another map helpfully illustrates this.

Photobucket

Compare the two maps. Very few of the counties in which John McCain took over 60% of the vote were populated enough to appear on the above map. There is very little overlap between the reddest parts of Ohio and the densest parts of Ohio – except, importantly, the suburbs of Cincinnati.

More below the flip.

This does not mean, however, that all counties with over fifty thousand votes went blue. Quite the opposite, in fact: many of the yellow counties voted for McCain. Only counties with over one hundred thousand votes tread Democratic. Take a look:

Photobucket

What does this mean?

The yellow counties are an imperfect representation of what famously cost John Kerry the state: the exurban reaches of Ohio, especially in Columbus and Cincinnati. Most of them are well-off and home to middle-class folk, like exurbs in general. White flight played an important role in their formation (although it was not, as some maintain, the biggest motivator). Both McCain and Bush got their largest margins from these places; they constitute an important – perhaps the most important – block of the GOP coalition today.

This has not always been the case. Before 2000, Hamilton County (Cincinnati) tended to give Republican candidates their biggest margins in the state. Today, it has been replaced by the surrounding counties, rapidly growing exurban communities. Nevertheless, Hamilton County remains a reliable Republican stronghold.

Contrary to popular perception, the city Cincinnati itself is not that conservative (not anymore); its deep red suburbs account for the county’s Republican lean. Cities in general never vote Republican, but in GOP strongholds – like Cincinnati – the overwhelmingly red suburban vote outweighs their Democratic lean.

For a visual illustration of Cincinnati’s importance, here is how George Bush did in Ohio:

Photobucket

Cincinnati and its surrounding exurbs provide the largest Republican margins. The exurbs of Columbus are going heavily Republican; so is much of eastern Ohio.

Note, however, that George Bush only won the state by 3.5%. Unfortunately the Times does not have maps of stronger Republican victories (e.g. 1988, 1980).

How has the Republican base changed since 2000? The following map provides a sense of how things stand today.

Photobucket

There is not too much to show. One can see a coherent north-south divide; northern Ohio has become more Democratic, southern Ohio less so. Most of the rural southwest is fairly lukewarm to Obama – but so is the blue east. Interestingly, the exurbs seem to have moved Democratic more than their rural brethren. Note that most counties are blue because the country as a whole voted more Democratic in 2008.

It is difficult to tell how much of this is permanent and how much was specific to 2008. Perhaps the exurban counties were only bluer because of the housing crisis. Certainly a place like Cincinnati (with its large black population) voted for Obama as a person, not the Democratic party. Then again, maybe not; the county supported Bush ’04 by only 5%.

But as a whole, red Ohio seems to vote the same way it has for the past few years (or generations). Neither it nor the Ohio Republican Party has changed much in recent years. The same cannot be said for the Democrats.

Ohio, Part 2

By: Inoljt, http://thepolitikalblog.wordpr…

This is the second part of an analysis on the swing state Ohio.

Photobucket

Unlike Florida and Pennsylvania, Ohio cannot be easily divided into geographically distinct regions (although they do exist). Instead, I will be examining it through the lens of both partys’ strongholds in the state.

History

During the late eighteenth century Ohio was a consistently Republican state, the equivalent today of North Dakota or Arizona. Democrats often came close behind – four or five points – but never quite won the state until 1912. Their stronghold lay in a ring of rural counties populated by German immigrants (a pattern that has completely disappeared today). But this was never enough to overcome Republican strength everywhere else.

It was Franklin Roosevelt who changed this pattern forever. He laid the foundations of Ohio’s structural politics, which exist to this very day. Roosevelt brought in previously hostile working-class counties along the northeast section of the state. He also shifted most of Ohio’s northern cities to the Democratic side – which had previously leaned Republican.

To see the effect, here is Roosevelt’s 2.85% victory in 1932:

Photobucket

Here is his 4.4% victory eight years later:

Photobucket

The maps are practically inverses of each other – courtesy of the New Deal.


Democratic Ohio

Today Roosevelt’s coalition remains, for the moment, intact; Democrats still dominate the union vote and northern cities. Because both populations reside along Ohio’s northern and eastern borders, Ohio’s Democratic results often form a blue “7.” The greater the Democratic margin of victory, the “fatter” and more defined the shape becomes.

For example, below the flip is Bill Clinton’s 1996 performance, in which he took the state by 6.4%.

Ohio, Part 1

By: Inoljt, http://thepolitikalblog.wordpr…

Is Ohio a liberal place? Or is it a conservative place?

I suspect far more people would say the latter rather than the former.

In many respects, Ohio is politically similar to Florida. Both are well-known swing states that hold a bountiful electoral prize. Both lean Republican. Both have large cites that function as pools of Democratic votes. Both also have considerable rural, Republican regions.

But in other ways they could not be more different. Sunny Florida is diverse, growing, and service-oriented. While Florida often votes Republican, it is not exactly conservative. Cold, northern Ohio is a rust-belt giant. It is not very diverse. It is definitely not growing. Florida is new. Ohio is old and conservative.

For the moment Ohio is a bit more conservative than the country at large. For the past eight out of nine presidential elections, it has been a bit redder than the nation. Not much redder, but enough to be noticeable.

Photobucket

I do not think that the future looks bright for the Democratic Party in Ohio. The two are moving in opposite directions. Demographically, Ohio is staying static while the country at large changes. And there are not many truly liberal spots in Ohio – places like Boulder, CO or Seattle. There never were.

Ohio has a lot of unionized, working-class folk who are still voting against Herbert Hoover; they are a core part of its Democratic base. I am not sure how long they will continue to support a party that is becoming, quite frankly, fairly upper-class in ethos. People in West Virginia certainly don’t anymore.

Not that Ohio is doomed to become a Republican stronghold. Places like Columbus are rapidly turning blue, perhaps fast enough to offset losses in working-class counties. And it isn’t inevitable that those counties will start voting Republican. If West Virginia is a prime example of working-class voters who deserted the Democratic Party, Michigan is a prime example of working-class voters that still support it. Barack Obama won a landslide in that state.

Nevertheless, my gut still tells me that Ohio and the Democratic Party are shifting farther and farther away from each other. These things can reveal themselves very quickly in politics. In 1988, California was a red state that had voted Republican for six elections in a row. Then one day it was won by Bill Clinton – and it has never gone back since then. In 1996 West Virginia had gone blue for five out of the past six elections. Then George Bush won the state – and now we consider it a rock-hard Republican state.

That may be the fate of Ohio.

Proposal For 2012 Primaries

From December 2007 to March 2008, I wrote various drafts of a proposal on how our political parties — starting in 2012 — might adopt primary election procedures that would better serve our country in selecting presidential candidates. I originally drafted a hypothetical calendar for 2008, based on general election results from 2004. Now that we have the results for 2008, I can now propose a calendar specific to 2012.

The system by which our parties choose their presidential candidates has proven itself to be, at best, highly questionable — at worst, severely flawed.

The primary calendar we need most is one that is built on an orderly and rational plan — one that is based on mathematics and on recent historical outcomes — and not on an arbitrary, publicity-driven, system of one-upsmanship. The change I propose would provide for a more effective, equitable process than the one we have now.

The following factors are the key ones to consider:

Margin of Victory

– The state primaries would be placed in order according to the leading candidates’ margins of victory in the preceding general election — with the states registering the closest margins of victory going first.

For example, John McCain won Missouri by 0.1% and Barack Obama won North Carolina by 0.4%; conversely, McCain won Wyoming by 33%, and Obama won Hawaii by 45%. Therefore, the primary calendar I propose would commence with primaries being held in states such as Missouri and North Carolina — and would close with such states as Wyoming and Hawaii.

– The purpose of ordering the states according to the margin of victory is to help the parties determine which candidates can appeal to those states that have found themselves most recently on the Electoral Divide. A narrow margin in the general election is reflective of an evenly divided electorate. In this scenario, a candidate who appeals to, say, Florida and Montana is more likely to appeal to a greater number of Americans on the whole.

Iowa, New Hampshire, and Fairness

– Iowa and New Hampshire might object to this new system, given their longstanding tradition of being the first states to cast their ballots. However, so long as Iowa and New Hampshire retain their record of being fairly bipartisan states, they’ll maintain their position towards the front of the primary schedule.

– Just because a state should have its primary later in the season does not mean that that state will prove invaluable to the process. Indiana and North Carolina weren’t held until May 6th, but those two states might have very well decided the fate of the 2008 Democratic nomination.

– This new system allows other states to play a greater role in how the parties select their candidates. For example, Missouri and North Carolina would be two of the states to get the limelight in 2012. Likewise, based on the results to come in November of 2012, a still-different slate of states could have a more significant role come 2016. A rotating system will be healthier and fairer.

Groupings of Five, and Timing & Spacing

– By placing states into groupings of five, no one state will be overly emphasized on any given date.

– Candidates will still need to address the concerns of individual states, whilst having to maintain an overall national platform. For example, a candidate will be less able to campaign against NAFTA in Ohio whilst campaigning for it in Florida.

– Given that each state has its own system for electing its delegates, these groupings of five states will act as an overall balancer. Ideally, caucuses will be done away with altogether by 2012. However — should that not happen — states with caucuses, states with open primaries, and states with closed primaries can all coexist within a grouping, therefore no one system will hold too much influence on any given date.

– Racial and geographic diversity in this process has been a great concern for many. The narrowest margins of victory in 2008 were in a wide variety of regions — the Midwest, the Great Lakes, the Mid-Atlantic, the South, and the West.

– All parties would have an interest in addressing these narrow-margined states early on. The incumbent will want to win over those states that were most in doubt of him in the previous election, and opposing parties will want to put forth candidates who have the best chance of winning over those very same states.

– Primaries will be held biweekly, giving candidates and the media enough time to process and respond to the outcomes of each wave of primaries.

– Washington DC will be placed in the same grouping as whichever state — Virginia or Maryland — is closer to its own margin of victory.

– American Samoa, Guam, Puerto Rico, and Americans Abroad — not having Electoral votes of their own — will determine their own primary dates, so long as they occur between the first grouping and the last grouping.

Under these guidelines, the proposed calendar for the 2012 primary season is:

January 2012

Tue, 1/10

Missouri

North Carolina

Indiana

Florida

Montana

Tue, 1/24

Ohio

Georgia

Virginia

Colorado

South Dakota

Tue, 2/7

North Dakota

Arizona

South Carolina

Iowa

New Hampshire

Tue, 2/21

Minnesota

Pennsylvania

Texas

Nevada

West Virginia

Tue, 2/26

Mississippi

Wisconsin

New Jersey

New Mexico

Tennessee

Tue, 3/6

Kansas

Nebraska

Oregon

Kentucky

Michigan

Tue, 3/20

Washington

Maine

Louisiana

Arkansas

Alabama

Tue, 4/3

Connecticut

California

Illinois

Delaware

Maryland

Washington DC

Tue, 4/17

Alaska

Idaho

New York

Massachusetts

Rhode Island

Tue, 5/1

Utah

Oklahoma

Wyoming

Vermont

Hawaii