MO-Missouri Redistricting

Okay, so as my first diary, I’m sure this is overly long, but I wanted to add a lot of data and analysis as I could because I am relentlessly geeky.

So read on, if you dare…

Shout-out: Dave’s Redistricting App.

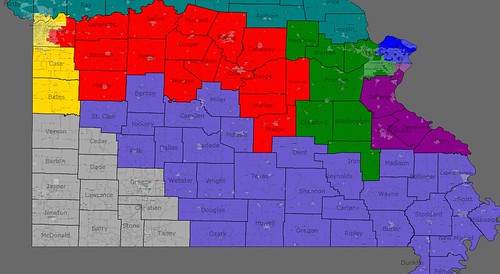
Missouri Congressional districts Post-2010 Census

With Missouri most likely dropping a seat and with the redistricting authority evenly split between the Democratic Governor and Republican Legislature, incumbency protection and relatively even numbers of safe and swing districts should be considered priorities. Plus, with the political battles likely to be intense enough to be settled by an independent-ish panel, I figured that drawing geographically-sensical boundaries would also be important.

Therefore, I tried to keep each county in the same district (which I did successfully, barring the expected biggies–Kansas City’s Jackson and St. Louis city and county). This was done as a proxy for the “communities of interest” standard that seems to crop up when redistricting time rolls around, but I ain’t a lawyer and don’t know about no redistrictin’.  

An added bonus of this map is that each area is contiguous and geographically-sensible. Finally, in terms of population, each of the 8 districts clocks in around 739,000 using the awesome Dave App’s “Use New Pop Est” feature. The biggest variance is less than 5,000 + or – and I figure some changes from the estimate are to be expected, so some tussling around the edges should be expected. The counties of Gasconade, Crawford, Phelps, Dent, Iron, St. Francois, Montgomery and St. Clair could all be shifted between at least 3 Congressional districts to equalize populations and still be a part of pretty sensible, contiguous districts. So what I’m trying for is a good working template for starting negotiations.

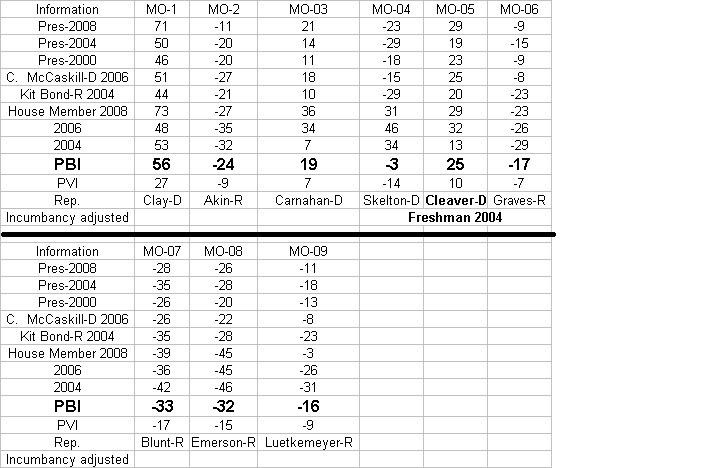
Relevant recent races:

Governor – 2008 — Democrat Jay Nixon vs. Republican Kenny Hulshof 58.4-39.5

Longtime Attorney General Jay Nixon stomped the lackluster Hulshof (after Sarah Steelman weakened him severely in the primary). I use this as a sort of shorthand for what a reasonably strong Democrat could potentially do. (although some Congressmen like Ike Skelton defy the odds even further once they’re entrenched incumbents). Basically, a solid, local but new-to-a-seat Democrat could outpoll Nixon by a few points, perhaps, but not much more.

President – 2008 — Democrat Barack Obama vs. Republican John McCain 50-50

Missouri’s bellweather status ended when McCain took a 4,000 vote victory over Obama out of almost 3 million ballots cast (ftr, national average was 53-47-ish). It’s an interesting shorthand for outsiders, but its variance from the Nixon numbers is an important insight into the actual voters of a county.

With that, here we go….
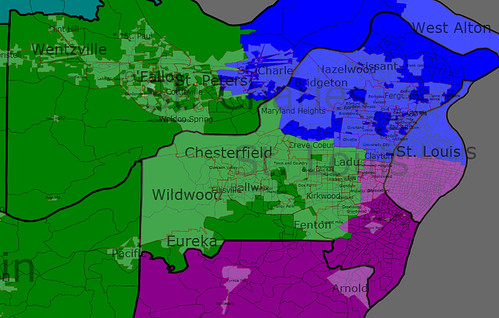
St. Louis Close-Up

———–

Blue-District 1: Rep. Clay, D

Residence: St. Louis

Old Cook PVI: D+27

Gains: much of the city of St. Charles, plus that county’s eastern reaches

Loses: fairly small parts of St. Louis county & St. Louis proper

Keeps: Half of St. Louis proper, northeast chunk of St. Louis county

Analysis: As drawn, the massively-Dem PVI will shrink, but only modestly, probably to around D+16 or so. I would expect neighborhood tweaks because STL is the most densely-populated part of the state. Instead of black-majority, this district will be almost evenly matched, about 51% white to 42% black according to the app, but I’m going out on a limb and saying that shifts in population (ie-the inner suburbs getting more racially-mixed) will make this really, really close by the time the Census is held.

Effectively, St. Charles may tip the racial balance, but likely not the political one. Clay, one of MO’s two African-American Congressmen, should definitely be safe in this district, whatever its racial makeup. If the Voting Rights Act requires a black district, it should be easy enough to shift a few precincts on the margins (ie-losing parts of St. Charles, adding parts of STL) to bump it up to 50% black.

———————-

Green-District 2: Todd Akin, R

Old PVI: R+9

Residence: Town & Country

Gains: Montgomery County (pop. 12,000), Warren Co. (30,000), Franklin (100,000), Crawford (23,000), Washington (23,000), Iron (10,000), southwestern St. Charles county

Loses: Lincoln county (pop. 51,500), eastern St. Charles county

Keeps: Most of St. Charles county (though not St. Charles itself) and southwest St. Louis county

Franklin:   Obama-McCain 43-55, Nixon-Hulshof 51-47

Warren: Obama-McCain 43-56, Nixon-Hulshof 49-49

Washington:  Obama-McCain tie (5-vote margin), Nixon vs. Hulshof 67-31

Crawford: Obama-McCain 40-60, Nixon-Hulshof 52-46

Iron: Nixon-Hulshof 64-33, Obama-McCain 50-47

Analysis: Akin keeps most of his base in the western and southern sections of St. Louis county, but he loses part of St. Charles and picks up a set of rural-ish counties in return. Those rural-ish counties aren’t quite as Republican-friendly as he’d like–Obama won Washington & Iron, and stayed competitive in the rest, while Dem Gov. Nixon did very well in all of them.

The rural counties provide about 200,000 residents, while suburbanites (read: most of Akin’s base) make up the rest of this district. Akin is weakened, but only slightly. This should count as a “safe Republican” seat, especially because most of the St. Charles areas I removed are the swingiest parts of the county.

————

Purple-District 3: Russ Carnahan, D

Residence: St. Louis

Old PVI: D+7

Gains: A few more bits of St. Louis, plus St. Francois & Perry counties

–St. Francois county, pop. 63,000

Nixon-Hulshof 64-35

McCain-Obama won 51.5-47

–Perry county, pop. 18,800

Hulshof-Nixon 52-46

McCain-Obama 64-35

Loses: Not too much–a few St. Louis county and city neighborhoods where borders were tweaked.

Keeps: The aforementioned, Ste. Genevieve, Jefferson, southeastern bits of St. Louis county, roughly half of St. Louis proper

Analysis: The bits of urban St. Louis added to this district keep it from leaning too far right, and St. Francois is actually fairly moderate–Jay Nixon outperformed his statewide average here. Conservative Perry County is too small to have much effect. Carnahan should be able to hold this district.  

————-

Red-District 4: Ike Skelton, D

Residence: Lexington (Lafayette County)

Old PVI: R+14 (Obama 38-McCain 61)

Gains: Howard, Cooper, Boone, Callaway, Osage, Maries, Phelps, Gasconade, plus the south & eastern suburbs of Jackson County (Lee’s Summit, Blue Springs, Grain Valley, Lone Jack)

Loses: Barton, Vernon, Dade, Cedar, part of Polk, Dallas, Webster, Laclede, Pulaski, Camden, Ray

Keeps: Lafayette, Johnson, Henry, Pettis, Saline, Morgan, Moniteau, Cole

Analysis: This district sees some big changes to make it the probably the most swing-tastic of the new map. While Skelton can easily hold the old MO-4, it’s unlikely another Democrat could. The new MO-4 changes that to an extent, refocusing the district on the mid-section of Missouri, linking the Kansas City suburbs to Columbia and Jefferson City. In terms of community interests, it could be the “River District”, as it roughly follows the outline of the Missouri River through the middle of Missouri. But notice what else it is–an education/govt/services district. Behold….

Boone County (155,000): O-Mc 55-43, Nix-Hul 55-43  –>Columbia (MU, 30,000 students)

Cole (70,000): O-Mc 36-63, Nix-Hul 49-50  —> Jeff City (state capitol)

Johnson (50,000): O-Mc 43-55, Nix-Hul 54-43   —> Warrensburg (UCM, formerly CMSU, 10,000 students)

Phelps (43,000): O-Mc 38-60, Nix-Hul 53-44  —> Rolla (6500 students)

Pettis (40,000): O-Mc 38-60.5, Nix-Hul 55-43   —> Sedalia, state fair/services

Callaway (40,000): O-Mc 40-59, Nix-Hul 49-50 —> Fulton? Jeff City suburbs

Saline (24,000): O-Mc 48-50, Nix-Hul 57-33  —> Marshall, Missouri Valley College, 1500-ish students

Morgan (21,000): Nix-Hul 50-48

Cooper (17,000): Nix-Hul 46-52

Gasconade (15,000)

Moniteau (15,000)

Howard (10,000)

Maries (9,000)

——-

Yellow-District 5: Emanuel Cleaver

Residence: Kansas City

Old PVI: D+10

Gains: most of Cass county, all of Bates

Loses: Modest bits of southeastern suburbs of KC, like Lee’s Summit

Keeps: Most of Jackson County (Kansas City)

Analysis: Lost suburban bits compensated by swaps from northern suburbs, and the overwhelming urban tilt cancels the Cass/Bates suburban/rural tinge–no huge changes here and geographically it’s pretty similar, with mostly changes at the margins. Remains an urban district, perhaps now a smidge more conservative for a left-ish Dem like Cleaver, the former mayor of Kansas City, but still a pretty safe Dem seat.

Population centers: urban Kansas City, which went for Obama 78-21, is the majority of this district.

Cass County: Mc-O 60-40, Nix-Hul 52-46

Bates County: Mc-O 58-40, Nix-Hul 55-42

————

District 6: Sam Graves

Residence: Tarkio

Old PVI: R+7 (Bush-Kerry 57-43)

Gains: Practically every county in northern Missouri

Loses: Some Kansas City suburbs- wealthy Blue Springs and the closer-in Clay county districts

New PVI: Much more heavily Republican, probably R+15-20

Analysis: It’s the northern Missouri exurban-rural district, stretching from the northern Kansas City suburbs all the way to the outskirts of St. Louis. It becomes a blood-red district … Sam Graves is safe here as long as he wants. It’s perhaps not quite as ironclad as numbers might suggest–Nixon won a number of these counties, especially the ones that have higher populations (Buchanan, Platte, Clay). But the northeast is especially Republican and Sam Graves or a competent Republican should have no trouble holding this heavily-stacked district.

Main population centers: St. Joseph, Kansas City suburbs (Platte/Clay), rural northern Missouri

————

District 7: Roy Blunt (until the next election)

Old PVI: R+17

Gains: Barton, Vernon, Cedar, Dade, half of Taney

Loses: Polk

New PVI: Probably about the same, still heavily Republican

Analysis: It may not technically have the highest number of Republicans in terms of percentage of registered voters, but southwest Missouri is full of religious conservatives and this district will be safely, probably wingnuttily-Republican. But then again, it pretty much was before, so no major changes here. The borders expand modestly, but the flavor remains the same.

Main population centers are Joplin, Springfield and Branson (whose county, Taney, is now entirely in the 7th).

——–

District 8: Jo Ann Emerson, R

Residence:

Old PVI: R+15

Gains: Webster, Dallas, Polk, Hickory, Laclede, Benton, Camden, Miller, Pulaski, St. Clair

Loses: (other) Half of Taney, Washington, Iron, St. Francois, Perry, Phelps

Analysis: Jo Ann should like her new district–she loses the most Democrat-friendly parts (Washington, Iron, St. Francois) and picks up a slew of more conservative counties in south-central Missouri, stretching her district into the Ozarks. Although Emerson has been drifting gently toward the center (which basically means support stem cell research and uh…) since being elected in 1998, she’s still definitely conservative enough to represent this new district–after all, a lot of her new counties would be used to voting for Democrat Ike Skelton, so a center-right, but not far-right representative should do the trick.

“Main population centers” are…Cape Girardeau? Poplar Bluff?
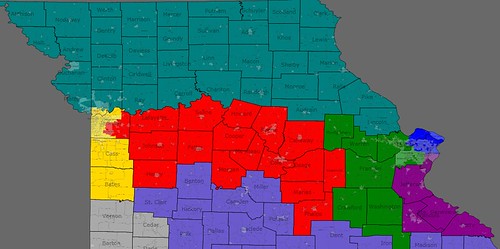
Southern MO map:

http://www.flickr.com/photos/4…

———

District 9: Blaine Lueketmeyer

Residence: St. Elizabeth, Miller County

Old PVI: R+9

Disappeared!

His district is eaten by several others, and he now lives in Jo Ann Emerson’s new 8th. He has little chance to defeat her in primary as her base makes up the vast majority of this district.

But his previous district is now split between the new ones of Skelton, Akin and Carnahan, wi

So why would Republicans sacrifice ole Blaine?

Blaine will lose because he has the least seniority, other than whoever Blunt’s replacement is. But Blunt’s district makes sense–southwest Missouri–as opposed to Blaine’s crazy-shaped current 9th (“Little Dixie” …yeah, good try).

Why else dump Blaine? Because Republicans get a lot in return. Three totally safe districts, one mostly safe one, and they have a chance on at least one, if not two, of the “Democratic” districts. Democrats will like it because it’s a better balance and they may have a chance with Akin in the future. And with Skelton unlikely to make it another decade in Congress (though I hope and pray to God he does) they’re gonna lose one forever if they don’t agree to act now. Basically, you can gerrymander Missouri a lot worse.

Overall, despite its 2008 performance, Missouri is still the ultimate swing state, and having a 4-4 delegation (with one seat that could go to Republicans) seems right.

———

Other Missouri redistricting maps:

http://www.swingstateproject.c…

http://www.swingstateproject.c…

Source:

MO Gov Race – http://www.sos.mo.gov/enrMaps/…  (MO Sec. of State’s office)

PBI (Party Brand Index) Part 4: Missouri, Arkansas & Oklahoma

Continuing on with a concept I developed called PBI or Party Brand Index (with some much appreciated help from pl515) as a replacement for PVI.  PVI (Partisan Voting Index), which is measured by averaging the percentage of the vote from the last two presidential elections in each house district, and comparing it to the nation as a whole, is a useful shorthand for understanding the liberal v. conservative dynamics of a district. But PVI in my opinion it falls short in a number of areas. First it doesn’t explain states like Arkansas or West Virginia. These states have districts who’s PVIs indicates a Democrat shouldn’t win, yet Democrats (outside of the presidency) win quite handily. Secondly why is this the case in Arkansas but not Oklahoma with similar PVI rated districts?

Lastly PVI can miss trends as it takes 4 years to readjust. The purpose of Party Brand Index is to give a better idea of how a candidate does not relative to how the presidential candidate did, but compared to how their generic PARTY should be expected to perform. Last week I tackled NC, this week I’m tackling MO, OK, AR.

This week I skipped my normal pattern of working out from purple states.  I became curious on how my model would work in a state like Arkansas that is deeply blue at the local level, but deeply red at the presidential level. Also I started to develop the first “holes” in my model with my PBI numbers for representatives like Ike Skelton (D-MO). If I want to replace PBI with PVI ignoring “obviously” flawed results doesn’t help. First I will publish my results, then my proposed corrections. As a reminder a Democratic lean to a district get a positive number, a GOP lean gets a negative number.

MISSOURI:

ARKANSAS:


OKLAHOMA:

Ike Skelton in the Missouri 4th with a PBI of – 3 compared to a PVI of – 14 just didn’t seem right. So I jumped ahead of my schedule and did the numbers for Arkansas and Oklahoma, I got a PBI number of 27 compared to – 7 for Rep. Ross D-AR, and a PBI of 3 versus a -14 PVI for Dan Boren of Oklahoma. Ross at least could be argued as possible. Sen. Pryor didn’t even have a Republican challenger, Blanche Lincoln crushed her opponent, and Democrats in Arkansas have the largest margin in state house outside of Massachusetts in the entire country. Ross’ numbers are as much a reflection of the utter incompetence of the Arkansas GOP at the local level, that bares nor resemblance to their strength at the presidential level.  But Boren in Oklahoma seems a little weird. pl515) suggested correcting for ideology. Since Rep. Boren nearly refused to endorse Obama a case could be made he is getting elected in ruby red Oklahoma (a state where Obama loss every single county) because he is barely a Democrat.

I developed a formula based on standard deviations. Basically I can figure out how much the average rep deviates from their district.  If I then compare where a reps voting pattern falls (in what percentile) and compare it to their district’s PVI, I can develop a “standard deviation factor”. Inside the standard deviation will get a bonus, outside a negative. The idea is that if a Blue Dog has a very conservative record, they may be surviving not because of a districts Democratic leanings but because they deviate from Democratic policies.

For example, if Rep X is the 42 most conservative rep, that would place her in the 90th percentile. But if her district’s PVI was “only” the in the 60th, their is a good chance her margins would be effected. Using a few random samples I found most reps lie within 12% of their district’s PVI.

Using these dummy numbers I then came up with this.  


   SQRT[(30-12)^2 /2] = about 13%

    Her factor would then be 100 – 13 = 0.87.

So her victory margin would be weighted by 0.87 because she is more than 12% beyond her acceptable percentile range it making the victories in her district approximate 13% less “representative”.

    My theory yields the following formula:

        If rep’s voting record is > PVI then

            100 – SQRT[({Record percentile – PVI} – Standard PVI Sigma)^2 /2] = factor

        else if rep’s voting record < PVI

             100 + SQRT[({Record percentile – PVI} – Standard PVI Sigma)^2 /2] = factor

I then repeated this formula to calculate a partisanship correction factor. Ranking a members ideology is a subjective decision. Potentially what’s one person “liberal” position, is another person “conservative” ones, remember the wingers developed a model that ranked the Sen. Obama as more liberal than Bernie Sanders or Russ Feingold. But partisanship, how often a member votes with their party is an absolute number. A Democrat who represents a “republican district” would be expected to “break with their party” on votes that don’t reflect their districts values.

I couldn’t find a website that ranks all the districts based on their PVI (I only could find list of them by state not rank, help please anyone), therefor I substituted a PVI ranking with where each member ranked in the Democratic caucus. In the 110th Congress the average Democrat had an ideological ranking of 170 (by the way this is a result of several members being tied, this is the medium not the midpoint). The average of members towards the center was 191, former Daily Kos celeb Ciro Rodriguez fell at exactly 191. The average of members towards the liberal side was 121, which falls between Rep. Larson of Conn. and Rep. Eshoo of CA. As or partisanship in the 110th Congress the average Democrat voted with their party 92.3% of the time.

FOUR BLUE DOGS

Better but still not perfect. PBI Adjustment number two is the model I’m currently most happy with. My model “predict” an Ike Skelton “loss” with a PBI of – 4, Rep. Boren of Oklahoma is at even money with a 0 PBI. Once I’m happy with my model I will do a back run to see how it accesses past members who loss election bids last cycle. As I said earlier, Ross’ numbers are as much a reflection of the utter incompetence of the Arkansas GOP at the local level, that bares nor resemblance to their strength at the presidential level. In other words the Democratic brand is very strong in Arkansas at the local level.

Rep. Baron Hill of Indiana numbers are an indication of the Democratic brands resurgence in the Hoosier state. Rep. Hill won his three races by an average of 11%, with his medium victory being 10%, my model predicts he represents a district where a Democrat should win by 9%.

As a clarification in Adjustment #1, I used a deviation factor based on how far each member was from the center of the Democratic caucus. Adjustment #2 was based on how far each member was from outside the standard deviation of the caucus. In Adjustment #3 I removed the partisanship factor to see what effect it would have.

Because there are “only” 50 states (as opposed to evaluating 435 house members), after Netroots Nation I will have all the states ranked by PVI so I can adjust the Senator’s rankings. I developed Senate factors for the four states the four blue dogs came from. In the interest of full disclosure, my source for ideological rankings is Voteview, and for partisanship it was the Washington Post. This is still a work in progress, I’m making adjustments, and continuing to crunch numbers for more states. I also will use the adjustment factor on a liberal member of congress to see what effect that will have. Finally all future charts will incorporate color schemes.

Congressional races 2010: MN, MS, MO, MT

Previous diares

Summary:

 MN has 8 reps: 5 D, 3 R

 MS has 4 reps: 3 D, 1 R

 MO has 9 reps: 4 D, 5 R

 MT has 1 rep, a Repub.

Possibly vulnerable:

  MN-03 (R) MN-06 (R)

  MO-09 (R) (maybe)  

Sources:

House vote in 2008 from WaPo

VoteView (ranked from 1 for most liberal to 447 for most conservative; more than 435 because some districts had more than one rep in the 110th congress)

Race Tracker

Obama vote by CD from Swing State

National Atlas for maps

and my previous diaries.

District: MN-01

Location The southern part of MN, bordering WI, IA, and SD map

Cook PVI R + 1

Representative Tim Walz (D)

VoteView 190

First elected 2006

2008 margin  63-33 over Brian Davis

2006 margin  53-37

2004 margin NA

Obama margin 51-47

Bush margin 2004 51-47

Current opponents None confirmed

Demographics 77th most rural (43.5%), 31st fewest Blacks (1.0%)

Assessment  Safe

District: MN-02

Location Southern suburbs and exurbs of twin cities  map

Cook PVI R + 4

Representative John Kline (R)

VoteView 397

First elected 2002

2008 margin  57-43 over Steve Sarvi

2006 margin  56-40

2004 margin  56-40

Obama margin 48-50

Bush margin 2004 45-54

Current opponents None declared

Demographics  36th highest income (median = $61K), 10th fewest in poverty (3.9%), 60th fewest Blacks (1.6%)

Assessment  This district is becoming more D, but maybe not quickly enough for 2010.  Plus, Kline has raised 333K already.

District: MN-03

Location Suburbs of the twin cities  map

Cook PVI Even

Representative Erik Paulsen (R)

VoteView NA

First elected 2008

2008 margin  49-41 over Ashwin Madia, remainder to David Dillon (INP), who looks pretty progressive.

2006 margin  NA

2004 margin NA

Obama margin 52-46

Bush margin 2004 51-48

Current opponents None confirmed

Demographics  6th wealthiest (median income = $64K), 5th fewest in poverty (3.5%),  80th fewest Blacks (3.8%)

Assessment  This one looks possible; I think most of the 11% that went to Dillon would go Democratic.  

District: MN-04

Location  St. Paul and suburbs map

Cook PVI D + 13

Representative Betty McCollum (D) Not confirmed

VoteView 77

First elected 2000

2008 margin  69-31 over Ed Matthews

2006 margin  70-30

2004 margin 57-33

Obama margin 64-32

Bush margin 2004 34-57

Current opponents Ed Matthews

Demographics  Not unusual on what I track

Assessment  Safe

District: MN-05

Location map

Cook PVI D + 23

Representative Keith Ellison (D)

VoteView 11

First elected 2006

2008 margin  71-22 over Barb White

2006 margin  56-21

2004 margin NA

Obama margin 74-24

Bush margin 2004 71-28

Current opponents None confirmed

Demographics  40th most Democratic

Assessment  Safe

District: MN-06

Location Mostly in central MN, but extending east and south to the WI border  map

Cook PVI R + 7

Representative Michelle Bachmann (R)

VoteView 399

First elected 2006

2008 margin  46-43 over El Tinklenberg, remainder to Bob Anderson.  It’s hard to say who Anderson hurt – he says he’s a ‘conservative alternative to Bachmann’. Bachmann did run more behind McCain (7 points) than El behind Obama (2 points).

2006 margin  50-42 over John Binkowski

2004 margin NA

Obama margin 45-53

Bush margin 2004 57-42

Current opponents El Tinklenburg and Maureen Reed (site being worked on)

Demographics  53rd highest income (median = $57K), 18th fewest in poverty (4/7%), 18th most Whites (94.9%), 28th fewest Blacks (0.9%), 42nd fewest Latinos (1.3%)

Assessment  Bachmann is vulnerable.  She’s insane.  But she’s already raised $600K.  On the other hand, Reed has raised $230K.  For a challenger, that’s impressive.  I have no figures for Tinklenburg.

District: MN-07

Location  Western MN, bordering SD and ND and Canada  map

Cook PVI R + 5

Representative Collin Peterson (D) Not confirmed

VoteView 214

First elected 1990

2008 margin  72-28 over Glenn Menzie

2006 margin  70-26

2004 margin 66-34

Obama margin 47-50

Bush margin 2004 43-55

Current opponents None confirmed

Demographics  6th most rural (66%), 22nd most Whites (93.1%), tied for fewest Blacks (0.3%)

Assessment  Safe.  OK, Peterson is a very conservative Democrat; still, he wins easily in a Republican district, without using up much money.

District: MN-08

Location map

Cook PVI D + 3

Representative James Oberstar (D)

VoteView 107

First elected 1974

2008 margin  68-32 over Michael Cummins

2006 margin  64-34

2004 margin 65-32

Obama margin 53-45

Bush margin 2004  46-53

Current opponents None confirmed

Demographics   12th most rural (62.6%), 34th most veterans (16.2%), 20th most Whites (94.6%), 11th fewest Blacks (0.5%), 11th fewest Latinos (0.8%)

Assessment  Safe

District: MS-01

Location Northeastern MS, bordering TN and AL, including Tupelo  map

Cook PVI R + 14

Representative Travis Childers (D)

VoteView 239

First elected 2007 (replaced Wicker)

2008 margin  54-44

2006 margin  NA

2004 margin NA

Obama margin 37-62

Bush margin 2004 62-37

Current opponents None confirmed

Demographics  15th most rural (61.5%), 5th fewest nonWhite, nonLatino, nonBlack (1.1%), 58th lowest income (median = $33K)

Assessment  Safe.  Childers, one of the most conervative Democrats in the House, wins here.  Easily.  

District: MS-02

Location Western MS, bordering AR and LA  map

Cook PVI D + 12

Representative Bennie Thompson (D)

VoteView 45

First elected 1993

2008 margin  69-31 over Richard Cook

2006 margin  64-36

2004 margin  58-41

Obama margin 66-33

Bush margin 2004 40-59

Current opponents None confirmed

Demographics    8th poorest (median income = $27K), 10th most in poverty (27.3%), 3rd most Blacks (63.2%, only IL01 and LA02 are higher), 33rd fewest Latinos (1.2%)

Assessment  Safe.  

District: MS-03

Location Runs SW to NE, from Natchez, in the southwest, to Starkville, in the northeast.  Borders both LA and AL map

Cook PVI R + 15

Representative Gregg Harper (R)

VoteView NA

First elected 2008

2008 margin  63-37 over Joel Gill

2006 margin  NA

2004 margin NA

Obama margin 38-61

Bush margin 2004 65-34

Current opponents Joel Gill

Demographics  18th most rural (59.7%), 51st poorest (median income = $32K), 39th most Black (33.1%), 33rd least Latino (1.2%

Assessment  Long shot.

District: MS-04

Location Southeastern MS, bordering AL, LA, and the Gulf  map

Cook PVI R + 20

Representative Gene Taylor (D)

VoteView 219

First elected 1989

2008 margin  75-25 over John McKay

2006 margin  80-20

2004 margin 64-35

Obama margin 32-67

Bush margin 2004 68-31

Current opponents None confirmed

Demographics    64th poorest (median income = $33K); 21st most Republican for POTUS.  I am not sure, but I think this is the largest difference between Obama vote (32%) and a Democrat in the House (75%).  At minimum, 43% of people voted for McCain and Taylor.

Assessment  Safe.

District: MO-01

Location St Louismap

Cook PVI D + 27

Representative William Lacy Clay

VoteView 39.5

First elected 2000

2008 margin  Unopposed

2006 margin  73-25

2004 margin 75-23

Obama margin 80-20

Bush margin 2004 75-25

Current opponents None confirmed

Demographics   24th most Black (49.7%), 27th most Democratic

Assessment  Safe

District: MO-02

Location  A ring around St. Louis, including a bit of the city map

Cook PVI R + 9

Representative Todd Akin (R)

VoteView 412

First elected 2000

2008 margin  62-35 over Bill Haas

2006 margin  61-37

2004 margin 65-35

Obama margin 44-55

Bush margin 2004 60-40

Current opponents None confirmed

Demographics  35th wealthiest (median income = $61K), 8 least in poverty (3.6%), 38th most White (93.2%)

Assessment  Long shot

District: MO-03

Location  Southern part of St. Louis, and southern suburbs  map

Cook PVI D + 7

Representative Russ Carnahan (D) Not confirmed

VoteView 153

First elected 2004

2008 margin  66-30 over Chris Sander

2006 margin  66-32

2004 margin  53-45

Obama margin 60-39

Bush margin 2004 57-43

Current opponents None confirmed

Demographics  Not unusual on what I track

Assessment  Safe

District: MO-04

Location Western MO, bordering KS, including Jefferson City  map

Cook PVI R + 14

Representative Ike Skelton (D)

VoteView 208

First elected 1976

2008 margin  66-34 over Jeff Parnell

2006 margin  68-29

2004 margin  66-32

Obama margin 38-60

Bush margin 2004 64-35

Current opponents None confirmed

Demographics   17th most rural (60.1%), 85th poorest (median income = $35K), 37th most veterans (16.1%), 62nd most Republican

Assessment  Safe

District: MO-05

Location Kansas City and suburbs  map

Cook PVI D + 10

Representative Emmanuel Cleaver (D)

VoteView 67

First elected 2004

2008 margin  64-36 over Jacob Turk

2006 margin  64-32

2004 margin  55-42

Obama margin 63-36

Bush margin 2004 40-60

Current opponents None confirmed

Demographics  Not unusual on what I track

Assessment  Safe

District: MO-06

Location  Northwestern MO, bordering IA, NE, and KS map

Cook PVI R + 7

Representative Sam Graves (R)

VoteView 382

First elected 2000

2008 margin  59-37 over Kay Barnes

2006 margin  62-36

2004 margin  64-35

Obama margin 45-54

Bush margin 2004 57-42

Current opponents None confirmed

Demographics  Not unusual on what I track

Assessment  Barnes looked like a strong candidate; that she got less than 40% is not a good sign.

District: MO-07

Location map

Cook PVI R + 17

Representative Roy Blunt (R) Retiring

VoteView NA

First elected NA

2008 margin  NA

2006 margin  NA

2004 margin  NA

Obama margin 35-63

Bush margin 2004 67-32

Current opponents There are no confirmed Democrats, but several confirmed Republicans running in this strongly R district (see the wiki

Demographics   86th most rural (40.9%), 62nd poorest (meidan income = $33K), 45th most Whites (92.9%), 42nd fewest Blacks (1.2%), 31st most Republican

Assessment  This looks like a long shot for any Democrat

District: MO-08

Location   Southeastern MO, bordering KY, TN, and AR.  map

Cook PVI R + 15

Representative JoAnn Emerson (R) Not confirmed

VoteView 265

First elected 1996

2008 margin  71-26 over Joe Allen

2006 margin  72-26

2004 margin  72-27

Obama margin 36-62

Bush margin 2004 36-64

Current opponents None confirmed

Demographics   16th most rural (60.4%), 12th poorest (meidan income = $28K), 30th most Whites (92.5%), 22nd fewest Latinos (1.0%), 51st most Republican

Assessment  Long shot

District: MO-09

Location Northeastern MO, bordering IA and IL, including part of Jefferson City map

Cook PVI R + 9

Representative Blaine Lutekemeyer (R)

VoteView NA

First elected 2008

2008 margin  50-47 over Judy Baker

2006 margin  NA

2004 margin  NA

Obama margin 44-55

Bush margin 2004 41-59

Current opponents None confirmed

Demographics    31st most rural (54.2%)

Assessment  Not impossible, but if we couldn’t win it as an open seat, it’s going to be tough to win against an incumbent

District: MT-AL

Location Whole state map

Cook PVI R + 7

Representative Denny Rehberg (R) Not confirmed

VoteView 304

First elected 2000

2008 margin  64-32 over John Driscoll

2006 margin  61-36

2004 margin  65-34

Obama margin 47-50

Bush margin 2004 39-59

Current opponents Dennis McDonald and Tyler Gernant

Demographics    68th most rural (46.0%), 65th lowest income (median = $33K), 37th most White (89.5%), 3rd fewest Blacks (0.3%)

Assessment  Rehberg is popular, but Obama got 47% here.  

Congressional races round 2: Mississippi, Missouri, Montana

Continuing through the alphabet….

Mississippi has 4 representatives: 2 Democrats and 2 Republicans

The filing deadline was Jan 11, and the primary was on March 11

Missouri has 9 representatives: 5 Republicans and 4 Democrats

Filing deadline is March 25, primary is Aug 5

Montana has one representative, a Republican

Filing deadline is March 20, primary is June 3

District: MS-01

Location Northeastern MS, bordering TN and AL, including Tupelo

Representative None (Wicker became Senator), election on April 22

First elected  

2006 margin

2004 margin

Bush margin 2004 62-37

Notes on opponents NA

Current opponents Democrats: Travis Childers

Demographics 15th most rural (61.5%), 5th fewest nonWhite, nonLatino, nonBlack (1.1%), 58th lowest income (median = $33K)

Assessment Long shot

District: MS-02

Location Western MS, bordering AR and LA

Representative Bennie Thompson (D)

First elected  1993

2006 margin 64-36

2004 margin 58-41

Bush margin 2004 40-59

Notes on opponents In 2006, Yvonne Brown raised $100K to Thompson’s $1.4 million; in 2004, Clinton LeSeuer raised $300K to Thompson’s $700K

Current opponents Richard Cook (Thompson is also being primaried)

Demographics 8th poorest (median income = $27K), 10th most in poverty (27.3%), 3rd most Blacks (63.2$, only IL01 and LA02 are higher), 33rd fewest Latinos (1.2%)

Assessment Safe

District: MS-03

Location Runs SW to NE, from Natchez, in the southwest, ot Starkville, in the northeast.  Borders both LA and AL

Representative Chip Pickering (R)

First elected  1996

2006 margin 78% against minor parties

2004 margin 80% against minor parties

Bush margin 2004 65-34

Notes on opponents NA

Current opponents Randy Eads

Demographics  18th most rural (59.7%), 51st poorest (median income = $32K), 39th most Black (33.1%), 33rd least Latino (1.2%), 51st most Republican

Assessment long shot

District: MS-04

Location Southeastern MS, bordering AL, LA, and the Gulf

Representative Gene Taylor (D)

First elected  1989

2006 margin 80-20

2004 margin 64-35

Bush margin 2004 68-31

Notes on opponents In 2004, Michael Lott raised $90K to Taylor’s $400K

Current opponents John McCay

Demographics 64th poorest (median income = $33K), 34th most Republican per Cook PVI

Assessment Safe.  OK, Taylor is a very conservative Democrat.  But he wins easily in a district that Bush took by more than 30 points in 04 and 08

District: MO-01

Location St. Louis

Representative William Lacy Clay (D)

First elected  2000

2006 margin 73-25

2004 margin 75-23

Bush margin 2004 25-75

Notes on opponents Neither raised money

Current opponents None declared

Demographics 24th most Black (49.7%), 31st most Democratic

Assessment safe

District: MO-02

Location A ring around St. Louis, including a bit of the city

Representative Todd Akin (R)

First elected  2000

2006 margin 61-37

2004 margin 65-35

Bush margin 2004 60-40

Notes on opponents Neither raised money

Current opponents Mike Garman

Demographics 35th wealthiest (median income = $61K), 8 least in poverty (3.6%), 38th most White (93.2%)

Assessment Long shot

District: MO-03

Location Southern part of St. Louis, and southern suburbs

Representative Russ Carnahan (D)

First elected  2004

2006 margin 66-32

2004 margin 53-45

Bush margin 2004 57-43

Notes on opponents  In 2004, this was an open seat (formerly occupied by Gephardt), and Carnahan beat Bill Federer with each spending about $1.3 million.  In 2006, his opponent raised little

Current opponents David Bertelson, Chris Sander

Demographics Not unusual on what I track

Assessment  Safe

District: MO-04

Location Western MO, bordering KS, including Jefferson City

Representative Ike Skelton

First elected   1976

2006 margin 68-29

2004 margin 66-32

Bush margin 2004 64-35

Notes on opponents Neither raised money

Current opponents  None declared

Demographics 17th most rural (60.1%), 85th poorest (median income = $35K), 37th most veterans (16.1%), 87th most Republican

Assessment safe

District: MO-05

Location Kansas City and suburbs

Representative  Emanuel Cleaver (D)

First elected  2004

2006 margin 64-32

2004 margin 55-42

Bush margin 2004 40-59

Notes on opponents In 2004, this was an open seat, and Cleaver was out-spent $3.2 million to $1.5 million by Joanne Patterson.  In 2006, his opponent raised little money

Current opponents Jacob Turk

Demographics Not unusual on what I track

Assessment Safe

District: MO-06

Location Northwestern MO, bordering IA, NE, and KS

Representative Sam Graves (R)

First elected  2000

2006 margin 62-36

2004 margin 64-35

Bush margin 2004 57-42

Notes on opponents In 2004, Charlie Broomfield spent $900K to Graves’ $1.7 million.  In 2006, Sara Jo Shettles spent $130K to Graves’ $1.2 million

Current opponents Kay Barnes

Demographics Not unusual on what I track

Assessment Somewhat vulnerable.  Barnes is Mayor of Kansas City, and has raised $656K already.   superribbie ranks this the 42nd most vul. Republican seat

District: MO-07

Location Southwestern MO, bordering KS, OK, and AR, including Joplin

Representative Roy Blunt (R)

First elected  1996

2006 margin 67-30

2004 margin 70-28

Bush margin 2004 67-32

Notes on opponents In 2004, Jim Newberry raised $200K to Blount’s $3.5 million.  In 2006, his opponent raised little

Current opponents None declared

Demographics 86th most rural (40.9%), 62nd poorest (meidan income = $33K), 45th most Whites (92.9%), 42nd fewest Blacks (1.2%)

Assessment long shot

District: MO-08

Location Southeastern MO, bordering KY, TN, and AR.

Representative Jo Ann Emerson (R)

First elected 1996

2006 margin 72-26

2004 margin 72-27

Bush margin 2004 63-36

Notes on opponents Neither raised money

Current opponents Joe Allen (no apparent site)

Demographics 16th most rural (60.4%), 12th poorest (meidan income = $28K), 30th most Whites (92.5%), 22nd fewest Latinos (1.0%), 87th most Republican

Assessment long shot

District: MO-09

Location Northeastern MO, bordering IA and IL, including part of Jefferson City

Representative Kenny Hulshof (R) retiring

First elected  1996

2006 margin 61-36

2004 margin 65-34

Bush margin 2004 59-41

Notes on opponents In 2006, Duane Burghard raised $250K to Hulshof’s $1.3 million; in 2004, Linda Jacobsen raised $130K to his $1 million

Current opponents Democrats:

Steve Gaw ,

Duane Burghard ,

and

Judy Baker

Demographics 31st most rural (54.2%),

Assessment Somewhat vulnerable; superribbie (link above) ranks this the 25th most vulnerable Republican seat; the Republican contender appears to have raised no money.  

District: MT-AL

Location Entire state

Representative Denny Rehberg (R)*possibly retiring to run for Senate*

First elected  2000

2006 margin 59-39

2004 margin 64-33

Bush margin 2004 59-39

Notes on opponents In 2006, Monica Lindeen raised $500K to Rehberg’s $1.1 million; in 2004, Tracy Velazquez raised $120K to Rehberg’s $600 K

Current opponents Jim Hunt

Demographics 68th most rural (46.0%), 65th lowest income (median = $33K), 37th most White (89.5%), 3rd fewest Blacks (0.3%)

Assessment If Rehberg runs for Senate, who knows?