Dear all,
This is the first time I've tried using Dave's App and making a redistricting map. I'm hoping you could tell me what things I've done wrong. (For one, I've kept the population of each district very close to the target population, 3,000 off at most, because I didn't know just how close you have to keep it. Could I have been more flexible?)
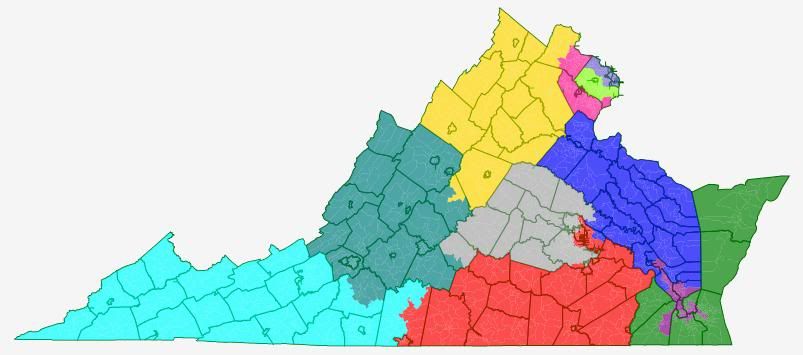
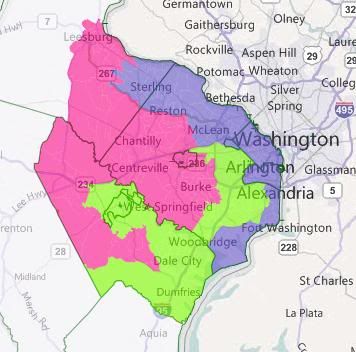
This is the map, but please do read on:

First off, I had an idea with this map. Most of the redistricting maps here are drawn, with great expertise, to either create the most realistically (or unrealistically) Democratic-friendly map; or, in a know-your-enemy / worst-case-scenario kind of way, the most GOP-friendly map; or the map that best fits the current political realities of the state, trying to guess what the real map will end up being.
Since I have nowhere near enough expertise to weigh in, I've just been observing, with some awe. But, as a foreigner, I still have trouble getting over my initial incredulity at the whole American practice of gerrymandering in the first place. The kind of gerrymandering that yields these sometimes mindbogglingly contorted looking districts, tracing unlikely looking paths from, say, the suburbs of one city to those of another halfway across the state, often seemingly without regard to keeping communities together. It's one of the oddest and unhealthy looking aspects of the US political system, for an outsider.
I'm from a country where we don't have any districts at all (it's all PR), and both in my adopted home country and the big European countries I know best (Germany, the UK), nothing like this kind of gerrymandering seems to exist. And often when I see the draft maps here, I can't help fantasizing about what a redistricting map purely based on good governance would look like. (I'm really curious what the new CA and FL maps will look like!)
Continued beneath the fold …
That said, among the many things I have learned about on SSP is the VRA, and I approve. I don't like the 60+% black/hispanic vote sinks that segregate the minority altogether and allow the VRA district incumbent practically guaranteed re-election. But I have totally embraced the need for districts in which minority group candidates are favoured, so minority groups are represented more proportionally in Congress. It's history's bill: it would be great if a black candidate stood as good a chance to be elected anywhere, but the reality is that in too many parts of the country, black/hispanic candidates will only be elected in black/hispanic-majority districts.
I wanted to draw my ideal "good governance" map for a state, the way it would look if there were no bothersome laws, legislative majorities or incumbencies to take account of.
I drew up these criteria:
- The number of districts that lean one way or another politically should be roughly proportionate to the parties' general share of the vote. (E.g.: don't stack all the voters of one party into two districts so the other party can easily win in five, when the two parties get about equal amounts of votes altogether).
- There should be a number of districts where a minority group candidate would be favoured roughly proportional to the group's share of the overall voting age population. However, districts in which a minority group makes up a small majority (<55%) or a mere plurality, and "coalition" districts in which minorities together outnumber whites should be preferred over segregating individual minorities in 60%+ vote sink districts.
- There should be as many competitive districts as possible, both to avoid safe incumbents coasting to victory without having to worry about accountability; and to keep the number of those whose vote doesn't "count" because their party is irrevocably in opposition to a minimum.
- Districts should be compact and keep communities of interest together.
- While uniting communities of interest is good, it is not beneficial for public policy if the residents of cities and surrounding suburbs are pitted against each other. (A story that struck me was the fight, at a state level I imagine, over public transport in Atlanta, in which the residents of the suburbs managed to block the extension of the city's public transport system because they feared that it would just bring more blacks into their neighbourhoods.) The map should draw cities and surrounding suburbs into common districts where possible.
As you will recognize, but I didn't quite realize beforehand, some of these points make some of the others impossible. Applying point 2 in particular throws a spanner in the works when it comes to points 4 and 5. Creating that many minority-majority districts means contorted shapes, and splitting off black or hispanic city neighbourhoods. Since minority voters tend to vote Democratic, creating more minority districts also means creating more safe Democratic districts, so it's a problem with point 3 too.
Virginia turns out to neatly illustrate all this. My other problem is that I know little about Virginia, so it's hard for me to guess where communities of interest lie exactly in any case. (Any feedback much appreciated.)

(All these data from within Dave's app. I noticed that if you download the data on race by congressional district (18+ population, hispanic and non-hispanic by race) from the census site, there's slight variations, though never more than 1% up or down.
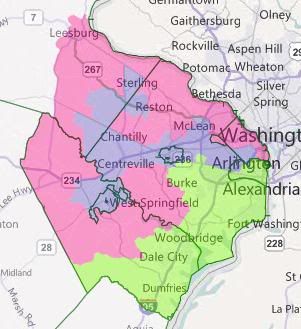
Here's maps with some more detail:


How does this stack up with my criteria?
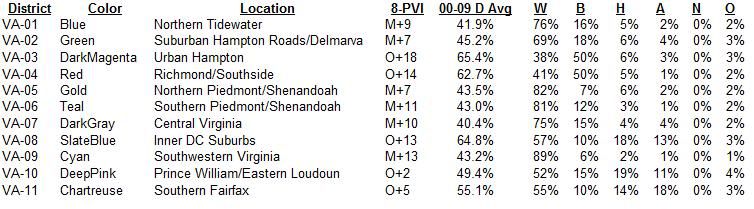
- Fulfilled: My redistricting map creates six Republican districts, four Democratic districts, and one Democratic-leaning district.
- Fulfilled: The map creates two districts in which a minority group has a plurality (blacks in VA-3 and VA-4) and a third district in which the minority groups together outnumber non-hispanic whites (VA-11). (I tried to group together disproportionally hispanic towns and neighbourhoods in VA-11, so there’s at least one district where they make up as much as 23% of the VAP – as close to having a district of their own as possible.) That's three minority-favoured districts compared to one now. Pitfall: while non-hispanic whites make up no more than 45% of each of these districts' VAP, they are 43%-45% in each, meaning that disparate turnout rates could also end you up with no minority Congressmen at all. Unlikely in an Obama year, but a concern otherwise.
- Failed: My redistricting map actually makes most districts less competitive. This is due to applying point 2. In order to create two more minority-favoured districts, I had to take black votes out of largely white districts, shoring up Republican majorities there. I also took some from the existing minority-majority VA-03, a Democratic vote sink – but that means that instead of having one D+38 district in the south, I ended up with two, still safe D+17-23 districts. Same in the north – by taking black and hispanic precincts from VA-8, I reduced that Democratic vote sink from D+32 to a still safe D+19, while creating an additional safe Democratic seat in VA-11 (D+18). All in all, I went from four arguably toss-up seats (VA-2, VA-4, VA-5 and VA-10) to one (VA-10).
- Partial: In the Northeast and the Southeast, districts are pretty contorted looking because of heeding point 2 (though I did manage to cut VA-03 short of stretching all the way up into Richmond neighbourhoods). Elsewhere, some districts are reasonable compact (VA-05 and VA-09, as well as VA-10 up north), but VA-1 stretches a long way across the state… How could this be done better, and do these districts unwittingly split any communities of interest?
- Partial: Creating three minority-favoured districts meant splitting a number of cities, in particular Richmond, but also Norfolk, Hopewell, Danville and Franklin – plus the agglomeration in NoVa.
Here's maps of each individual district:
VA-01

VA-02

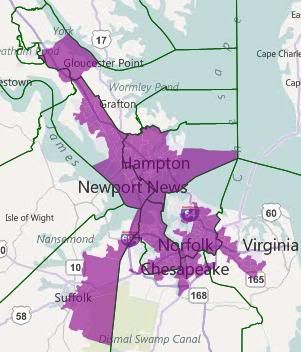
VA-03

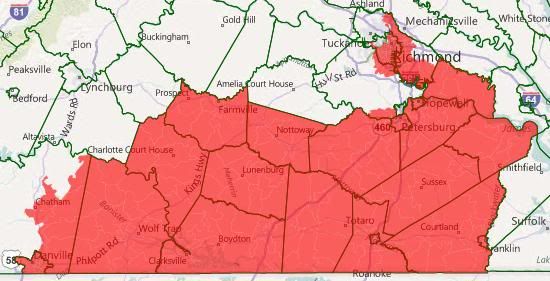
VA-04 (or as I like to call it, the dragonboat

VA-05

VA-06

VA-07 (the crab, or is it a lobster?)

VA-08

VA-09

VA-10

VA-11