Geenius at Wrok Attempts to Redistrict Illinois

So, on the one hand, I love fairness and justice and support the Voting Rights Act.

On the other hand, I hate stupid gerrymandering and the jiggering of districts to try to make them “safe.” For either party. (I mean, really, it’s fun to pretend to be Tom DeLay for a while . . . but only on Halloween.)

So I decided to use Dave’s Redistricting App to try my hand at redistricting Illinois. Fo’ realz. As in, I wanted to create a map that (a) could actually be adopted, (b) wouldn’t make an outsider gape in horror and (c) within those parameters, does all the things a good liberal would like it to do. Unlike other posters here, I’m not trying to optimize for Democratic interests — I’m trying to optimize for the interests of everyone in the state. A state that happens to contain a lot of Democrats.

One problem, though, is that I don’t know where to find the district-by-district voting data that would tell me which of my districts are solid Democratic, solid Republican or leaners. I can make educated guesses, but I don’t know for sure. This is one of the things I’m hoping you folks will help me with.

Photobucket

Methodology and more maps below the jump.

I began my mapmaking process without reference to existing districts. Outside Chicagoland, I formed districts around Census-recognized metropolitan and micropolitan statistical areas. For instance, in my map, IL-15 began as the Peoria MSA. As I saw where districts were forming, and knowing how many districts I ultimately had to create, I made the Springfield MSA part of IL-15 as well, then joined them by adding the counties in between. To my mind, metropolitan areas are “communities of interest,” and stunts like splitting Bloomington in half to dilute its vote burn my ass. (That being said, a large enough city may certainly contain more than one community of interest, but I’ll come to that later.)

Within Chicagoland, I started off with locally recognized super-communities: North Side, Northwest Side, West Side, etc. Because of the need to create majority-minority districts, I drew district lines along sharp ethnic boundaries (which in any case are inseparable from people’s notions of what neighborhoods belong to which “side”). None of these districts was large enough to be contained within the city, so I extended them outward into Cook County in ways that (I hoped) wouldn’t dilute their composition too much. Particularly in western Cook County, this took some jiggering.

As much as possible, I strove to keep these areas intact and my district boundaries in close conformity to county boundaries. Where I couldn’t go by counties, I tried to go by townships. I violated the convexity principle only where necessary to achieve population balance in a district, and I avoided “stringy” districts entirely. I can’t stand those things.

All districts deviate less than 1 percent from equal population share (712,813).

Enough talk. Maps!

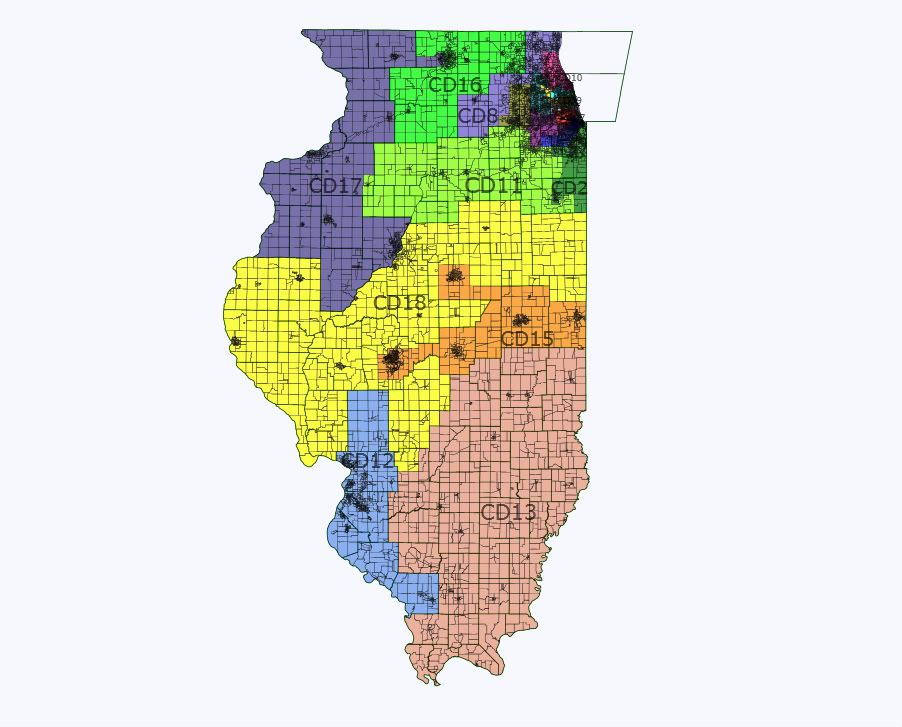
Photobucket

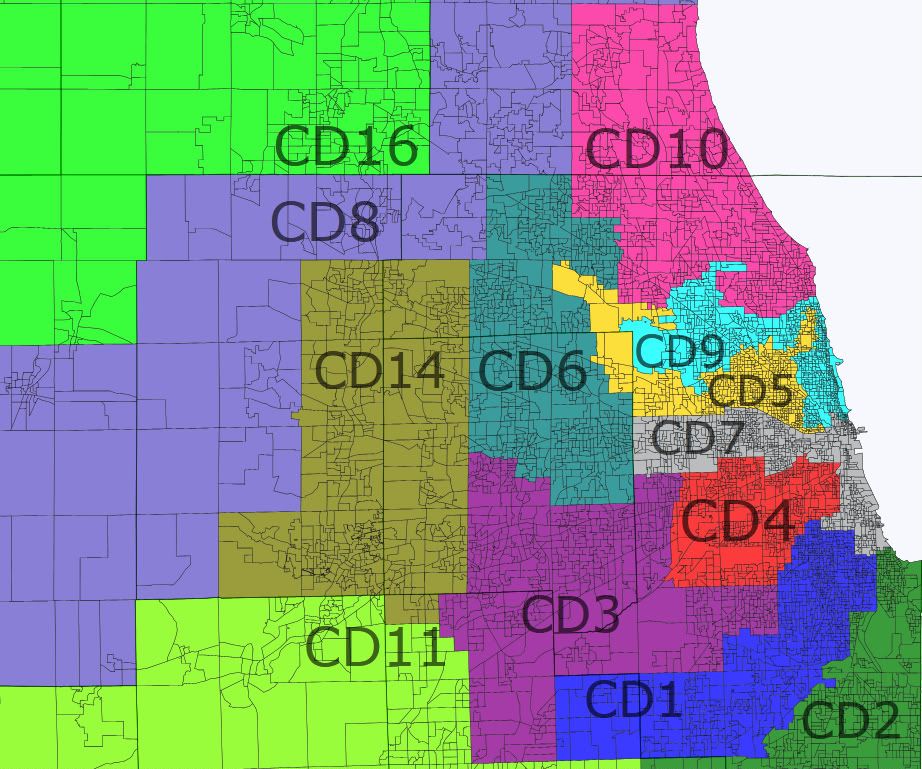
Closeup on Chicagoland.

Photobucket

Central and southern Chicago.

IL-01 (South Side Chicago, Evergreen Park, Oak Lawn): 712,314, 62% black, 25% white, 10.3% Latino

IL-02 (Southwest Side Chicago, Burbank, Lemont): 712,295, 56.9% Latino, 31.4% white, 6% black

IL-03 (South Loop, West Side Chicago, Oak Park, La Grange, Burr Ridge, Argonne): 715,690, 41% white, 38.2% black, 14.1% Latino, 5.3% Asian

IL-01 was the easiest to draw. IL-02 was easy to draw in the city and inner suburbs, but became tricker the further out I had to go. Its shape comes in part from southward pressure from IL-03, which was a lot more difficult. The West Side has really emptied out in the last decade, and it was a challenge to include enough African American residents, even reaching out into the majority-black suburbs. I tried to make sure the district comprised the more progressive western suburbs.

Photobucket

Northern Chicago.

IL-04 (Northwest Side Chicago, Bensenville, Addison): 714,664, 49.6% white, 40.8% Latino, 5.4% Asian

IL-05 (North Side Chicago, North Shore): 715,394, 67.7% white, 10.8% Latino, 10.1% Asian, 9.3% black

I wish I could have stretched IL-04 all the way out to Elgin, but it wasn’t to be; any direction I try to expand it in just dilutes the Latino vote further. This seems to be as good as it gets. To compensate, it includes the Albany Park neighborhood, which is home to a large population of immigrants of various ethnicities, who presumably will share certain interests with the Latino community. IL-05 originally included Skokie and Lincolnwood, but then I decided to give those to IL-07 (to give the northwest suburban district more Democrats) and drown wealthy Wilmette, Kenilworth and Winnetka in a sea of lakefront liberals. Ha! (And you can’t say it’s not a community of interest, because if there’s one thing true North Shore residents agree on, it’s that if it’s inland, it’s not the North Shore! If cliquish identity protection doesn’t indicate a community of interest, what does?)

Photobucket

Northern Chicagoland.

IL-07 (Skokie, Northwest Cook): 716,103, 74.2% white, 13.2% Asian, 9.5% Latino

IL-08 (Lake): 710,303, 69.3% white, 16.8% Latino, 6.3% black, 6.2% Asian

IL-09 (McHenry, Elgin, Schaumburg): 710,672, 71.4% white, 16.8% Latino, 7.9% Asian

The northwest suburbs are clearly a community of interest and belong together, though I tried to give the sprawliest parts of Outer Sprawlville to IL-09. Lake County was so close to the necessary population size all by itself that it made sense to make it a single district, with just enough of McHenry County to finish the job.

Photobucket

DuPage County.

IL-10 (DuPage, Geneva-St. Charles): 713,223, 76.3% white, 9.9% Latino, 9.1% Asian

This district’s backbone is the Metra Union Pacific West Line (there’s a bright-line distinction in my mind between streetcar suburbia and sprawl suburbia). Naperville had to be cut out because otherwise the population would just be too darn big, and because I think Napervillians need to be cognizant of the fact that there wouldn’t be a Naperville without Aurora.

Photobucket

Western and Southern Chicagoland.

IL-06 (South Cook, University Park): 712,794, 52.2% black, 36.5% white, 8.9% Latino

IL-11 (Kane, Naperville, Bolingbrook, Oswego): 713,266, 66.5% white, 18% Latino, 7.3% Asian, 7.2% black

IL-12 (Will, Kankakee): 715,230, 77.6% white, 11.3% Latino, 8.2% black

Unfortunately, Orland Hills and Tinley Park are just too populous and too white to include them in IL-06, which is why I violate county borders here to exclude them and include University Park. IL-11 and IL-12 practically drew themselves once the other Chicagoland districts were in place — except for Grundy County, where IL-12 meets IL-14 and even stepping down to township boundaries made it hard to find the right balance. My apologies to Morris. Aurora and Naperville will have to find some way to live together in peace and harmony.

Photobucket

Northwest Illinois.

IL-13 (Rockford, DeKalb, Northwest Illinois): 710,857, 82.7% white, 8.3% Latino, 6.4% black

This is the district I reside in at the moment, and it gives me pleasure to take the McHenry County exurbs away from Don Manzullo. Tool.

Photobucket

Central Illinois.

IL-14 (Quad Cities, Ottawa/La Salle, Western Illinois): 713,441, 89.5% white

IL-15 (Peoria, Springfield, Central Illinois): 707,857, 87.9% white, 7.6% black

IL-16 (Champaign, Bloomington, Decatur, Eastern Illinois): 708,620, 82.8% white, 8.4% black

Eggheads unite! No more shall Champaign and Bloomington be kept apart! (And no more shall one side of Bloomington be kept apart from the other!) Peoria and Springfield grew together organically, and IL-14, which seemed to be too underpopulated no matter what I tried, just sort of seeped into what was left between the other districts I drew, which is how it ended up including so much of the I-80 corridor.

Photobucket

Southern Illinois.

IL-17 (St. Louis MSA): 711,447, 82.1% white, 13.6% black

IL-18 (Southern Illinois): 716,642, 91.6% white, 5% black

I do have some concern about whether East St. Louis will be outshouted by exurban Tea Partiers, but without any voting data to go by, I have no basis for splitting up the Illinois portion of the St. Louis MSA. The highest-numbered district, in my scheme as in the current one, gets everything that’s left.

OK, so . . . does my districting scheme fail to maximize Democratic votes? Absolutely, yes, if maximizing Democratic votes means doing what silver spring did. But I’m not looking to maximize Democratic votes per se, but rather to let that voice come out where it’s naturally strong. If I have any concern on this score, it’s whether the lines I’ve drawn have accidentally amplified the Republican voice. That I wouldn’t want to do. My goal is a map that’s fair to everyone, yet reflects the reality of a majority-Democratic state.

So here’s what I’m asking for:

– Analysis of the likely partisan leanings of each of my districts, since I don’t have the voter data and don’t know where to get it, but obviously many of you do. (Envy! Envy!)

– Observations of where I’ve accidentally undermined my own goals (for instance, if I’ve actually violated the VRA somewhere).

– Suggestions of how I might improve my map without turning it ugly (and I think you know what I mean by “ugly”). My ultimate goal is a map that can be submitted to the state redistricting committee as the serious product of a concerned and involved citizen. Which I’m pretty sure will fall on deaf ears, but I still intend to try.

– Whether there’s any sufficiently large (let’s say, > 70,000 residents) community of interest somewhere that’s so much at odds with the rest of its surroundings that it needs to be part of a different district, and whether there’s any appropriate district near enough to which it could feasibly be joined.

Other evidence that Illinois is very swingy: caution needed before we overreach with a 14-4 map

I am as partisan a Democrat as most people on this website.  As an Illinoisan, I am dismayed that my state elected five freshmen Republicans last fall but very grateful (for a whole lot of other reasons besides redistricting) that Governor Quinn just managed to hold on.  Otherwise we would be looking at another “incumbent protection” map, which in a state that just elected five freshmen GOP congressmen last fall, would be tantamount to a GOP gerrymander.

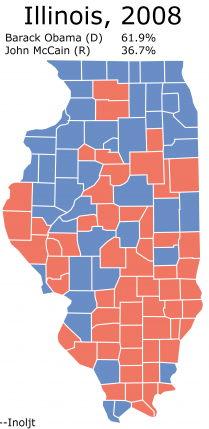
Various would-be mappers such as Silverspring have proposed 14-4 maps that would make Delay and Phil Burton proud.  But many of these maps go by Obama 2008 data, which is a fundamentally flawed data set to be basing districts on in my very educated opinion.  On the surface maps provided by such places as usaelection.org, you can see counties like Kendall and Grundy and Stephenson and McHenry (just to name a few) that wound up in Obama’s column in 2008.  No seasoned Democratic politician in Illinois would ever call these counties that are Democratic by any means.  Perhaps as suburban/exurban areas of McHenry and Kendall start to fill up and become more swingy, those counties might change.

This diary, however, focuses on a slightly different problem with the Obama 2008 data when compared against Kerry 2004 downstate (where it models pretty accurately – I understand the concerns people have about Cook and Dupage which may be a bit bluer now in 2011 but that trend is not noticeable anywhere outside of Chicagoland).  The problem is this: several of the downstate cities that mappers such as myself and Silver Spring and others count on to create as many Democratic-leaning districts as we can, aren’t really all that blue to begin with.  In other cases, such as Decatur and Urbana-Champaign, they are quite blue, but turnout is a problem.  Follow me across the jump where I demonstrate this using a new district I have been creating in most of my maps – a new 13th which disappears in Chicagoland and reappears as a vacant downstate cities seat.

Photobucket

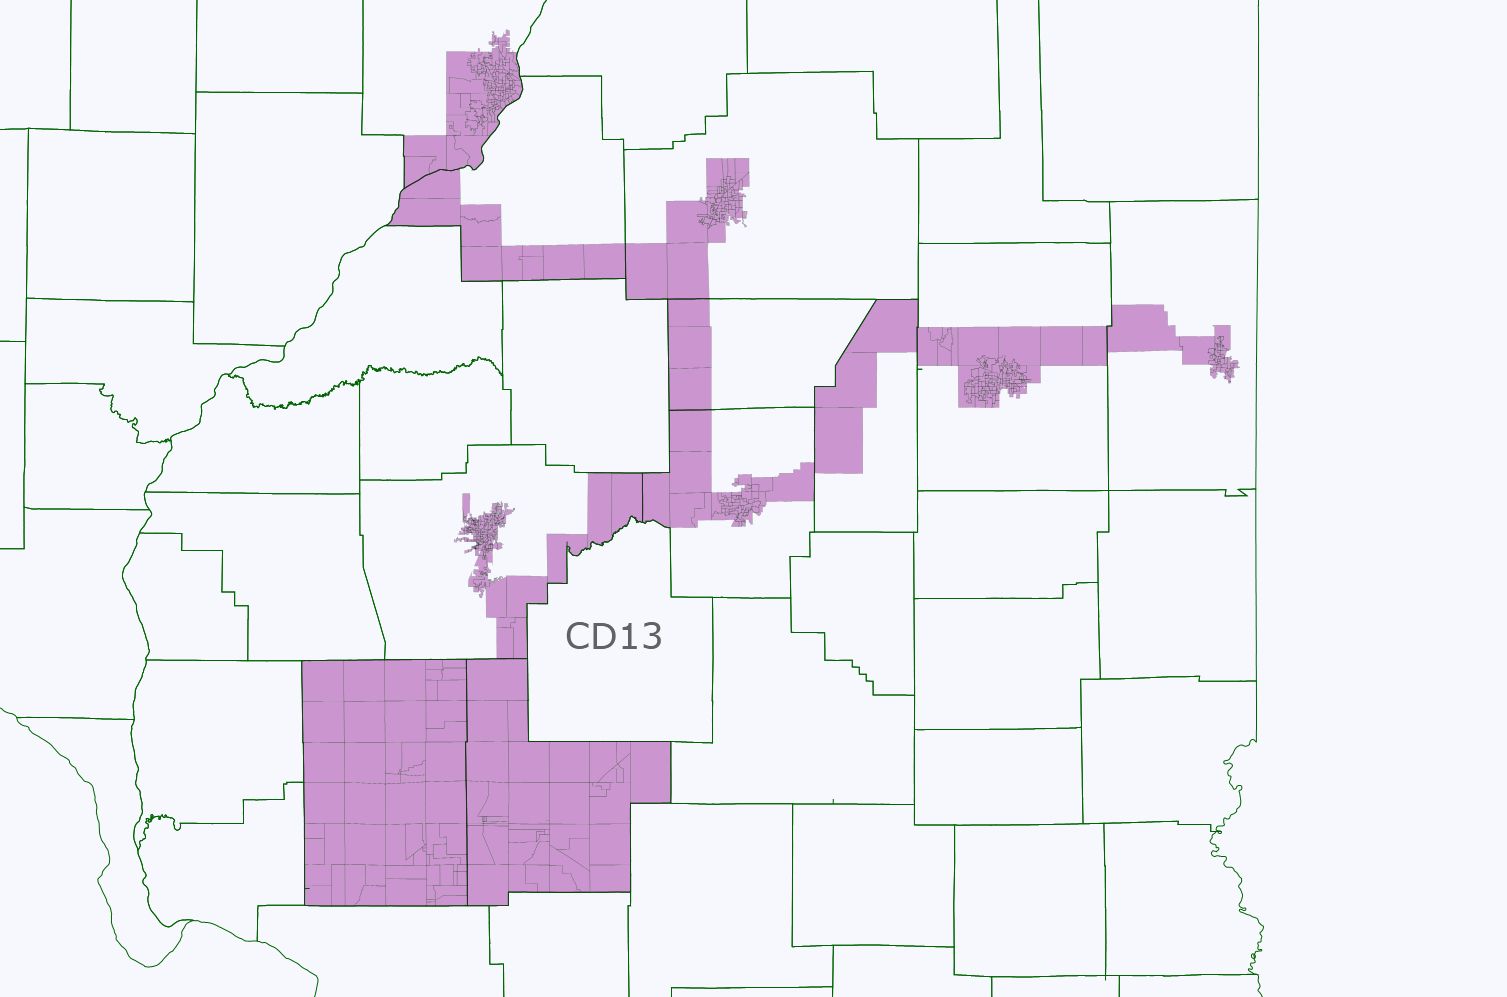
On first glance this district ought to be safely Democratic, even in 2004.  It isn’t entirely so.  Believe it or not, but Bush got 49% of the vote in this district (and the narrow tendrils connecting the various cities together only amount to about 30k residents so that isn’t the problem so much).  The district is good enough for my standards, though, because Obama did get 59%.  By Cook PVI it is a D+4, perhaps not completely safe from a meltdown of 2010 proportions but most Republicans cannot win in districts any more Democratic than this, and other than Tim Johnson, there is no sitting Republican congressman from this area of the state who could have cross-over appeal.  Even then, Tim Johnson is not a Mark Kirk, and it would take a Mark Kirk for the GOP to win this seat.  So I think it is reasonably safe Team Blue, probably as safe as can be drawn in fact.

In most other parts of the country, a 51% Kerry, 59% Obama seat would be considered safely Democratic.  But again, pay attention to that swing.  At 8% it is a bit larger than nationwide if not as extreme as the 10-12% swings found everywhere in Chicagoland.  When one looks at the cities, you see what I am discussing (with the order of the numbers being Dem-Rep):

Peoria: 28,542-18,536 in 2008; 24,795-22,398 in 2004

Danville: about 8,000 – about 4,500 in 2008; about 7,500-about 5,000 in 2004 (Does anybody know where I can find Danville or Vermillion precinct numbers; their elections website is among the most unhelpful I have ever experienced?)  I calculated this by assuming, for the sake of argument, that the out-city areas of Vermillion were equally as red as the out-city areas of Champaign County next door but I could be slightly off in either direction.

Champaign-Urbana: 32,618-13,408 in 2008; 28,814-17,222 in 2004

Bloomington: 17,578-15,167 in 2008; 13,628-17,154 in 2004

Normal: 12,257-9,197 in 2008; 9,555-10,570 in 2004

Springfield: 32,463-24,019 in 2008; 24,650-28,971 in 2004

I am progressing slower than normal with my maps because it has occurred to me that there are really three scenarios that have to be taken into consideration.  Scenario A: a tactically conservative but aggressive in every other sense map that would lock down 13 Kerry districts (Rockford going together with Rock Island; the 14th going into downtown Joliet, etc.).  Scenario B: a more risky 12-4-2 map that would put Joliet in a swing seat as well as Melissa Bean in another one in the north part of Chicagoland.  Scenario C finally would aim for a 12-5-1 which would shore up Melissa Bean while pushing a Kane seat into Rockford, which would then make the downstate cities seat very swingish (voted for Bush 53-47 then flipped to Obama 55-45).

Personally I would opt for Scenario A if I were drawing the map and not try to do a 14-4.  Unfortunately with Citizens United, the money game is even more unstacked in our disfavor.  Our ticket should get a bump with Obama on the top of the ticket, but then what about the remaining four elections in the decade-long period that any map would be operative?  Finally, another reason to be aggressive when possible but tactically conservative, drawing maps more according to Kerry or 2010 congressional data rather than Obama: Illinois is notorious for split-ticket voters.  In the weeds work I have been doing up in Chicago suburbia, I cannot tell you how often a precinct that voted 60-40 for Obama voted also in the same election for Biggert or Roskam.  And that was in 2008!  Chicago suburbia is full of independents and moderates.  

That being said, it is possible to draw 13 Kerry seats to only 5 Bush seats, and if 13-5 were achieved in 2012, that would still mean -6 GOP, +5 Dem.  That is nothing to snuff at.

14-4 Illinois Map: Second Attempt

The partisan data is still not in the Application.  Nevertheless, I wanted to post this DRAFT map now that the Census numbers are out.

I feel that my first attempt 15-3 map was perhaps too ambitious, but I feel confident that 14-4 is VERY doable in Illinois — ofcourse, the lines will have to be ugly like this “Texas-style” map.

I had several goals:

1.) Keep all 3 black seats intact; not easy considering hundreds of thousands of blacks have left Chicago over the last decade.

2.) Create two Hispanic seats — ones that would be guaranteed to elect Hispanic representatives.

3.) Keep all currently Democratic-held seats at very high Democratic levels (this includes the minority-majority seats, ofcourse, as well as IL-3, IL-5, IL-9, and IL-12).

4.) Create seats where the incumbent Democrat would keep as much of his or her current constituents as possible.

5.) Create a map whereby there are only 4 Republican seats, the newly created Democratic seats must be at relatively high Democratic levels – ideally around 65% Obama or higher in the Chicago area and around 60% Obama or higher in downstate and/or 5 points more Democratic than the existing seat.

6.) As a finishing touch, create a map whereby Aaron Schock and Adam Kinzinger will basically not have a seat to run in.

Here’s the map:

Photobucket

Photobucket

Photobucket

Goal 1:  Preserving African-American seats – under this map, virtually all black-majority precincts in the Chicago area become parts of the 3 black-majority districts.  The reason the black percentage goes down in all 3 seats is because hundreds of thousands of blacks have left the area over the last decade.

New IL-1 is 51.3 black, 38.7 white (18+ pop. is 51.5 black, 40.1 white) – Rush gets to keep 53% of his current constituents, including 75% of his current black constituents.

New IL-2 is 51.8 black, 37.2 white (18+ pop. is 50.1 black, 40.5 white) – Jackson gets to keep 80% of his current constituents, including 83% of his current black constituents.

New IL-7 is 51.8 black, 34.8 white (18+ pop. is 50.1 black, 37.5 white) – Davis gets to keep 59% of his current constituents, including 90% of his current black constituents.

Goal 2:  Two Effective Hispanic seats

New IL-4 is 56.0 hispanic, 33.2 white (18+ pop. is 50.4 hispanic, 38.9 white) – these percentages are enough to elect a Hispanic Representative as IL-4 encompasses the mostly Puerto Rican-descent areas on the north side of Chicago where the Hispanics are all citizens.  It makes sense to me that Gutierrez would run here.

New IL-6 is 64.1 hispanic, 25.1 white (18+ pop. is 58.5 hispanic, 30.1 white) – this area encompasses the mostly Mexican-descent areas on the south side of Chicago where there’s a higher proportion of non-citizens, so I made the Hispanic percentage here noticeably higher in order to make sure that a Hispanic Representative is elected.

Goal 3:  Make sure all currently Democratic-held seats are safely Democratic.

My estimate is that the 3 new black-majority seats and the 2 new hispanic seats above are all in the 75-79 Obama range (ofcourse, there’s currently only one hispanic seat but I’m classifying IL-4 and IL-6 as “Dem-held” as Gutierrez currently represents roughly half of each district) …

For the other currently Democratic-held seats the partisan numbers (ESTIMATED Obama as a percentage of the 2-party vote) are as follows:

New IL-3 is 62.3 Obama (current district is 64.4 Obama)

New IL-5 is 68.3 Obama (current district is 73.9 Obama)

New IL-9 is 70.2 Obama (current district is 73.2 Obama)

New IL-12 is 60.9 Obama (current district is 56.4 Obama)

Goal 4:  Incumbent-protection

I already discussed above what percentage of their constituents the Democrats in the minority-majority seats would keep.  For the other Democratic incumbents the numbers are as follows:

New IL-3: Lipinski gets to keep 33% of his current constituents (that’s the lowest percentage of all incumbent Democrats but a good chunk of the new Hispanic-majority IL-6 comes out of territory that’s currently a part of IL-3).

New IL-5: Quigley gets to keep 70% of his current constituents

New IL-9: Schakowsky gets to keep 75% of her current constituents

New IL-12: Costello gets to keep 63% of his current constituents

Goal 5:  Get rid of 7 of the current 11 GOP members through re-drawing of lines.

– As already mentioned, IL-6 goes from a suburban GOP district to a Hispanic-majority Democratic district based in Chicago (ofcourse, Roskam can run in the new IL-16 which becomes sort of a Chicago-area GOP vote sink).

– New IL-8 is 65.1 Obama (current district is 56.5 Obama), so Walsh is history (or he can run in the new IL-16).  The new IL-8 should be friendly to Bean if she wants to make a comeback.

– New IL-10 is 65.3 Obama (current district is 61.5 Obama), plus the district has a lot of new territory, including the entire Lake Michigan shoreline — so Dold is history.

– New IL-11 is 59.2 Obama (current district is 54.2 Obama).  Only 19% of Kinzinger’s current constituents remain in IL-11 under the new lines, so his base basically disappears with this map.  Also, the new IL-11 includes 3 major university towns.  It’s likely that this district would flip back to the Democratic side in 2012.

– New IL-14 is 62.4 Obama (current district is 55.6 Obama).  Hultgren won here over Foster by 51-45 (with the Green candidate at 4%) in a major GOP year, so the 7-point Democratic increase should more than do the job.  (Hultgren can run in the new IL-16 ofcourse.)

– New IL-17 is 60.8 Obama (current district is 57.2 Obama).  The lines are scrambled here considerably (less than half of the population of the new IL-17 comes out of Schilling’s current constituency) and most of Rockford is now included.  I really believe that almost any Democrat other than Hare would have no trouble here in 2012.

– IL-19 no longer exists, so that’s also one less Republican (although Shimkus may want to run in the new IL-18 — see below).

By my estimate, John Kerry would have won all of the 14 Democratic seats created by this map.

The four GOP seats that remain:

– IL-13: now transferred to the southern reaches of the state but without an incumbent.  Although Republican, less so than the other 3 GOP seats, so perhaps a possibility that a moderate to conservative Democrat could win here.

– IL-15: Johnson gets to keep 67% of his current constituents under the new lines.

– IL-16: The most likely Republicans to run here include Manzullo, Walsh, Hultgren, Roskam and Biggert (not necessarily in that order) — yes, the map packs these 5 into one district, with a few Dold precincts also included !

– IL-18: designed more for Shimkus than for Schock — 29% of the new district’s population comes out of Shimkus’ current district, while only 20% comes out of Schock’s … which brings me to the last goal …

Goal 6:  Make it hard for Kinzinger and Schock

I already discussed Kinzinger a bit above.  Basically, the current IL-11 gets split as follows: 19% of Kinzinger’s constituents remain in IL-11; 30% go into the new IL-2; 22% into IL-1; 18% into IL-3; 6% into IL-15; and 5% into IL-18.

As far as Schock, his current district is likewise torn apart; the highest proportion of his current constituents (30%) goes to IL-15; the rest is divided among IL-11 (27%); IL-18 (20%); IL-13 (15%); IL-12 (7%); with a sliver going to IL-17.

To briefly sum up my map:

1.) Democratic; black-majority; Rush

2.) Democratic; black-majority; Jackson

3.) Democratic; 62.3 Obama; Lipinski

4.) Democratic; hispanic-majority; Gutierrez

5.) Democratic; 68.3 Obama; Quigley

6.) Democratic; hispanic-majority; new Hispanic representative (?)

7.) Democratic; black-majority; Davis

8.) Democratic; 65.1 Obama; Bean (?)

9.) Democratic; 70.2 Obama; Schakowsky

10.) Democratic; 65.3 Obama; new Dem. representative (?)

11.) Democratic; 59.2 Obama; new Dem. representative (?)

12.) Democratic; 60.9 Obama; Costello

14.) Democratic; 62.4 Obama; Foster (?)

17.) Democratic; 60.8 Obama; new Dem. representative (?)

13.) Republican; new GOP Rep. (?)

15.) Republican; Johnson

16.) Republican; Manzullo, Hultgren or Walsh most likely to win here

18.) Republican; Shimkus

Illinois with 2 Hispanic* districts

This map is intended to favor Dems as they control both houses and the governor’s office. I tried to avoid any egregious gerrymanders, and I suspect that some of the suburban Chicago districts could be made more favorable. The only really ugly districts are IL5 (Quigley) and IL9 (Schakowsky). IL5 had to take a pretty strained shape to get a voting-age Hispanic plurality, although it still isn’t nearly as bad as the current Hispanic-majority IL4 (Gutierrez). IL9 had to pick up the vacated IL5 precincts that didn’t have enough Hispanics, as IL7 (Davis) has just a 50.1% voting-age black majority and could not pick anything up.  

State map:

Photobucket

Chicago area map:

Photobucket

Notes on districts, with voting-age populations. w = Anglo, b = black, h = Hispanic, a = Asian.

IL1 (blue, Rush): 38.2w-52.1b-7.4h-1.2a. Underpopulated and has to expand to the west. Safe D.

IL2 (green, Jackson): 36.0w-50.8b-11.2h-0.9a. Underpopulated and has to expand to the south to pick up most of Kankakee. The southernmost area is Pembroke, an 85% black semi-rural area which is unusual outside the south. Safe D.

IL3 (purple, Lipinski?): 77.2w-6.1b-8.9h-6.6a. This district has more of the current IL13 (Biggert) than the current IL3, as it really had nowhere else to go. It’s probably competitive. Tossup?

IL4 (red, Gutierrez): 31.3w-6.1b-58.3h-3.6a. One of the ugliest districts in the nation is now one of the cleanest. Safe D.

IL5 (yellow, Quigley): 43.2w-4.8b-44.4h-6.1a. I don’t think it’s possible to draw a second Hispanic-majority district without using really tortured lines. As is I think this proposed district as pushing it as far as “compact” goes, although obviously it isn’t nearly as screwy as the current IL4. Safe D

IL6 (teal, Roskam): 73.3w-3.1b-11.4h-11.1a. It picks up the Palatine and Schaumburg areas, and loses its heavily Hispanic area in the east and some of its western end. It may be slightly more red now, but I know very little about the political leanings of Chicago suburbs. Tilt R?

IL7 (gray, Davis): 31.0w-50.1b-9.8h-7.5a. There probably will not be 3 black-majority districts after 2020. Black plurality, maybe. Safe D.

IL8 (blue-gray, Walsh): 69.2w-6.4b-18.1h-5.1a. Dumps its piece of reddish McHenry county and some Cook suburbs, and picks up Waukegan, much of swingy Kane county, and bluish DeKalb county. This is intended for Melissa Bean to return to DC. Walsh doesn’t live here. Tilt D?

IL9 (toothpaste blue, Schakowsky): 73.1w-6.4b-10.0h-8.7a. Moves south and much more into Chicago proper. Safe D.

IL10 (pink, Dold!): 72.6w-4.1b-8.9h-12.9a. Moves south into IL9’s vacated areas, taking most of the college town of Evanston along with neighboring suburbs that are heavily Asian. This would probably be one of the most Asian districts outside California or Hawaii. The intent is to ensure that Dold! serves one term! Likely D?

IL11 (pea soup green, Kinzinger): 80.1w-5.8b-11.3h-2.0a. Loses some of its eastern end including Kinzinger’s house, picks up northwest Kendall county and some western rural areas. Lean R?

IL12 (light blue, Costello): 80.5w-14.7b-2.4h-1.2a. The St. Louis area district sheds most of its southern end but keeps the college town of Carbondale, and adds Macoupin county and the rest of Madison county. Obama got 57.3% of the two-party vote here. Lean D.

IL13 (pink-gray, Shimkus): 93.5w-3.6b-1.6h-0.5a. Renumbered from IL19. Downstate Republican sink. Safe R.

IL14 (brown-green, Hultgren): 61.4w-5.5b-24.1h-7.9a. Loses most of its western rural areas (which are actually swingy for the most part) and exurbs and picks up the Naperville and Hanover areas. Tossup?

IL15 (orange, Johnson):  80.5w-10.6b-3.0h-4.4a. This is my concept of the “midstate cities swing district” that jsramek mentioned on an earlier Illinois thread. It has Springfield, Decatur, Bloomington-Normal, Champaign, and Danville. Obama got 52.8% of the two-party vote in the 6 counties within the district, although it’s missing some (probably red) rural and exurban areas within these counties. Toss up, but it would likely take a very strong candidate to beat Johnson.

IL16 (garden hose green, Manzullo): 85.9w-2.7b-8.4h-2.0a. The north state Republican “sink”. It picks up the rest of McHenry and loses its western end and the bluest parts of Rockford. Walsh also lives here. Likely R?

IL17 (indigo, Schilling): 82.0w-9.6b-5.7h-1.5a. Moves north from its current fugly-mess configuration to take in purple or blue areas of the state’s northwest, including Peoria and the bluest parts of Rockford. Obama got 58.2% of the two-party vote here without any of Rockford, so his overall share here was probably closer to 60%. Lean D/likely D.

IL18 (yellow, Schock): 94.1w-2.6b-1.9h-0.5a. Mid-state Republican sink. Schock actually lives in IL17 but would probably run here. Likely R/safe R.

Under this map, the Dems would easily hold districts 1, 2, 4, 5, 7, and 9. They should (finally) take 10 and retake 8 and 17, and Costello shouldn’t have too much trouble in 12. Reeps will hold 13, 16, and 18. Then you have 3, 6, 11, 14, and 15 which appear to all be competitive and all of which could conceivably be held by Republicans. Given that 3, 6, 11, and 14 occupy a contiguous block of western and southwestern suburbs, I suspect it would be possible to draw them such that one of them is lean-R or even likely-R and the other 3 are tossup or tilt-D. (I would leave this for someone who knows more about Chicago-area politics.) As is, I would say this is a 10-3-5 map but probably 11-7 or 12-6.

Thoughts? In particular, thoughts about how the Dems might draw the lines in the western and southwestern Chicago suburbs?

By what margin will Bob Shamansky win?

View Results

Loading ... Loading ...

Illinois Democratic Gerrymander 12-6 – Updated

Illinois is losing one congressional district this year – going from 19 to 18.  I have created a map that takes the current map with a delegation of 11 Republicans and 8 Democrats to one with 12 Democratic seats and 6 Republican ones.  I consider this an ambitious gerrymander favoring the Democrats, but one that is realistic and keeps a few things in mind:

1.) Michael Madigan is in charge and he will look out for his interests first.  He also will never do a dummymander.

2.) The Democratic incumbents also have input and their interests will be considered.  None of them will want their district lines to change much and all want their Democratic primary bases to be kept intact.  They also don’t want to be thrown from safe seats to possibly competitive ones.

3.) African Americans will insist on maintaining their three black majority districts, no matter how much population they have lost in the city.  The Hispanics will want at least one – two may be forced by the courts – but Madigan and his allies will likely push for one Hispanic district to maintain Lipinski’s seat.  Also, we have seen in the City of Chicago that Hispanic majority seats often go to white incumbents who control the Democratic machine.  Alderman Ed Burke’s 14th ward is 88% Hispanic, Madigan’s 13th ward is 72% Hispanic and just elected somebody named “Marty Quinn” to be Alderman.  

4.) Madigan will go after Freshman GOP before those with more seniority.  Not only are they easier targets, but having seniority on both sides of the aisle is good for Illinois.

Below is each new district with data and analysis.  I have calculated the results from the 2010 Senate race (Kirk v. Giannoulias) and from the 2004 Presidential race (Bush v. Kerry – I know, old).  I used the 2010 Senate race rather than the Governor’s race because it is on the Federal level, and to use data against moderate Republican.  I did not calculate data from the 2008 election, because Obama’s landslide was far too big  and unevenly distributed in Illinois (I feel Chicagoland was much more skewed than Downstate).  The 2010 numbers are exact (to the precinct) except for Tazewell, Marion, Moultrie, and Menard Counties, which I allocated votes by ratio of population in each district.  The same goes for 2004 numbers, except I had to extrapolate the precinct data for Lake and Will counties from 2010 data.

For now, here are three tables with election data, racial population data, and VAP data.  I will add more analysis in the next few days.


District  Kirk   Alexi    Bush   Kerry    PVI

1        24.80% 75.20% 23.00% 77.00% D+30

2        25.26% 74.74% 26.39% 73.61% D+28

3        48.14% 51.86% 44.25% 55.75% D+8

4        26.57% 73.43% 26.90% 73.10% D+28

5        47.72% 52.28% 41.53% 58.47% D+10

6        63.33% 36.67% 57.66% 42.34% R+6

7        18.61% 81.39% 15.81% 84.19% D+37

8        53.71% 46.29% 46.66% 53.34% D+4

9        47.77% 52.23% 39.12% 60.88% D+11

10       47.75% 52.25% 39.70% 60.30% D+11

11       68.75% 31.25% 60.55% 39.45% R+10

12       53.24% 46.76% 47.02% 52.98% D+4

13       49.12% 50.88% 45.12% 54.88% D+7

14       64.94% 35.06% 59.55% 40.45% R+8

15       68.33% 31.67% 59.68% 40.32% R+10

16       67.03% 32.97% 57.86% 42.14% R+8

17       56.61% 43.39% 46.84% 53.16% D+3

18       68.31% 31.69% 60.39% 39.61% R+10

ALL

District  White  Black  Hispanic  Asian

1        35.5%   52.7%   8.2%   2.0%

2        31.4%   52.8%   13.4%   0.8%

3        59.5%   6.1%   27.7%   5.4%

4        18.7%   4.1%   73.3%   2.9%

5        65.1%   2.2%   24.4%   6.7%

6        75.4%   3.7%   8.8%   10.3%

7        27.6%   54.5%   12.2%   4.1%

8        48.6%   8.7%   31.5%   9.1%

9        67.4%   7.8%   10.6%   12.0%

10       72.2%   3.4%   10.9%   11.5%

11       92.7%   3.2%   2.0%   0.8%

12       77.5%   16.6%   2.8%   1.1%

13       53.0%   12.7%   27.3%   5.0%

14       82.5%   1.6%   11.4%   3.2%

15       85.4%   6.8%   3.1%   2.9%

16       88.6%   2.6%   6.3%   1.1%

17       77.9%   12.4%   5.8%   1.5%

18       86.7%   5.4%   4.8%   1.6%

VAP

District  White  Black  Hispanic  Asian

1        38.0%   51.7%   6.9%   2.2%

2        34.5%   51.8%   11.7%   0.8%

3        64.0%   5.9%   23.5%   5.7%

4        23.2%   4.1%   68.3%   3.4%

5        69.1%   2.0%   20.9%   6.8%

6        77.7%   3.5%   7.5%   10.2%

7        31.1%   51.8%   11.0%   4.8%

8        54.1%   8.1%   26.9%   9.4%

9        69.2%   7.8%   9.3%   12.1%

10       74.7%   3.3%   9.3%   11.2%

11       93.5%   3.2%   1.7%   0.8%

12       80.0%   15.3%   2.4%   1.1%

13       58.3%   12.1%   23.4%   5.0%

14       85.3%   1.4%   9.4%   3.1%

15       86.7%   6.2%   2.7%   3.2%

16       90.8%   2.4%   4.9%   1.1%

17       81.7%   10.8%   4.6%   1.5%

18       88.7%   5.1%   3.8%   1.5%

Illinois Statewide

Illinois Statewide 2

Northeast Illinois

Northeast Illinois

Northern Chicagoland

Southern Chicagoland

Central Chicago

Central Illinois

Springfield and Decatur

Southern Illinois

Redistricting Illinois Miserably (Update 1)

My attempt at redistricting Illinois and not doing a very good job.

I love playing with Dave’s App and I love redistricting Illinois. Please don’t shred me to pieces redistricting people! Teach me.

Also this does not take into account incumbents.

Photobucket

Photobucket

Photobucket

CD 1

Blue

Wh(34.6%); Bl(49.7%); Hisp(12.8%)

I’m sure it can be tweaked a little bit to make it completely majority black.

CD 2

Green

Wh(37.4%); Bl(55.9%); Hisp(4.2%)

CD 3

Purple

Wh(67.8%); Bl(20.8%); Hisp(8.9%)

CD 4

Red

Wh(20.1%); Bl(9.9%); Hisp(64.6%)

CD 5

Yellow

Wh(71.8%); Bl(7.5%); Hisp(16.9%)

CD 6

Teal

Wh(63.4%); Bl(7.5%); Hisp(21.9%)

CD 7

Silver

Wh(46.7%); Bl(35.7%); Hisp(11.4%)

CD 8

Slate Blue

Wh(38.1%); Bl(5.7%); Hisp(50.6)

CD 9

Cyan

Wh(66.3%); Bl(4.1%); Hisp(15.8%)

CD 10

Deep Pink

Wh(67.3%); Bl(8.7%); Hisp(12.2%)

Photobucket

Photobucket

Photobucket

Analyzing the Illinois Senate Election

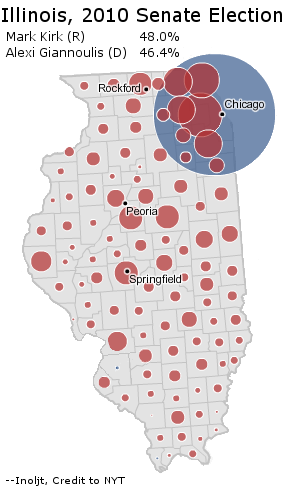
This is a part of a series of posts analyzing the 2010 midterm elections. This post will focus on the Illinois Senate election, in which Republican candidate Mark Kirk pulled out a close Republican victory in a strongly Democratic state.

Illinois’s Senatorial Election

Photobucket

More below.

Senator Mark Kirk’s victory follows the contours of a previous post, titled Previewing Senate Elections: Illinois. This post argued:

So what does Mr. Kirk have to do? Say that  he gets 35% of the vote in Cook County – propelled by inner-ring  suburban strength and minority apathy – and wins a landslide everywhere  else in the state (for instance, a 3:2 margin). This gives him 50.3% of  the vote in the 2008 Illinois electorate. If white Republicans downstate  turn out, and minorities in Chicago do not, Mr. Kirk may get bumped up  to a 2-3% victory.

As it turns out, this is almost exactly what actually happened in the election.

The previous analysis divided Illinois into three sections: Chicago, the suburbs of Chicago, and downstate Illinois. Let’s take a look at what Mr. Kirk did in each part of Illinois.

Chicago

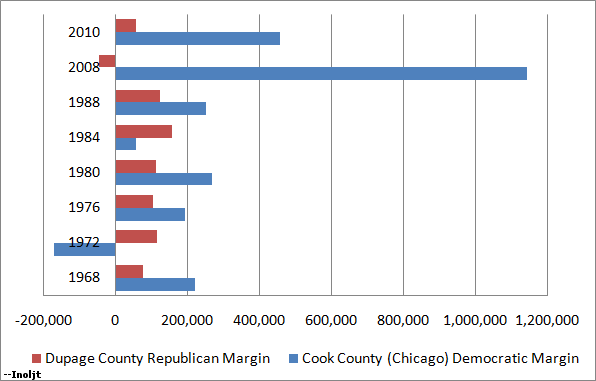
Illinois is generally a Democratic stronghold. Cook County, home to the  city of Chicago, composes more than 40% of the state’s population, and  Democrats always win by a landslide in the county. Republicans have to  stretch themselves to the limit everywhere else in the state – winning  even the areas that normally vote Democratic – to get close.

But Republicans also must dampen Democratic margins in Cook County. This happens if Republicans can do well in the parts of Cook County outside Chicago, which are whiter and more conservative. In the city of Chicago itself, most voters are so Democratic that they will prefer not voting to casting the ballot for a Republican. There, low turn-out is more important for Republicans than actually winning over voters.

In 2010, Democratic candidate Alexi Giannoulias won 64.3% of the vote in Cook County.

At first glance, this sounds quite good. Winning 64.3% of the vote is nothing to sniff at. No president has ever won that much of the popular vote in history.

But Senator John Kerry won 70.2% of the vote in Cook County. And President Barack Obama took 76.2% of the vote. In modern Illinois politics, a Democratic candidate who takes only 64.3% of the vote in Cook County is in deep trouble.

Chicago’s Suburbs

“Previewing Senate Elections, Illinois” stated that:

The true test of Mark Kirk’s candidacy will come in the Chicago suburbs…

He will not just have to win the suburbs, but  turn the clock back two decades – back to the glory years in which  Republicans won around 70% of the vote in DuPage County. (Mr. Kirk will  probably not have to do that well, given rising Republican strength  downstate.)

Is this doable? Given that Republicans seem  to be winning suburbs everywhere this year, it is certainly possible.  Mr. Kirk, moreover, has spent a decade representing a Chicago suburb  congressional district; this is why Republicans have nominated him.

As it turned out, Mr. Kirk passed the test with flying colors. His moderate image and suburban origin led to double-digit victories in every one of the collar counties surrounding Cook County.

In the past, Republicans have won Illinois through massive support in the Chicago’s suburbs to offset the Democratic advantage in Chicago itself. Mr. Kirk was able to somewhat replicate this model in 2010:

Photobucket

This strength did not extend to all Republicans. Republican candidate Bill Brady, for instance, still won the Chicago suburbs. But his margins were just the slightest bit off – a high single-digit rather than double-digit victory here; a 15-point rather than 20-point margin there – and ultimately this led to Mr. Brady’s defeat.

Downstate Illinois

Imagine that the year is 1990, and Republican Mark Kirk pulls the exact same numbers in the Chicago metropolis.

Most analysts in that year would say that Mr. Kirk is on his way to a sure loss – after all, Democrats are quite competitive in downstate Illinois, and Mr. Kirk just hasn’t squeezed enough juice from the collar counties.

Today, however, downstate Illinois has trended firmly Republican. Without this trend Mr. Kirk would not have won.

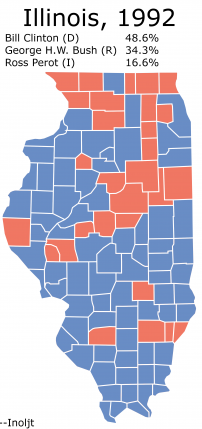
Here is an illustration of Illinois in the 1992 presidential election:

Photobucket

President Bill Clinton is doing quite well, winning almost every single county downstate – many by double-digits. Compare this to President Barack Obama’s performance:

Photobucket

Mr. Obama is actually doing much better in Illinois than Mr. Clinton, and yet he loses a number of the downstate counties Mr. Clinton won.

This illustrates the shift in downstate Illinois to the Republican side, and in 2010 Mr. Kirk took full advantage of that trend to win re-election.

Conclusions

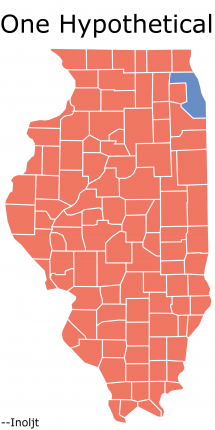
The post “Previewing Senate Elections: Illinois” concluded by mapping, somewhat light-heartedly, a hypothetical Republican victory:

Photobucket

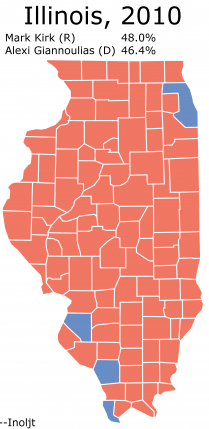
Mr. Kirk’s victory ended up looking extremely similar:

Photobucket

All in all, it is always exciting to see a Republican victory in a Democratic  stronghold, or a Democratic victory in a Republican stronghold. Mr.  Kirk’s victory is the first time a Republican has won Illinois in quite a  while. It constitutes one of the Republican Party’s greatest triumphs  in the 2010 midterm elections.

–Inoljt

IL and OK: Population by CD

The four states this week for the Census 2010 data dump are Illinois, Oklahoma, South Dakota, and Texas. South Dakota has only one congressional district and Texas I’m reserving for its own special in-depth post which will look at changes in racial composition in each district over the decade (and Texas isn’t out yet today, so it’s a moot point), so here are just Illinois and Oklahoma. The Illinois target (based on the drop to 18 seats) is 712,813. (Check out the depopulation on Chicago’s South Side in IL-01 and IL-02. Bobby Rush and Jesse Jackson Jr.’s districts already include small amounts of suburbs, but they’re going to need to take on significantly more.)


District Population Deviation
IL-01 587,596 (125,217)
IL-02 602,758 (110,055)
IL-03 663,381 (49,432)
IL-04 601,156 (111,657)
IL-05 648,610 (64,203)
IL-06 657,131 (55,682)
IL-07 638,105 (74,708)
IL-08 738,840 26,027
IL-09 628,859 (83,954)
IL-10 650,425 (62,388)
IL-11 759,445 46,632
IL-12 666,459 (46,354)
IL-13 773,095 60,282
IL-14 840,956 128,143
IL-15 681,580 (31,233)
IL-16 718,791 5,978
IL-17 634,792 (78,021)
IL-18 665,723 (47,090)
IL-19 672,930 (39,883)
Total: 12,830,632

In case you were wondering about population growth in the few Illinois districts where the state’s growth was concentrated, much of that growth is Hispanic. For instance, IL-08 went from 11% Hispanic in 2000 to 17% Hispanic in 2010. IL-11 went from 7% to 11% Hispanic. IL-13 went from 5% to 11% Hispanic, while IL-14 went from 18% to 25% Hispanic. (Perhaps not coincidentally, we lost seats in three of these districts, as turnout in 2010 was much whiter and older than in 2008.)

Oklahoma (which stays at 5, and where the growth has been remarkably consistent across CD boundaries) has a target of 750,270.


District Population Deviation
OK-01 754,310 4,040
OK-02 729,887 (20,383)
OK-03 732,394 (17,876)
OK-04 785,424 35,154
OK-05 749,336 (934)
Total: 3,751,351

Redistricting outlook: Idaho-Iowa

Now that it’s 2011, the redistricting games will soon begin in earnest, with more detailed Census data expected in February or March and some states holding spring legislative sessions to deal with drawing new maps. Long ago I planned to do state-by-state rundowns of the redistricting process as soon as 2010 election results and Census reapportionment were clear. Now that time has arrived, and it’s time to look at Idaho, Illinois, Indiana, and Iowa.

Previous diary on Alabama, Arizona, and Arkansas

Previous diary on California, Colorado, and Connecticut

Previous diary on Florida, Georgia, and Hawaii

The rest below the fold…

Idaho

Photobucket

Districts: 2

Who’s in charge? Nonpartisan commission

Is that important? Nope

Idaho competes with Hawaii for the prize of least interesting congressional redistricting process of the decade. The commission will move some precincts around to achieve population equality, and Reps. Labrador and Simpson will likely stay in office with huge majorities throughout the 2010s.

Illinois

Photobucket

Districts: 18, down from 19 in 2002

Who’s in charge? Democrats

Is that important? Extremely

This will be the first time in a long while that Democrats control redistricting in Illinois, and as their only obvious major gerrymandering opportunity of the decade, they will milk the state for every seat it’s worth. In such a blue state with an 11-8 Republican majority in its congressional delegation, big swings should not be difficult. They will likely eliminate a GOP seat in the Chicago area (my guess: force Bob Dold and Joe Walsh together in a more Republican North Shore district), though there’s been some discussion of eliminating a downstate district instead (say, Bobby Schilling’s or Aaron Schock’s). That is only the beginning. Lessening the minority percentages by just a little in the 1st, 2nd, 4th, and 7th could ruin suburban Republicans like Adam Kinzinger and Peter Roskam, while liberal urban districts like the 9th and 5th could easily stretch westward to lessen GOP fortunes in nearby seats. In using Dave’s application, I found it possible to create an ethnically diverse, heavily Democratic 11th District for Kinzinger simply by lowering the African-American percentages for Rush and Jackson to the 52-53% range.

I think the Democrats will seek to gain perhaps three seats, for an 11-7 Democratic edge. Given the necessity of VRA protection in those four Chicago seats, any more would be pushing their luck. The most likely Republican casualties are Dold, Walsh, Kinzinger, Roskam, and Schilling, though at least one of them will likely be strengthened by the new gerrymander.

Indiana

Photobucket

Districts: 9

Who’s in charge? Republicans

Is that important? Yes

The bad news for Democrats is that Joe Donnelly is almost certainly toast — split up South Bend and Michigan City between two districts and he will be running in a much more GOP-friendly seat than the current Obama-supporting 2nd District. The silver lining is that Republicans can’t make things much worse for them otherwise. Democratic vote concentration in Lake County and Indianapolis will ensure solid vote sink districts for Pete Visclosky and Andre Carson, and Gov. Mitch Daniels has urged his party not to go crazy with boundary lines (this probably applies more to legislative districts, since only the 2nd will be significantly politically altered in this case).

Iowa

Photobucket

Districts: 4, down from 5 in 2002

Who’s in charge? Nonpartisan commission, with legislative approval

Is that important? Yes

Since the commission will not want to combine two Democrats (Braley and Loebsack) or two Republicans (King and Latham), it is almost sure that Tom Latham will face Leonard Boswell in a politically competitive Des Moines/Ames district. Latham has generally overperformed GOP baseline in his district while Boswell has had a number of tough races over the years and will be 78 next year. I could see the latter retiring if forced to run against Latham. But time will tell. Boswell’s tenacity — winning races since 1996 that, more often than not, have been relatively close — may ultimately pay off.

15-3 Illinois Map: First Attempt

The goal of this map is to reduce the number of Republican representatives in Illinois from the current 11 to 3.  I must admit that my ideal would be for every single state to have a non-partisan commission to do redistricting.  Doing partisan maps such as this is indeed playing “ugly.”  However, as long as Republicans continue to push the envelope on this issue (including unprecedented mid-decade remaps like the one in Texas) there is no reason the Democratic Party should not likewise draw partisan maps in the states where it controls the process.

This is my first try at Illinois using Dave’s Application.  It’s really a type of “first-draft” for me because the Application currently does not provide partisan data.  I focused here more on demographics — making sure the three African-American majority seats and single Hispanic majority seat are preserved, as well as creating a second Hispanic-majority seat.  In several past diaries on Illinois, I read comments that a second seat might not be viable.  However, I think a viable second seat can be created without too much trouble on the south side of Chicago — one that’s at least 63% Hispanic (under this proposed plan) while preserving the north side seat (which is 59% Hispanic under this map).  I intentionally made the “south-side” seat relatively more Hispanic as that area is composed mostly of Mexican-Americans, while the “north-side” seat encompasses people of mostly Puerto Rican descent who are all citizens and therefore does not need to be as Hispanic.  

The partisan goal here was to basically create a 15-3 map (as I feel that is very doable in Illinois), but since the partisan data isn’t in the Application yet, it was a very tedious process trying to get to the right balance.  To a large extent, I first drew the general outlines of districts and only then applied partisan precinct-level data from various county sources (see links at bottom of diary).  Once drawn, it was very time-consuming to adjust the precincts and data.  Therefore, some of my districts are not really as Democratic as I would like them to be.  Getting them more Democratic would be much easier with the partisan data in the Application, as you could easily try and try again to get just the right balance.  The Application is truly invaluable in doing this right, and I feel that once the partisan data is in the system, a much better map can be constructed.  Nevertheless, here’s the first draft.  Since I will likely do this again once the partisan data is input into the system, I really welcome comments on how to make Illinois truly a lock-proof 15-3 plan.  This is the Democrats biggest chance to really make a Democratic map this cycle — one that may have an effect on whether we win back the House next year.

I tried to draw many of the districts in a manner whereby the Democratic incumbents get to keep as many of their constituents as possible, while the GOP incumbents’ districts are basically torn apart by the map — if that means a Democrat will subsequently have a better chance at taking over a district.  While individual GOP districts are torn apart, counties and communities are not. The resulting map is overall actually less gerrymandered than the current map, with the new map trying to keep counties and communities within the same district. Under the existing map, there are 149 “county-fragments” in Illinois, while under the proposed map here the number of “county-fragments” goes down to 134 (granted, the number of districts goes down from 19 to 18).  The  Obama – McCain (2008) numbers are drawn from actual precinct data — though imperfect because it didn’t match in a small portion of cases (kind of like the partisan data in the Application for Maryland, where there’s still a number of precincts that don’t match and/or missing data), and in a very small number of cases in rural Illinois, I had to estimate the numbers because county data (Bureau, Carroll, Jersey, Perry and Vermilion) was not available online.  The bottom line, therefore, for my Obama – McCain numbers is that I feel that they are accurate to maybe +/- 1 percentage point (but not perfect as would be with the Application).  I tried to also provide Kerry – Bush (2004) numbers for the districts, but here the effort is pure estimation using larger geographical subsets like wards and townships (it was just too tedious to do this by precinct) … so those numbers should be looked at in that light, though I feel they are still probably not off by more than a couple points from reality.  (My population deviation is no more than +/- 938 persons per district).

Photobucket

Photobucket

Photobucket

To start, I’d like to discuss what happens to the GOP incumbents under this plan … The first 8 districts here are ones where the goal is to bump out the Republican incumbent and replace them with a Democrat (first 7), or in the case of IL-19, the district just disappears with reapportionment and makes a Republican disappear with it.

IL-6: Roskam’s district is divided among the new IL-6 (about 1/3) and IL-14 (about 1/3), with the remaining 1/3 divided among IL-4, IL-5, IL-7 and IL-9.  His Wheaton home remains in the new IL-6, but a larger portion of the revamped district comes out of Lipinski’s current IL-3.  So the most likely result is a Roskam – Lipinski matchup, which is likely to go to Lipinski (for reasons discussed under “District 6” below) … or a Roskam – Foster matchup, with Foster having an advantage as he would represent more than half of the new IL-14, which now becomes significantly more Democratic.

IL-8: Over half of Walsh’s current IL-8 remains within the boundaries of the new district (although not Walsh’s home).  (The rest is split among IL-5, IL-9, IL-10, IL-14 and IL-16.)  The revamped IL-8 becomes significantly more Democratic than the current version.

IL-10: Dold’s current district is split up among several new districts: the new IL-10 gets about 1/3 (including Dold’s home in Kenilworth), the new IL-9 gets about 1/3 while the remaining 1/3 is split among IL-5 and IL-8.  The new IL-10 becomes significantly more Democratic than the current version.

IL-11: Only about 1/4 of Kinzinger’s current district remains inside the revamped IL-11.  About 2/5 goes to the new IL-13, which becomes a much more Democratic district (67% Obama).  The rest is shared between the new IL-2 (including Kinzinger’s home area in Kanakee Co.), the new IL-1 and the new IL-16.

IL-13: Biggert’s district is basically annihilated.  About 1/4 remains in the new IL-13.  About 1/4 (including Biggert’s home area around Hinsdale) goes to IL-7, while the remaining 1/2 is almost equally divided in three and attached to the new IL-1, IL-6 and IL-14.

IL-14: About 1/2 of Hultgren’s current district remains under the new lines.  About 1/4 goes to IL-5 and 1/4 to IL-11 (with a small part to IL-16 and IL-17).  Hultgren’s home remains in the district, which is made significantly more Democratic.

IL-17: A little over 1/3 of the current IL-17 remains under the new lines (Schilling’s home in Colona is excluded).  Another 1/3 becomes part of the new IL-18, while the remainder is split between IL-12, IL-15 and IL-16.  The Democratic percentage goes up by several points.

IL-19 (Shimkus) disappears from Illinois with reapportionment; however, Shimkus could choose to run in the new IL-18, as his home is in Madison Co.

The last 3 districts created are ones which are designed to stay in GOP hands.  They are made to be basically “sink” areas, which contain as many Republicans as possible … These include IL-15 (Johnson), IL-16 (Manzullo) and IL-18 (Schock or Shimkus).    

Now, to a detailed discussion of individual districts …

District 1:

Proposed District Demographics: 52% black; 40% white; 5% hispanic

Current District: Obama 87; McCain 13

Proposed District: Obama 76; McCain 23

Current District: Kerry 83; Bush 17

Proposed District: Kerry 71; Bush 29 (Estimate)

Incumbent(s): Rush

Rush gets to keep 61% of his current constituents.  About 15% of the new district (population-wise) comes out of territory currently a part of IL-13, while 14% comes out of IL-11.  The remainder is attached from areas currently a part of IL-2, IL-3 and IL-7.

District 2:

Proposed District Demographics: 51% black; 38% white; 10% hispanic

Current District: Obama 90; McCain 10

Proposed District: Obama 78; McCain 21

Current District: Kerry 84; Bush 16

Proposed District: Kerry 72; Bush 28 (Estimate)

Incumbent(s): Jackson; Kinzinger

Jackson gets to keep 56% of his current constituents.  About 20% of the new district comes out of territory currently a part of IL-11 (including Kinzinger’s home area), 12% comes out of IL-1, while 11% is taken out of IL-15.

District 3:

Proposed District Demographics: 63% hispanic; 28% white; 5% black

Current District: Obama 64; McCain 35

Proposed District: Obama 78; McCain 20

Current District: Kerry 59; Bush 41

Proposed District: Kerry 73; Bush 27 (Estimate)

Incumbent(s): None

The current IL-4 is split exactly in half by this plan: 49% of the new IL-3 comes out of territory currently in IL-4 (while the new IL-4 also gets to keep 49% of the existing IL-4).  40% of the proposed IL-3 comes out of the current IL-3, while the remainder is formed out of parts of IL-1, IL-2 and IL-7.  In the meantime, about 44% of the existing IL-3 goes into the new IL-6 and becomes the largest chunk of that revamped district; therefore, Lipinski basically gets to keep his district while a second Hispanic district can still be created here (encompassing people largely of Mexican descent).  The 63% hispanic – 28% white ratio here should ensure that a Hispanic rep is elected.

District 4:

Proposed District Demographics: 59% hispanic; 29% white; 6% black; 5% asian

Current District: Obama 85; McCain 13

Proposed District: Obama 77; McCain 22


Current District: Kerry 79; Bush 21

Proposed District: Kerry 70; Bush 30 (Estimate)

Incumbent(s): Gutierrez

As discussed above, Gutierrez gets to keep 49% of his current constituents.  About 30% of the new district comes out of territory currently a part of IL-5, while 11% comes out of IL-9.  The remainder is attached from areas currently a part of IL-6 and IL-7.  This new district isn’t “as Hispanic” as the new IL-3, as people of Puerto Rican descent are already citizens and so the Hispanic: white ratio does not need to be as large in order for a Hispanic rep to be elected here.

District 5:

Proposed District Demographics: 74% white; 16% hispanic; 7% asian

Current District: Obama 73; McCain 26

Proposed District: Obama 62; McCain 37


Current District: Kerry 67; Bush 33

Proposed District: Kerry 54; Bush 45 (Estimate)

Incumbent(s): Quigley

Quigley gets to keep 48% of his current constituents.  About 27% of the new district comes out of territory currently a part of IL-14, while 11% comes out of IL-6.  The remainder is attached from areas currently a part of IL-4, IL-7, IL-8, IL-9 and IL-10.

The Democratic percentage does down significantly as the lines are changed.  However, it should be noted that Quigley won with 71% this past November under the current lines, with the GOP candidate at 25% and the Green party candidate at 4%.  Even if the Democratic percentage is reduced by a dozen points or so, a competent Democrat like Quigley should still win rather comfortably here.  (Having said that, once the partisan data is put into the Application, I would like to make this district a tad more Democratic).

District 6:

Proposed District Demographics: 81% white; 9% hispanic; 5% asian

Current District: Obama 56; McCain 43

Proposed District: Obama 56; McCain 43

Current District: Kerry 47; Bush 53

Proposed District: Kerry 49; Bush 51 (Estimate)

Incumbent(s): Lipinski, Roskam

About 44% of the new district’s population is comprised of current constituents of Lipinski’s IL-3, while about 31% are currently a part of Roskam’s IL-6 (18% come out of the current IL-13, while the rest are transferred from IL-1, IL-4 and IL-7.)  Overall, 57% of the new IL-6 would be in Cook Co. and 43% in DuPage Co.  I believe that the advantage in such a situation goes to Lipinski.  Even during the recent GOP wave, Lipinski won his district with 70% of the vote, with the GOP candidate at 24% and the Green party candidate at 6%.  He was one of only two Illinois Democrats who had a higher winning percentage in 2010 than Obama had in 2008 in their district (the other was Costello, and Lipinski did better among the two).  In the meantime, Roskam won his district by “only” a 64-36 ratio in November of last year.  I think that the numerical breakdowns discussed above in combination with Lipinski’s conservadem qualities would make him the prefect candidate for the revamped IL-6.

District 7:

Proposed District Demographics: 51% black; 36% white; 6% hispanic; 6% asian

Current District: Obama 88; McCain 12

Proposed District: Obama 78; McCain 21

Current District: Kerry 83; Bush 17

Proposed District: Kerry 72; Bush 28 (Estimate)

Incumbent(s): Davis, Biggert

Davis gets to keep 61% of his current constituents.  About 27% of the new district comes out of territory currently a part of IL-13 (including Biggert’s home area), while the remainder is attached from areas currently a part of IL-1, IL-3, IL-4, IL-5 and IL-6.

District 8:

Proposed District Demographics: 65% white; 21% hispanic; 7% black; 6% asian

Current District: Obama 56; McCain 43

Proposed District: Obama 59; McCain 40

Current District: Kerry 44; Bush 56

Proposed District: Kerry 49; Bush 51 (Estimate)

Incumbent(s): None

Unlike other GOPers, Walsh gets to keep more of his territory — 55% in this case (although not his Winnetka home).  The reason is simple — it’s also Melissa Bean’s territory, and she may decide to run again.  She lost by only a point in November (one of the few races where the Green party candidate screwed the Democrat this past election).  The district is made several points more Democratic (as territory is added from adjoining districts: 25% from IL-10 — basically the very Democratic Waukegan and North Chicago, and 21% from IL-16 – more Democratic parts of McHenry Co. like Crystal Lake).  The increase in Democratic numbers in combination with Obama being on top of the ticket in 2012 should make this revamped district a great comeback opportunity for Bean.

District 9:

Proposed District Demographics: 71% white; 14% asian; 10% hispanic

Current District: Obama 72; McCain 26

Proposed District: Obama 63; McCain 36


Current District: Kerry 68; Bush 32

Proposed District: Kerry 57; Bush 43 (Estimate)

Incumbent(s): Schakowsky

Schakowsky gets to keep 52% of her current constituents.  About 37% of the new district comes out of territory currently a part of IL-10 (basically the Cook Co. portion of that district), while the remainder is attached from areas currently a part of IL-6 and IL-8.

Schakowsky won with 66% last November, with the GOP candidate at 31% and the Green party candidate at 3%.  I really don’t see her losing under these new lines.

District 10:

Proposed District Demographics: 76% white; 8% asian; 8% hispanic; 6% black

Current District: Obama 61; McCain 38

Proposed District: Obama 65; McCain 33

Current District: Kerry 53; Bush 47

Proposed District: Kerry 57; Bush 43 (Estimate)

Incumbent(s): Dold, Walsh

Dold gets to keep only 32% of his current constituents.  About 21% of the new district comes out of territory currently a part of IL-8, 20% comes out of IL-9, 13% out of IL-7 and 12% out of IL-5.  The district becomes several more points (about 4 points) more Democratic, as it expands southward into lake-side Chicago neighborhoods — and in combination with Obama being on top of the ticket, a good Democratic candidate would be likely to take this district back in 2012.

District 11:

Proposed District Demographics: 79% white; 8% black; 8% Hispanic

Current District: Obama 53; McCain 45

Proposed District: Obama 56; McCain 43

Current District: Kerry 46; Bush 53

Proposed District: Kerry 48; Bush 52 (Estimate)

Incumbent(s): Johnson

It should be noted that Kinzinger no longer lives in this district.  Johnson does and, in fact, areas in his current IL-15 form the largest percentage (42%) of the new district’s population.  27% comes out of the current IL-11, while 27% comes out of IL-14.  The remainder is attached from areas currently a part of IL-16 and IL-18.  Johnson could conceivably still run and win here, but the new IL-15 would seem to present a much better opportunity for Johnson (discussed below).  The proposed IL-11  encompasses no less than three major college towns: Champaign-Urbana (Univ. of Illinois); Bloomington (Illinois State Univ. and Illinois Wesleyan Univ.) and DeKalb (Northern Illinois Univ.)  Ideally, the enthusiasm shown by that demographic in 2008 will repeat itself next year, and would make this a Democratic pick-up.

District 12:

Proposed District Demographics: 78% white; 17% black

Current District: Obama 54; McCain 44

Proposed District: Obama 57; McCain 41

Current District: Kerry 52; Bush 48

Proposed District: Kerry 55; Bush 45 (Estimate)

Incumbent(s): Costello

Costello gets to keep 82% of his current constituents.  About 12% of the new district comes out of territory currently a part of IL-17, while the remainder is attached from areas currently a part of IL-18 and IL-19.  The district becomes more Democratic as it expands into the central part of Springfield, while a few more conservative counties in the south are wholly or partly detached.

District 13:

Proposed District Demographics: 58% white; 22% black; 15% hispanic

Current District: Obama 54; McCain 45

Proposed District: Obama 67; McCain 32

Current District: Kerry 45; Bush 55

Proposed District: Kerry 59; Bush 40 (Estimate)

Incumbent(s): None

About 42% of the new district’s population comes out of territory currently a part of IL-11, 29% comes out of IL-13, and 28% comes out of IL-2 (with a sliver out of IL-1).  Neither Kinzinger nor Biggert live within the current lines, and even if they did it would be hard to win in a revamped 67% Obama district.  Only question becomes which local Democrat could run here (Halvorson comeback ?).

District 14:

Proposed District Demographics: 60% white; 26% hispanic; 7% asian; 6% black

Current District: Obama 55; McCain 44

Proposed District: Obama 60; McCain 39

Current District: Kerry 44; Bush 55

Proposed District: Kerry 49; Bush 50 (Estimate)

Incumbent(s): Hultgren

Hultgren gets to keep 51% of his current constituents.  The reasoning is the same as with IL-8 above — the new lines may present a great comeback opportunity for Foster.  (32% of the new district comes out of the current IL-6, 13% out of IL-13, and the rest from IL-8).  The roughly half of IL-14 that remains under the new lines encompasses the most Democratic parts of IL-14.  In fact, in November while losing in the district overall by 51-45 (with the Green candidate at 4%), Foster won the half that remains here by roughly 54-42-4.  (He had big margins in Aurora and Elgin, and lost smaller areas like Batavia and the western townships of DuPage Co. by much smaller margins.)  In addition, the areas attached to the new IL-14 from IL-6, IL-13 and IL-8 are relatively more Democratic parts of those districts.  For example, during the 2006 matchup between Roskam and Duckworth in IL-6, Duckworth won the Bloomingdale Township and Wayne Township parts of IL-6, as well as Hanover Township in northwestern Cook Co.

During the 2008 election, Biggert won the Naperville part of IL-13 against Harper, but it was the closest Harper came to Biggert in DuPage Co. in that election (he lost the township by less than 2,000 votes out of approx. 40,000 cast there.)  So, all in all, Democrats have performed quite well in recent House elections in almost every corner of the new IL-14.

District 15:

Proposed District Demographics: 94% white

Current District: Obama 48; McCain 50 (Current IL-19 is Obama 44; McCain 54)

Proposed District: Obama 42; McCain 56

Current District: Kerry 41; Bush 59 (Current IL-19 is Kerry 39; Bush 61)

Proposed District: Kerry 36; Bush 64 (Estimate)

Incumbent(s): None (but designed for Johnson)

Johnson gets to keep 36% of his constituents if he decides to run here.  A larger percentage, 53%, comes out of the current IL-19 (which is set to disappear entirely as Illinois loses a House seat), but Shimkus’ home area around Collinsville is outside of the new district’s lines, and it would make more sense for Shimkus to run in the new IL-18, and for Johnson to run in this new hyper-Republican district.  (11% of the new district’s population comes out of the current IL-12, while a sliver comes out of IL-17).

District 16:

Proposed District Demographics: 90% white; 6% hispanic

Current District: Obama 53; McCain 45

Proposed District: Obama 47; McCain 52

Current District: Kerry 44; Bush 55

Proposed District: Kerry 39; Bush 61 (Estimate)

Incumbent(s): Manzullo, Schilling

Manzullo gets to keep 42% of his current constituents, but the new district also includes areas currently in IL-18 (34% of new district’s population), as well as smaller parts of IL-8, IL-11, IL-14, IL-15 and IL-17.  This could turn into a 2-way matchup between Manzullo and Schock (with Schilling living in the new district, but representing very little of it.)

District 17:

Proposed District Demographics: 77% white; 11% black; 8% hispanic

Current District: Obama 56; McCain 42

Proposed District: Obama 59; McCain 39

Current District: Kerry 51; Bush 48

Proposed District: Kerry 52; Bush 47 (Estimate)

Incumbent(s): Schock (but district not designed for him)

The new IL-17 runs from Rockford to Peoria.  It is formed out of parts of the current IL-17 (39% of new district); IL-16 (36%); IL-18 (23%); and IL-14 (2%).  The lines are intentionally scrambled to mess up the chances of any particular GOP congressman from running here: Schilling represents IL-17 today, but doesn’t live in the revamped version, while Schock lives here under the new lines but would represents only 23% of the new district’s population.  The overall Democratic numbers also go up several points.  All this is done to better Democratic chances in taking back IL-17 in 2012.

District 18:

Proposed District Demographics: 91% white; 5% black

Current District: Obama 48; McCain 50

Proposed District: Obama 48; McCain 51

Current District: Kerry 42; Bush 58

Proposed District: Kerry 42; Bush 58 (Estimate)

Incumbent(s): Shimkus

This new district is yet another one that really messes with the Illinois GOP.  It will ultimately elect a Republican, but it’s anyone’s guess as to which one will it be.  The district encompasses almost equal thirds of the current IL-17 (Schilling) – 33%; IL-18 (Schock) – 33%; and IL-19 (Shimkus) – 32% of the new district’s population (2% comes out of IL-15).   So, we could possibly see a GOP primary here with three incumbents.

PS. I’m working on diaries for Arkansas, West Virginia and one predicting what the commission may do in California; should post later this week.

Sources for data:

http://www.chicagoelections.co…
http://www.cookcountyclerk.com…

http://dupageelections.com/pag…

http://results.enr.clarityelec…

http://results.enr.clarityelec…

http://www.kanecountyelections…

http://www.co.mchenry.il.us/de…

http://www.voterockford.com/

http://elections.winnebagocoun…

http://www.ci.peoria.il.us/res…

http://www.co.peoria.il.us/dis…

http://www.becvote.org/pastres…

http://www.mcleancountyil.gov/…

http://www.champaigncountycler…

http://www.co.stephenson.il.us…

http://www.co.sangamon.il.us/e…

https://spreadsheets.google.co…