In my last diary the blue statewide trend in California voter registration was quite clear.
But what about the parts of counties with multiple congressional districts?
Below the fold to crack open the walnut…………..
In my last diary the blue statewide trend in California voter registration was quite clear.
But what about the parts of counties with multiple congressional districts?
Below the fold to crack open the walnut…………..
As we patiently await draft Californian congressional maps to be released later this year it is appropriate to check out the trends in voter registration. Given that the boundaries will inevitably change; comparisons by County rather than by CD are illuminating to say the least.
Below the fold for a comparison between October 2006 and October 2010 (midterm to midterm).
| COUNTY | CURRENT CD/S | DEM 2006 REG | REP 2006 REG | GAP | DEM 2010 REG | REP 2010 REG | GAP | TREND | ||
|---|---|---|---|---|---|---|---|---|---|---|
| Alameda | 9,10,11,13 | 55.22% | 17.52% | D+37.70% | 56.81% | 15.71% | D+41.10% | D+3.40% | ||
| Alpine | 3 | 35.74% | 34.97% | D+0.77% | 38.2% | 33.42% | D+4.78% | D+4.01% | ||
| Amador | 3 | 34.91% | 46.46% | R+11.55% | 33.14% | 45.66% | R+12.52% | R+0.97% | ||
| Butte | 2,4 | 34.57% | 41.13% | R+6.56% | 34.71% | 39.23% | R+4.52% | D+2.04% | ||
| Calaveras | 3 | 33.94% | 44.79% | R+10.85% | 32.32% | 42.88% | R+10.56% | D+0.29% | ||
| Colusa | 2 | 35.58% | 46.5% | R+10.92% | 35.12% | 46.15% | R+11.03% | R+0.11% | ||
| Contra Costa | 7,10,11 | 48.12% | 29.61% | D+18.51% | 49.8% | 26.27% | D+23.53% | D+5.02% | ||
| Del Norte | 1 | 36.52% | 39.18% | R+2.66% | 36.65% | 37.55% | R+0.90% | D+1.76% | ||
| El Dorado | 4 | 30.71% | 46.51% | R+15.80% | 30.19% | 44.92% | R+14.73% | D+1.07% | ||
| Fresno | 18,19,20,21 | 39.46% | 45.29% | R+5.84% | 40.99% | 40.96% | D+0.03% | D+5.87% | ||
| Glenn | 2 | 32.54% | 47.33% | R+14.79% | 31.25% | 45.81% | R+14.56% | D+0.23% | ||
| Humboldt | 1 | 41.35% | 28.91% | D+12.44% | 42.59% | 26.83% | D+15.76% | D+3.32% | ||
| Imperial | 51 | 55.26% | 26.34% | D+28.92% | 51.68% | 26.66% | D+25.02% | R+3.90% | ||
| Inyo | 25 | 32.14% | 45.14% | R+13% | 32.28% | 44.3% | R+12.02% | D+0.98% | ||
| Kern | 20,22 | 35.7% | 47.4% | R+11.7% | 35.31% | 44.09% | R+8.78% | D+2.92% | ||
| Kings | 20 | 37.89% | 46.83% | R+8.94% | 36.15% | 45.36% | R+9.26% | R+0.32% | ||
| Lake | 1 | 43.29% | 32.03% | D+10.26% | 42.96% | 29.34% | D+13.62% | D+3.36% | ||
| Lassen | 4 | 28.93% | 46.62% | R+17.69% | 26.85% | 47.82% | R+20.97% | R+3.28% | ||
| Los Angeles | 22,25 – 39,42,46 | 49.74% | 27.02% | D+22.72% | 51.4% | 23.58% | D+27.82% | D+5.10% | ||
| Madera | 18,19 | 33.7% | 49.21% | R+15.51% | 35.28% | 45.08% | R+9.8% | D+5.71% | ||
| Marin | 6 | 51.73% | 22.44% | D+29.29% | 54.61% | 19.32% | D+35.29% | D+6.00% | ||
| Mariposa | 19 | 32.3% | 46.81% | R+14.51% | 31.07% | 44.92% | R+13.85% | D+0.66% | ||
| Mendocino | 1 | 46.27% | 24.86% | D+21.41% | 47.2% | 22.48% | D+24.72% | D+3.31% | ||
| Merced | 18 | 45.01% | 41.03% | D+3.98% | 46.27% | 34.74% | D+11.53% | D+7.55% | ||
| Modoc | 4 | 30.22% | 49.34% | R+19.12% | 26.76% | 49.24% | R+22.28% | R+3.16% | ||
| Mono | 25 | 31.1% | 38.64% | R+7.54% | 32.37% | 36.91% | R+4.54% | D+3.00% | ||
| Monterey | 17 | 48.23% | 30.8% | D+17.43% | 53.45% | 25.52% | D+27.93% | D+10.50% | ||
| Napa | 1 | 46.08% | 31.36% | D+14.72% | 47.2% | 27.21% | D+19.99% | D+5.27% | ||
| Nevada | 4 | 32.2% | 42.96% | R+10.76% | 33.66% | 40.04% | R+6.38% | D+4.38% | ||
| Orange | 40,42,44,46,47,48 | 30.07% | 47.9% | R+17.83% | 31.92% | 43.18% | R+11.26% | D+6.57% | ||
| Placer | 4 | 28.67% | 51.43% | R+22.76% | 28.89% | 48.23% | R+19.34% | D+3.42% | ||
| Plumas | 4 | 33.36% | 43.8% | R+10.44% | 32.37% | 43.16% | R+10.79% | R+0.35% | ||
| Riverside | 41,44,45,49 | 34.42% | 45.7% | R+11.28% | 36.29% | 41.87% | R+5.58% | D+5.70% | ||
| Sacramento | 3,4,5,10 | 42.61% | 34.54% | D+8.07% | 43.93% | 33.76% | D+10.17% | D+2.10% | ||
| San Benito | 17 | 45.05% | 33.86% | D+11.19% | 48.18% | 30.34% | D+17.84% | D+6.65% | ||
| San Bernardino | 25,26,41,42,43 | 37.59% | 42.41% | R+4.82% | 39.01% | 38.46% | D+0.55% | D+5.37% | ||
| San Diego | 49,50,51,52,53 | 34.16% | 39.52% | R+5.36% | 35.92% | 36.27% | R+0.35% | D+5.01% | ||
| San Francisco | 8,12 | 54.43% | 10.92% | D+43.51% | 56.26% | 9.53% | D+46.73% | D+3.22% | ||
| San Joaquin | 11,18 | 42.43% | 40.6% | D+1.83% | 42.66% | 38.96% | D+3.70% | D+1.87% | ||
| San Luis Obispo | 22,23 | 35.08% | 41.84% | R+6.76% | 34.96% | 39.89% | R+4.93% | D+2.83% | ||
| San Mateo | 12,14 | 49.42% | 24.46% | D+24.96% | 51.77% | 20.76% | D+31.01% | D+6.05% | ||
| Santa Barbara | 23,24 | 40.39% | 35.53% | D+4.86% | 42.37% | 32.14% | D+10.23% | D+5.37% | ||
| Santa Clara | 11,14, 15,16 | 44.9% | 26.84% | D+18.06% | 45.88% | 23.89% | D+21.99% | D+3.93% | ||
| Santa Cruz | 14,17 | 53.04% | 20.26% | D+32.78% | 54.83% | 17.72% | D+37.11% | D+4.33% | ||
| Shasta | 2 | 30.11% | 49.18% | R+19.07% | 28.44% | 47.25% | R+18.81% | D+0.26% | ||
| Sierra | 4 | 31.1% | 42.81% | R+11.71% | 29.11% | 42.6% | R+13.49% | R+1.78% | ||
| Siskiyou | 2 | 35.5% | 42.3% | R+6.80% | 33.86% | 40.96% | R+7.10% | R+0.30% | ||
| Solano | 3,7,10 | 48.61% | 29.12% | D+19.49% | 49.53% | 26.16% | D+23.37% | D+3.88% | ||
| Sonoma | 1,6 | 50.17% | 25.71% | D+24.46% | 52.13% | 22.74% | D+29.39% | D+4.93% | ||
| Stanislaus | 18,19 | 40.23% | 42.24% | R+2.01% | 43.38% | 36.78% | D+6.60% | D+8.61% | ||
| Sutter | 2 | 32.26% | 49.51% | R+17.25% | 33.38% | 46.28% | R+12.90% | D+4.35% | ||
| Tehama | 2 | 33.3% | 45.3% | R+12.00% | 31.43% | 44.33% | R+12.90% | D+0.90% | ||
| Trinity | 2 | 35.94% | 39.07% | R+3.13% | 35.46% | 35.54% | R+0.08% | D+3.05% | ||
| Tulare | 21 | 34.25% | 48.03% | R+13.78% | 34.54% | 45.49% | R+10.95% | D+2.83% | ||
| Tuolumne | 19 | 36.27% | 43.73% | R+7.46% | 33.42% | 42.63% | R+9.21% | R+1.75% | ||
| Ventura | 23,24 | 38.07% | 39.83% | R+1.76% | 39.76% | 36.97% | D+2.79% | D+4.55% | ||
| Yolo | 1,2 | 46.17% | 27.53% | D+18.64% | 47.85% | 24.64% | D+23.21% | D+4.57% | ||
| Yuba | 2 | 33.96% | 42.52% | R+8.56% | 33.43% | 40.04% | R+6.61% | D+1.95% |
Some observations:
In 2006 the Dems had a majority of registered voters in 6 counties, the Repubs in 1. In 2010 the numbers are 9 and 0 respectively.
In 2006 there were more Dems than Repubs in 23/58 Counties, in 2010 this has increased to 27/58.
Only 10 counties trended Repub between 2006-2010, 48 trended Dem. Of the 10 counties that trended Repub 7 of them are in the 2nd,3rd or 4th CD’s.
The biggest improvement between 2006 & 2010 came for the Repubs in Imperial at 3.90% and for the Dems it was in Monterey at 10.5%. No less than 24 counties improved for the Dems by more than Imperial did for the Repubs.
Repubs have a more than 10 point registration lead in 17 counties, Dems have the same in 21.
In four counties the voter reg gap is less than 200 voters!
Trinty – 6! (R)
Alpine – 35 (D)
Del Norte – 112 (R)
Fresno – 161 (D)
All of these Counties trended Dem between 2006 & 2010.
So what does this all mean?
As others have discussed at great length the future for the Republicans in California looks bleak. The areas of California that are trending Repub are almost entirely small inland counties with declining or very slowing growing populations. And whilst the Repubs still maintain sizable voter reg buffers in large counties like Orange and Riverside these counties are rapidly blueing.
For us Dems the news is looking great for obvious reasons. I expect by the 2012 General Election that the GOP will comprise less than 30% of registered voters in CA and that the Dems will be at least 45% – a huge 15%+ gap. Currently the respective numbers are 44/31.
Starting today at 9:30AM Pacific, the eight current members of the California Redistricting Commission will choose the six additional members (two of each party group) who will complete the panel. Your mission, should you choose to accept it, is to correctly guess who those six members will be.
The current eight are as follows:
Rose Report (http://rosereport.org/20101118/state-auditor-selects-first-8-members-of-ca-redistricting-commission/)
Democrats:
Cynthia Dai – Female, Asian-American, San Francisco, SF County
Elaine Kuo – Female, Asian-American, Mountain View, Santa Clara County
Jeanne Raya – Female, Latina, San Gabriel, LA County
Republicans:
Vincent Barabba – Male, Anglo, Capitola, Santa Cruz County (former director of U.S. Census Bureau)
Jodie Filkins Webber – Female, Asian-American, Norco, Riverside County
Peter Yao – Male, Asian-American, Claremont, LA County (city councilmember)
Other:
Stanley Forbes – Male, Anglo, Esparto, Yolo County
Connie Galambos Malloy – Female, African-American, Oakland, Alameda County
The lists of remaining members can be found at www.WeDrawtheLines.ca.gov
Here are my picks:
Gil Ontai, Rep, San Diego (only applicant left from San Diego)
Byrd Lochtie Other, Humboldt (only person from North of Sacramento)
Maria Blanco, Dem, Los Angeles (only applicant from LA City)
Teresa Espana, Other, Fresno (Central Valley)
James Vidal, Rep, Riverside
Gabino Aguirre, Dem, Ventura
And having gone through them, I doubt I’ll get more than two of them right. The combination of the leadership strikes and the lottery produced some disproportionalities that I couldn’t figure out how to overcome.
With the midterms only 10 months away it is time now to cast our eyes over the biggest state in the country – California.
How will we fare in 2010?
Below the fold for all the details and hey go check out the 2010 Race Tracker Wiki over at Open Congress for all your House, Senate and Gubernatorial needs.
(Cross posted at Daily Kos, MyDD and Open Left)
All of the doom and gloom amongst naysayers about our chances in this years midterms simply does not tally when we drill down into race by race analysis in California.
For a start I think that all 34 Democratic incumbents are as safe as houses – yep including McNerney in the 11th and Sanchez in the 47th.
So what about all 19 Republican held districts?
Here we go:
CA-02 (Herger) – R+11,
Obama/McCain – 42.7/55
Kerry/Bush – 36.6/62
Voter Reg (D/R)- 10/2006 – 33.12/45.09
Voter Reg (D/R)- 10/2009 – 33.81/43.18
House result 2008 (D/R)- 42.1/57.9
Does anyone think we are going to win a R+11 district next year that we don’t already hold?
We don’t even have a candidate yet.
Enough said.
CA-03 (Lundgren) – R+6,
Obama/McCain – 49.2/48.7 (1592 Votes!)
Kerry/Bush – 40.8/58.2
Voter Reg (D/R)- 10/2006 – 36.14/42.70
Voter Reg (D/R)- 10/2009 – 37.73/39.58
House result 2008 (D/R)- 44/49.5
This one is definitely going to be competitive!
Bera led the COH race as at end of September 585K/446K – an impressive effort indeed. With all other Democratic candidates withdrawing and endorsing him and with a rapidly closing Voter reg gap this district will be the scene of a torrid race. Note also that Obama narrowly carried it.
CA-04 (McClintock) – R+10,
Obama/McCain – 43.9/54
Kerry/Bush – 37.4/61.3
Voter Reg (D/R)- 10/2006 – 30.28/47.86
Voter Reg (D/R)- 10/2009 – 31.14/45.83
House result 2008 (D/R)- 49.7/50.3
Does anyone think we are going to win a R+10 district next year that we don’t already hold? Especially as we don’t have a candidate yet and 2006/8 nominee Charlie Brown is definitely not running.
Enough said.
CA-19 (Radanovich OPEN) – R+9,
Obama/McCain – 46/52.1
Kerry/Bush – 37.9/61.1
Voter Reg (D/R)- 10/2006 – 36.09/46.73
Voter Reg (D/R)- 10/2009 – 37.19/43.62
House result 2008 (D/R)- Unopposed
Our candidates are seriously 2nd tier and need to step up massively if this is to be competitive. Do we have a State Rep who can run?
CA-21 (Nunes) – R+13,
Obama/McCain – 42.1/56.3
Kerry/Bush – 33.7/65.4
Voter Reg (D/R)- 10/2006 – 33.84/49.55
Voter Reg (D/R)- 10/2009 – 34.89/46.76
House result 2008 (D/R)- 31.6/68.4
Does anyone think we are going to win a R+13 district next year that we don’t already hold?
We don’t even have a candidate yet.
Enough said.
CA-22 (McCarthy) – R+16,
Obama/McCain – 38.3/59.7
Kerry/Bush – 31/67.9
Voter Reg (D/R)- 10/2006 – 30.06/51.21
Voter Reg (D/R)- 10/2009 – 31.29/48.31
House result 2008 (D/R)- Unopposed
Does anyone think we are going to win a R+16 district next year that we don’t already hold?
We don’t even have a candidate yet.
Enough said.
CA-24 (Gallegly) – R+4,
Obama/McCain – 50.5/47.7
Kerry/Bush – 43.1/55.7
Voter Reg (D/R)- 10/2006 – 34.15/44.12
Voter Reg (D/R)- 10/2009 – 35.83/41.82
House result 2008 (D/R)- 41.8/58.2
This one should be competitive but one of our candidates needs to put the foot down on the fundraising pedal. Is there a top tier candidate out there?
CA-25 (McKeon) – R+6,
Obama/McCain – 49.4/48.3
Kerry/Bush – 39.9/58.8
Voter Reg (D/R)- 10/2006 – 34.52/43.76
Voter Reg (D/R)- 10/2009 – 37.77/39.29
House result 2008 (D/R)- 42.2/57.8
This one too should be competitive but either Conaway fundraises like crazy or we get a better candidate.
CA-26 (Dreier) – R+3,
Obama/McCain – 51/47
Kerry/Bush – 43.7/55.1
Voter Reg (D/R)- 10/2006 – 33.54/44.42
Voter Reg (D/R)- 10/2009 – 35.67/40.50
House result 2008 (D/R)- 40.4/52.7
On paper this should be right up there but is Warner the guy to do it?
If so better start raising the dough.
CA-40 (Royce) – R+8,
Obama/McCain – 46.6/51.1
Kerry/Bush – 38.4/60.2
Voter Reg (D/R)- 10/2006 – 32.04/46.78
Voter Reg (D/R)- 10/2009 – 33.86/42.75
House result 2008 (D/R) – 37.4/62.6
No Candidate no chance. Simple really. Even with a good candidate it is a tough district.
CA-41 (Lewis) – R+10,
Obama/McCain – 43.7/54.2
Kerry/Bush – 36.9/61.8
Voter Reg (D/R)- 10/2006 – 32.18/47.80
Voter Reg (D/R)- 10/2009 – 34.12/44.20
House result 2008 (D/R)- 38.3/61.7
Does anyone think we are going to win a R+10 district next year that we don’t already hold? Only if Lewis bails out owing to ethical “issues”!
Enough said.
CA-42 (Miller) – R+10,
Obama/McCain – 44.9/53.2
Kerry/Bush – 36.9/62
Voter Reg (D/R)- 10/2006 – 28.88/49.79
Voter Reg (D/R)- 10/2009 – 30.56/46.16
House result 2008 (D/R)- 39.8/60.2
Does anyone think we are going to win a R+10 district next year that we don’t already hold?
Enough said.
CA-44 (Calvert) – R+6,
Obama/McCain – 49.5/48.6 (2532 Votes)
Kerry/Bush – 39.9/59
Voter Reg (D/R)- 10/2006 – 31.98/46.89
Voter Reg (D/R)- 10/2009 – 34.63/46.40
House result 2008 (D/R)- 48.8/51.2
Simple equation here. We have the candidate in Hedrick. If he can lift his fundraising game he may make a real of this. Remember he was the guy who delivered that 2008 result above.
CA-45 (Bono Mack) – R+3,
Obama/McCain – 51.5/46.9
Kerry/Bush – 43.1/56
Voter Reg (D/R)- 10/2006 – 35.85/45.53
Voter Reg (D/R)- 10/2009 – 37.81/42.08
House result 2008 (D/R)- 41.7/58.3
Pougnet is the mayor of Palm Springs and this will be a zinger IMHO. His fundraising is going well (347K COH as at end of September) and he obviously has a very high local profile.
CA-46 (Rohrabacher) – R+6,
Obama/McCain – 47.9/49.8
Kerry/Bush – 41.6/56.9
Voter Reg (D/R)- 10/2006 – 30.49/46.84
Voter Reg (D/R)- 10/2009 – 32.02/43.49
House result 2008 (D/R)- 43.1/52.6
No candidate presently this one is at best a long shot.
CA-48 (Campbell) – R+6,
Obama/McCain – 49.3/48.6 (2479 Votes)
Kerry/Bush – 40.4/58.3
Voter Reg (D/R)- 10/2006 – 27.13/49.32
Voter Reg (D/R)- 10/2009 – 29.40/44.77
House result 2008 (D/R)- 40.6/55.7
An intriguing district. Terribly low % of registered Dems and yet Obama won the district. Krom needs to put the foot down with her fundraising (126K COH as at end of September is not great) to make this an outside chance.
CA-49 (Issa) – R+10,
Obama/McCain – 45.1/53
Kerry/Bush – 36.5/62.5
Voter Reg (D/R)- 10/2006 – 28.50/47.96
Voter Reg (D/R)- 10/2009 – 30.94/43.86
House result 2008 (D/R)- 37.5/58.3
Does anyone think we are going to win a R+10 district next year that we don’t already hold?
Enough said.
CA-50 (Bilbray) – R+3,
Obama/McCain – 51.3/47.1
Kerry/Bush – 43.9/55.2
Voter Reg (D/R)- 10/2006 – 29.62/43.64
Voter Reg (D/R)- 10/2009 – 31.40/40.27
House result 2008 (D/R)- 45.2/50.3
We lost our best candidate here (Roberts), Busby is I think flawed and Emblem has yet to make a splash. And yet Obama won the district.
Either Emblem steps up her fundraising or we get a better candidate IMHO.
CA-52 (Hunter) – R+9,
Obama/McCain – 45/53.4
Kerry/Bush – 37.7/61.4
Voter Reg (D/R)- 10/2006 – 29.87/45.66
Voter Reg (D/R)- 10/2009 – 31.41/42.90
House result 2008 (D/R)- 39/56.4
Does anyone think we are going to win a R+9 district next year that we don’t already hold?
We don’t even have a candidate yet.
Enough said.
So in summary:
Competitive race:
CA-03, CA-45
Competitive if fundraising steps up:
CA-44, CA-48
A chance if the candidate steps up their fundraising or we find a more viable candidate:
CA-24, CA-25, CA-26, CA-50
Long shot:
CA-19, CA-40, CA-46
Forget it:
CA-02, CA-04, CA-21, CA-22, CA-41, CA-42, CA-49, CA-52.
Not bad 2 definitely competitive races and two more that could become so if our candidates step up the fundraising. Another 4 as well that could be competitive in the right circumstances. Not bad in an environment that is supposedly toxic for Democrats.
A last word also on the two supposedly vulnerable Democratic Districts:
CA-11 (McNerney) – R+1,
The GOP lost their best candidate when Del Arroz withdrew. If presumptive frontrunner Grape Grower Brad Goehring makes it out of the torrid Primary (7 candidates and counting) he will still remain a 2nd tier candidate, albeit one that can self fund. McNerney will be waiting with his 675K COH as at end of September. Following from an 11 point victory last year and near parity in voter reg (in 2006 there was a 5% GOP edge) McNerney will be just fine.
CA-47 (Sanchez) – D+4,
Does anybody really think that a D+4 District is going to flip in California next year? The Tran/Pham GOP Primary promises to be a zinger and the winner gets to take on an incumbent who got 69% of the vote last year and has 769K COH as at the end of September as well as a 12% party reg gap.
This one ain’t gonna flip.
What say you?
I’m starting up this series again. I’m going to try to do at least 2 rounds before the 2010 election.
It will be an update of the previous series, which makes it a lot easier, as some things haven’t changed.
Today: California!
Summary: Most CA districts are very safe. All of those that might be in play are in Republican hands, including
CA-03 Lungren (R)
CA-04 McClintock (R)
CA-19 Radonovich (R)
CA-25 McKeon (R)
CA-26 Drier (R)
CA-44 Calvert (R)
I think we might pick up 2 of these.
Sources:
House vote in 2008 from WaPo
VoteView
Race Tracker
Obama vote by CD from Swing State
National Atlas for maps
and my previous diaries.
District: CA-01
Location Northern coast of CA, bordering OR, and going inland to include suburbs of Sacramento map
Representative Mike Thompson (D)
Vote view ranking 154/447 (1 is most liberal, 447 most conservative)
First elected 1998
2008 margin 68-24 over Zane Starkwolf
2006 margin 66-29
2004 margin 67-28 (remainder Green)
Obama margin 2008 66-32
Bush margin 2004 38-60
Current opponents Zane Starkwolf
Demographics 47th lowest percentage Black of any district (1.9% Black)
Assessment Safe
District: CA-02 May retire
Location The 2nd roughly parallels the first, but is inland, but not on the NV border, includes Yreka and Chico map
Representative Wally Herger (R)
Vote view ranking 396/447 (1 is most liberal, 447 most conservative) First elected 1986
2008 margin 57-43 over Jeff Morris
2006 margin 64-32
2004 margin 67-33
Obama margin 2008 43-55
Bush margin 2004 62-37
Current opponents None declared, Morris may run again
Demographics 42nd lowest percentage Black (1.2%); 48th most veterans (15.7%)
Assessment A long shot, whether or not Herger retires.
District: CA-03
Location One of the many oddly shaped CA districts, this one loops around Sacramento, and then runs west to the NV border map
Representative Dan Lungren (R)
Vote view ranking 378/447 (1 is most liberal, 447 most conservative)
First elected 2004
2008 margin 50-44 over Bill Durston
2006 margin 59-38
2004 margin 62-35
Obama margin 2008 49-49
Bush margin 2004 58-41
Current opponents At least 3 confirmed Democrats:
Gary Davis (nice site, needs more info, esp. on issues)
Amrerish Bera (An MD, this site also needs some more info. His parents immigrated …. from where? Where did he go to school? His issue is public health, and he sounds vaguely centrist) and
Bill Slayton (no web site, a utilities executive).
Demographics 49th most veterans (15.7%).
Assessment Lungren has won by a smaller margin each election, and Obama ran even here. Possible. My inclination is for Davis.
District: CA-04
Location North western CA, bordering OR and (mostly) NV map
Representative Tom McClintock (R) May retire
Vote view ranking NA (1 is most liberal, 447 most conservative) NA
First elected 2008
2008 margin 622 votes out of 340,000 cast, over Charlie Brown
2006 margin NA
2004 margin NA
Obama margin 2008 44-54
Bush margin 2004 61-39
Current opponents None declared, Brown may run again.
Demographics 27th most veterans (16.6%)
Assessment This one has been close twice now. McClintock has not declared, wait and see.
District: CA-05
Location Sacramento and some suburbs map
Representative Doris Matsui (D)
Vote view ranking 87/447 (1 is most liberal, 447 most conservative)
First elected 2005
2008 margin 74-21 over Paul Smith
2006 margin 71-24
2004 margin NA
Obama margin 2008 70-28
Bush margin 2004 38-61
Current opponents None declared. Smith may run again.
Demographics One of the few district that has high number of Blacks (14.4%, 106th place), Latinos (20.8%, 75th place), and non-white, non-Black, non-Latinos (21.4%, 13th place). Only 13 districts have more than 10% of each of these groups (the district that is the ‘most’ this way is TX09).
Assessment Safe
District: CA-06
Location Coastal CA north of San Francisco map
Representative Lynn Woolsey (D)
Vote view ranking 3/447 (1 is most liberal, 447 most conservative)
First elected 1992
2008 margin 72-24 over Mike Halliwell
2006 margin 70-26
2004 margin 73-27
Obama margin 2008 76-22
Bush margin 2004 28-70
Current opponents None declared, Halliwell may run again.
Demographics Relatively wealthy (median income = $59K, 43rd place) and very Democratic (Cook PVI D+21, 45th place)
Assessment Safe
District: CA-07
Location Starting NE of San Francisco and continuing NE to Vacaville and east to Pittsburg (no, not the one in PA!) also including El Cerrito and San Pablo map
Representative George Miller (D)
Vote view ranking 6/447 (1 is most liberal, 447 most conservative)
First elected 1974
2008 margin 73-22 over Roger Petersen
2006 margin 84-16 (against a Libertarian)
2004 margin 76-24
Obama margin 2008 72-27
Bush margin 2004 32-67
Current opponents None declared
Demographics 70th fewest Whites (43.2%), with large numbers of Latinos (21.4%, rank = 69), Blacks (16.8%, rank = 95), and others (18.6%, rank = 23)
Assessment Safe
District: CA-08
Location San Francisco map
Representative Nancy Pelosi (D)
Vote view ranking 101/447 (1 is most liberal, 447 most conservative)
First elected 1987
2008 margin 72%, Cindy Sheehan got 16%, Dana Walsh (R) 10%
2006 margin 80-11
2004 margin 83-12
Obama margin 2008 85-12
Bush margin 2004 14-85
Notes on opponents Amazingly, the 2006 opponent raised $150K and got only 19,000 votes. Pelosi hasn’t been under 75% since her first race
Current opponents Dana Walsh is running again.
Demographics Fewer veterans than all but 24 districts (6.8%), and more people who are neither Black, Latino, nor White than all but 14 districts. Also the 18th most Democratic district per Cook PVI
Assessment Vulnerable. Ha! Just seeing if you were paying attention. Safe.
District: CA-09
Location Oakland and Berkeley and some eastern suburbs of San Francisco map
Representative Barbara Lee (D)
Vote view ranking 4/447 (1 is most liberal, 447 most conservative)
First elected 1998
2008 margin 86-10 over Charles Hargrave
2006 margin 86-11
2004 margin 85-12
Obama margin 2008 88-10
Bush margin 2004 13-86
Notes on opponents In 2004, Bermudez raised almost $500K. She got 31,000 votes.
Current opponents None declared.
Demographics Like the 5th, but more so. 35% White (57th lowest), 26% Black (rank = 61), 19% Latino (83rd place), also 15.4% Asian (rank NA). Only 5 districts are more Democratic – and 4 of those are in NY.
Assessment Safe
District: CA-10
Location Eastern suburbs of San Francisco map
Representative None. Ellen Tauscher (D) resigned to take a state job. There will be a special election.
Vote view ranking NA
First elected NA
2008 margin NA
2006 margin NA
2004 margin
Obama margin 2008 66-32
Bush margin 2004 40-59
Notes on opponents The 2004 opponent raised $150K; the 2006 opponent raised $7K. They got the same votes
Current opponents A lot of people in both parties are running, see race tracker wiki.
Demographics The 23rd wealthiest district (median income = $65K), it also has a large number of minorities.
Assessment Safe for whoever the Democrats pick.
District: CA-11
Location Central Valley, east of San Francisco. map
Representative Jerry McNerney Not confirmed
Vote view ranking 156.5/447 (1 is most liberal, 447 most conservative)
First elected 2006
2008 margin 55-45 over Dean Andal
2006 margin 53-47
2004 margin NA
Obama margin 2008 65-33
Bush margin 2004 54-45
Current opponents Jon del Arroz and Brad Goehring.
Demographics Quite similar to the 10th, with a lot of wealth (median income = $62K) and a lot of Latinos (19.7%, rank = 80).
Assessment If McNerny runs, this looks increasily safe.
District: CA-12
Location Southern suburbs of San Francisco. map
Representative Jackie Speier (D)
Vote view ranking 131/447 (1 is most liberal, 447 most conservative)
First elected 2008
2008 margin 75-18 over Greg Conlon
2006 margin NA
2004 margin NA
Obama margin 2008 74-24
Bush margin 2004 27-72
Current opponents None declared.
Demographics 14th wealthiest CD (median income = $70K) with 33.6% people who are neither Black, Latino, nor White (rank = 13); 28.5% Asian.
Assessment Probably safe for Democrats.
District: CA-13
Location The eastern shore of San Francisco Bay. map
Representative Pete Stark (D)
Vote view ranking 1/447 (1 is most liberal, 447 most conservative)
First elected 1972
2008 margin 76-24 over Raymond Chui
2006 margin 75-25
2004 margin 72-24
Obama margin 2008 74-24
Bush margin 2004 28-71
Current opponents None declared
Demographics Quite similar to the 12th
Assessment Safe. Stark is one of the most outspoken liberals in the House. Go Pete! Tell it like it is. Someone has to! VoteView ranks him most progressive of all in the House.
District: CA-14
Location Coastal CA south of San Francisco, including Menlo Park and Palo Alto. map
Representative Anna Eshoo (D)
Vote view ranking 122.5/447 (1 is most liberal, 447 most conservative)
First elected 1992
2008 margin 70-22 over Ronny Santana
2006 margin 71-24
2004 margin 70-27
Obama margin 2008 73-25
Bush margin 2004 33-68
Current opponents None declared
Demographics Third wealthiest district (only NJ11 and VA11 are higher median income), also 17th highest percentage of non-White, non-Black, non-Latinos.
Assessment Safe
District: CA-15
Location A long, narrow district running north-south, from Santa Clara to Gilroy map
Representative Mike Honda (D)
Vote view ranking 8.5/447 (1 is most liberal, 447 most conservative)
First elected 2000
2008 margin 72-20 over Joyce Cordi
2006 margin 72-28
2004 margin 72-28
Obama margin 2008 68-30
Bush margin 2004 36-63
Current opponents None declared, but Honda has a primary challenger: Joe Simitian, now a state senator.
Demographics Another wealthy (median income = $75K) district with lots of minorities (29.2% Asian)
Assessment Safe
District: CA-16
Location San Jose and south of San Jose to San Martin map
Representative Zoe Lofgren (D)
Vote view ranking 77/447 (1 is most liberal, 447 most conservative)
First elected 1994
2008 margin 71-24 over Charel Winston
2006 margin 73-27
2004 margin 71-26
Obama margin 2008 70-29
Bush margin 2004 36-63
Current opponents None declared
Demographics Very similar to the 15th. The 8th most non-Latino, non-Black, non-Whites of any district; 6th most outside Hawaii.
Assessment Safe
District: CA-17
Location Coastal California from Santa Cruz south to Monterrey and beyond map
Representative Sam Farr (D)
Vote view ranking 54/447 (1 is most liberal, 447 most conservative)
First elected 1993
2008 margin 73-27 over Jeff Taylor
2006 margin 76-23
2004 margin 67-29
Obama margin 2008 72-26
Bush margin 2004 33-66
Current opponents None declared.
Demographics The 31st most Latinos of any district (42.9%)
Assessment Safe. Farr has quietly worked on district issues, while being solidly liberal on national ones
District: CA-18
Location Central Valley map
Representative Dennis Cardoza (D)
Vote view ranking 201/447 (1 is most liberal, 447 most conservative)
First elected 2002
2008 margin Unopposed
2006 margin 65-35
2004 margin 68-33
Obama margin 2008 59-39
Bush margin 2004 50-49
Current opponents None declared
Demographics Like the above districts, the 18th has a lot of Latinos (41.9%, 33rd). Unlike them, it is quite poor (median income = $34K, 84th lowest).
Assessment Safe. Cardoza is relatively centrist, and wins easily in this swing district; safer than ever, now, as the 18th has moved more Democratic.
District: CA-19
Location If there is a middle of CA, this is it. map
Representative George Radonovich (R) May retire
Vote view ranking 363.5/447 (1 is most liberal, 447 most conservative)
First elected 1994
2008 margin Unopposed
2006 margin 61-39
2004 margin 66-27
Obama margin 2008 46-52
Bush margin 2004 61-38
Current opponents Les Marsden, a somewhat odd website. Marsden is a professional musician and actor. He seems good on some issues (e.g. he’s for nationalized health care) although he’s centrist on e.g. fiscal policy.
Demographics Another district with lots of Latinos (28.2%, rank = 55)
Assessment If Radanovich retires, Marsden might have a shot.
District: CA-20
Location More of the Central Valley map
Representative Jim Costa (D)
Vote view ranking 201/447 (1 is most liberal, 447 most conservative)
First elected 2004
2008 margin 74-26 over Jim Lopez
2006 margin unopposed
2004 margin 53-47
Obama margin 2008 60-39
Bush margin 2004 48-51
Current opponents Josh Miller, apparently a right wing nut, and conservative Christian, chaired a “Yes on 8” campaign.
Demographics 25th fewest Whites of any district (21.4%), and 13th most Latinos (63.1%)
Assessment A moderate Democrat in an increasingly Democratic district, Costa seems relatively safe, but it bears a little watching.
DONE TO HERE
District: CA-21
Location Porterville and north of Porterville in the Central Valley map
Representative Devin Nunes (R)
Vote view ranking 365/447 (1 is most liberal, 447 most conservative)
First elected 2002
2008 margin 68-32 over Larry Johnson
2006 margin 67-30
2004 margin 73-27
Obama margin 2008 42-56
Bush margin 2004 65-34
Current opponents None declaredhttp://www.opencongress.org/wiki/CA-21
Demographics Similar to the other Central Valley districts
Assessment Long shot
District: CA-22
Location Runs east-west, the southern edge of the Central Valley map
Representative Kevin McCarthy (R)
Vote view ranking 363.5/447 (1 is most liberal, 447 most conservative)
First elected 2006
2008 margin Unopposed
2006 margin 71-29
2004 margin NA
Obama margin 2008 38-60
Bush margin 2004 31-68
Current opponents None declared
Demographics Not unusual on variables I track
Assessment Long shot.
District: CA-23
Location A weird, long, skinny strip along the coast from San Luis Obispo to Oxnard, not really contiguous, plus a couple islands map.
Representative Lois Capps (D) Not confirmed
Vote view ranking 72/447 (1 is most liberal, 447 most conservative)
First elected 1998
2008 margin 68-32 over Matt Kokkonen
2006 margin 65-35
2004 margin 63-34
Obama margin 2008 66-32
Bush margin 2004 40-58
Current opponents None declared.
Demographics Another district with a lot of Latinos (41.7%, rank = 34)
Assessment Safe.
District: CA-24
Location Just interior to most of CA-23 map
Representative Elton Gallegly (R) May retire
Vote view ranking 341/447 (1 is most liberal, 447 most conservative)
First elected 1986
2008 margin 58-42 over Marta Jorgensen
2006 margin 62-38
2004 margin 63-34
Obama margin 2008 51-48
Bush margin 2004 56-43
Current opponents Jill Martinez (ran before, but I can’t find a current website), Shawn Stern, possibly others
Demographics The 35th wealthiest district (median income = $68K).
Assessment Gallegly has had a couple close races (in 2000 and in 1992); Jorgensen didn’t do well in 2008, but this could be close again, whether Gallegly runs or not.
District: CA-25
Location map
Representative Buck McKeon (R) Possibly retiring
Vote view ranking 356/447 (1 is most liberal, 447 most conservative)
First elected 1992
2008 margin 58-42 over Jackie Conaway
2006 margin 60-36
2004 margin 64-36
Obama margin 2008 49-48
Bush margin 2004 59-40
Current opponents Jacquese Conaway is running again, but I can’t find a current website.
Demographics 56th most Latinos (27.1%)
Assessment This is Republican territory, but Obama did win the district.
District: CA-26
Location Northeastern suburbs of Los Angeles, east to Upland and Rancho Cucamunga map
Representative David Dreier (R)
Vote view ranking 366/447 (1 is most liberal, 447 most conservative)
First elected 1980
2008 margin 53-40 over Russ Warner
2006 margin 57-38
2004 margin 54-43
Obama margin 2008 51-47
Bush margin 2004 55-44
Current opponents Russ Warner is running again. This website could use some help.
Demographics A fairly wealthy district (median income = 59K, rank = 44) with a lot of Asians (15.2%)
Assessment Warner lost badly even though Obama took the district, so this doesn’t look too good; still, his name recognition is up, so it’s at least possible.
District: CA-27
Location Shaped like an upside-down U, the middle of the U is CA-28. This is north of Beverly Hills, and includes Northridge and Reseda. map
Representative Brad Sherman (D)
Vote view ranking 112.5/447 (1 is most liberal, 447 most conservative)
First elected 1996
2008 margin 68-25 over Navraj Singh
2006 margin 69-31
2004 margin 62-33
Obama margin 2008 66-32
Bush margin 2004 39-59
Current opponents None declared
Demographics Another district with a lot of Asians (10.5%) and Latinos (36.5%, rank = 38).
Assessment Safe
District: CA-28
Location San Fernando valley, including Van Nuys. The 28th is shaped like an upside-down T map
Representative Howard Berman (D)
Vote view ranking 87/447 (1 is most liberal, 447 most conservative)
First elected 1982
2008 margin Unopposed
2006 margin 74-19
2004 margin 71-23
Obama margin 2008 76-22
Bush margin 2004 28-71
Current opponents None declared.
Demographics Fewer veterans (5.9%) than all but 13 districts. Fewer Whites (31.4%) than all but 47 districts. More Latinos (55.6%) than all but 21.
Assessment Safe
District: CA-29
Location Another oddly shaped district, shaped sort of like a number 7, with two antennae coming out of the top map
Representative Adam Schiff (D)
Vote view ranking 125/447 (1 is most liberal, 447 most conservative)
First elected 2000
2008 margin 69-27 over Charles Hahn
2006 margin 63-27
Obama margin 2008 68-30
2004 margin 65-30
Bush margin 2004 37-61
Current opponents None declared. Hahn will not run.
Demographics More non-White, non-Black, non-Latinos than any but 5 districts (23.7% Asian)
Assessment Safe
District: CA-30
Location Coastal California, Beverly Hills to Malibu map
Representative Henry Waxman
Vote view ranking 57.5/447 (1 is most liberal, 447 most conservative)
First elected 1974
2008 margin Unopposed
2006 margin 71-26
2004 margin 71-29
Obama margin 2008 70-28
Bush margin 2004 33-66
Current opponents None declared, but there is a primary challenge from Tony Dolz, who would be a blue dog, from his website. In fact, he sounds like a Republican, not a Democrat at all.
Demographics Wealthy (median income = 61K, rank = 44), lots of Asians (8.8%), few veterans (8.3%, rank = 41).
Assessment Safe
District: CA-31
Location Yet another oddly shaped district, something like a W on its side, centered on Hollywood map
Representative Xavier Becerra (D) Not declared
Vote view ranking 77/447 (1 is most liberal, 447 most conservative)
First elected 1992
2008 margin Unopposed
2006 margin unopposed
2004 margin 80-20
Obama margin 2008 80-18
Bush margin 2004 22-77
Current opponents None declared
Demographics Fewer veterans than any other district (3.7%), fewer Whites (9.8%) than any except NY16, more Latinos (70.2%) than any but 5 districts. More Democratic (per Cook PVI) than any but 32.
Assessment Safe.
District: CA-32
Location Yes, it’s another oddly shaped district, it’s shaped a little like NY State, in the northeastern suburbs of Los Angeles map.
Representative None (Solis resigned to take a state job)
Vote view ranking NA
First elected 2000
2008 margin NA
2006 margin NA
2004 margin NA
Obama margin 2008 68-30
Bush margin 2004 37-62
Current opponents Lots of candidates.
Demographics Like the 31st, but not quite as extreme.
Assessment Safe for whichever Democrat wins
District: CA-33
Location This one is shaped sort of like a teakettle in Los Angeles. This is one of the smallest districts in the US (just 48 square miles) map
Representative Diane Watson
Vote view ranking 25/447 (1 is most liberal, 447 most conservative)
First elected 2001
2008 margin 87-13 over David Crowley
2006 margin unopposed
2004 margin 89-11 (against a Libertarian)
Obama margin 2008 87-12
Bush margin 2004 16-83
Notes on opponents NA
Current opponents None declared.
Demographics Relatively poor (median income = $32K, 46th lowest), with many minorities (29.9% Black, rank = 37; 34.6% Latino, rank = 33) and very Democratic (Cook PVI = D+36, rank = 7)
Assessment Safe
District: CA-34
Location Los Angeles, centering on Broadway map
Representative Lucille Roybal-Allard (D)
Vote view ranking 87/447 (1 is most liberal, 447 most conservative)
First elected 1992
2008 margin 77-23 over Chris Balding
2006 margin 77-23
2004 margin 74-26
Obama margin 2008 75-23
Bush margin 2004 30-69
Current opponents None declared
Demographics Fewer Whites than any but 3 districts; more Latinos than any but 3 districts (TX15,16 and 28) and lower median income ($30K) than any but 24 districts.
Assessment Safe
District: CA-35
Location Los Angeles, including Gardena, South Central, and Inglewood map
Representative Maxine Waters (D)
Vote view ranking 14/447 (1 is most liberal, 447 most conservative)
First elected 1990
2008 margin 82-14 over Ted Hayes
2006 margin 84-8-8 (against two minor parties)
2004 margin 81-15
Obama margin 2008 84-14
Bush margin 2004 20-79
Current opponents None declared
Demographics 3rd fewest Whites (10.4%), 32nd most Blacks (34.1%) and 26 most Latinos (47.4%)
Assessment Safe
District: CA-36
Location Los Angeles along Santa Monica Bay and the Pacific map
Representative Jane Harman (D)
Vote view ranking 93/447 (1 is most liberal, 447 most conservative)
First elected 2000
2008 margin 68-32 over Brian Gibson
2006 margin 63-32
2004 margin 62-33
Obama margin 2008 64-34
Bush margin 2004 40-59
Current opponents No declared Republicans but she has a primary challenger: Marcy Winograd (no web site yet) who is pledging to be a true progressive. I don’t know if she has a chance, but, in this safe district, a real progressive would be good. Other Democrats may run as well.
Demographics 27th most non-Blacks, non-Whites, non-Latinos
Assessment Safe for any Democrat.
District: CA-37
Location Long Beach map
Representative Laura Richardson (D)
Vote view ranking 93/447 (1 is most liberal, 447 most conservative)
First elected 2007
2008 margin 75-25 over Nick Dibs (Indep), no R.
2006 margin NA (she won her 2007 race 67-25, with almost no one voting – a total of about 21,000 people)
2004 margin NA
Obama margin 2008 80-19
Bush margin 2004 25-74
Current opponents None declared
Demographics Similar to the other Los Angeles districts
Assessment Safe
District: CA-38
Location Another weirdly shaped district, shaped sort of like a 7 on it’s side, with the middle of the 7 in East Los Angeles, then extending south about 8 miles to Norwalk, and east about 20 miles to Pomona map
Representative Grace Napolitano (D)
Vote view ranking 77/447 (1 is most liberal, 447 most conservative)
First elected 1998
2008 margin 82-14 over Chris Agrella (Lib). No R.
2006 margin 75-25
2004 margin Unopposed
Obama margin 2008 71-27
Bush margin 2004 34-65
Current opponents none declared
Demographics Again, similar to those above
Assessment Safe
District: CA-39
Location Horseshoe shaped district including Whittier, Cerritos and Lynwood map
Representative Linda Sanchez (D)
Vote view ranking 119.5/447 (1 is most liberal, 447 most conservative)
First elected 2002
2008 margin 69-31 over Diane Lenning
2006 margin 66-34
2004 margin 61-39
Obama margin 2008 65-32
Bush margin 2004 40-59
Current opponents None declared
Demographics 21st fewest Whites (21%), 18th most Latinos (61.2%), modest income (median = $45K, 153rd place)
Assessment Safe
District: CA-40
Location An inverted horseshoe, it caps CA47 and includes Cypress, Fullerton and Orange map
Representative Ed Royce (R)
Vote view ranking 439.5/447 (1 is most liberal, 447 most conservative)
First elected 1992
2008 margin 63-27 over Christina Avalos
2006 margin 67-31
2004 margin 68-32
Obama margin 2008 47-51
Bush margin 2004 60-39
Current opponents : None declared
Demographics Demographically, hard to distinguish from the Democratic districts in the area
Assessment A long shot.
District: CA-41
Location A wedge shaped district, running east-west. In the west, it includes Redlands, Highland and Yucalpa (the eastern edge of the Los Angeles basin) and runs west through desert to the border of AZ and NV map
Representative Jerry Lewis (R)
Vote view ranking 305/447 (1 is most liberal, 447 most conservative)
First elected 1978
2008 margin 62-38 over Tim Prince
2006 margin 67-33
2004 margin 83-17 (against a Libertarian)
Obama margin 2008 44-54
Bush margin 2004 62-37
Current opponents : None declared.
Demographics Lots of veterans (16.1%, 39th place)
Assessment Long shot.
District: CA-42
Location A funnel shaped district, with the top running from La Habita to Chino, and the point in Mission Viejo map
Representative Gary Miller (R) Not confirmed
Vote view ranking 355/447 (1 is most liberal, 447 most conservative)
First elected 1998
2008 margin 60-40 over Ed Chau
2006 margin unopposed
2004 margin 68-32
Obama margin 2008 45-53
Bush margin 2004 62-37
Current opponents : Michael Williamson, a strange website.
Demographics 13th wealthiest district (median income = $70K), with a large Asian population (15.9%)
Assessment Another Republican district, but Miller may also be a crook: He seems fond of claiming that his land was taken under eminent domain, and thus dodging taxes, and is under FBI investigation. He also uses his staff to run his personal errands…..uh oh…. and now he’s running against a cop.
District: CA-43
Location Runs east-west from Ontario to San Bernadino map
Representative Joe Baca (D)
Vote view ranking 158.5/447 (1 is most liberal, 447 most conservative)
First elected 1999
2008 margin 68-32 over John Roberts
2006 margin 64-36
2004 margin 66-34
Obama margin 2008 68-30
Bush margin 2004 41-58
Current opponents None declared.
Demographics Similar to many of the California districts: Lots of Latinos, few veterans, few Whites.
Assessment Safe for Democrats; Baca is fairly centrist, so the primaries might be worth looking at
District: CA-44
Location runs NE to SW, with the northeasternmost city being Riverside, and the southwesternmost being San Clemente map
Representative Ken Calvert (R)
Vote view ranking 318/447 (1 is most liberal, 447 most conservative)
First elected 1992
2008 margin 52-48 over Bill Hedrick
2006 margin 60-37
2004 margin 62-35
Obama margin 2008 50-49
Bush margin 2004 59-40
Current opponents He has a primary challenger, and then Bill Hedrick is running again. This, to me, is what a “running for congress” site should look like.
Demographics Another district with many Latinos (35.0%)
Assessment A Southern California Republican. Ethical and legal troubles. Calvert also has ties to Duke Cunningham. He was also found in a car with a prostitute, with her head in his lap, and both of them partially unclad. He said they were just talking. hmmmm. Where are his ears? Hedrick looks like a good guy, e.g.
Supports EFCA
Wants Manhattan Project type thing for energy technology
I will fight not only to end our dependence on foreign oil, but also to hold all oil companies accountable for profiteering. I will always put our national security, the needs of our economy, and the interests and health of all Americans before the self-serving interests of oil industry lobbyists.”
District: CA-45
Location A long narrow district running east west near the southern end of CA, from Moreno Valley in the west to the AZ border map
Representative Mary Bono (R)
Vote view ranking 291/447 (1 is most liberal, 447 most conservative)
First elected 1998
2008 margin 57-43 over Julie Bornstein
2006 margin 61-39
2004 margin 67-33
Obama margin 2008 52-47
Bush margin 2004 56-43
Current opponents Steve Pougnet. Too busy, in my opinion, too much motion.
Demographics Also heavily Latino (38.0%, rank = 35)
Assessment Obama won, but Bono won easily, even in 2008.
District: CA-46
Location Coastal CA including Long Beach and Costa Mesa, and some islands map
Representative Dana Rohrabacher (R) Not confirmed
Vote view ranking 416/447 (1 is most liberal, 447 most conservative)
First elected 1988
2008 margin 53-43 over Debbie Cook
2006 margin 60-37
2004 margin 62-33
Obama margin 2008 48-50
Bush margin 2004 57-42
Current opponents No declared Democrats, but he has a primary challenger.
Demographics Another wealthy district (median income = $62K, rank = 34) with a lot of Asians (15.4%)
Assessment Another Southern California Republican with ethics problems – he’s tied to Abramoff. Still, this is a Republican district.
District: CA-47
Location East of the 46th and south of the 40th (both Republican) is the 48th (which is Democratic). It runs north-south, including Anaheim and Santa Ana map
Representative Loretta Sanchez (D)
Vote view ranking 119.5/447 (1 is most liberal, 447 most conservative)
First elected 1996
2008 margin 69-26 over Rosie Avila
2006 margin 62-38
2004 margin 60-40
Obama margin 2008 60-38
Bush margin 2004 50-49
Current opponents Van Tran
Demographics More Latinos (65.3%) than all but 11 districts, also 13.9% Asian. Fewer Whites (17.3%) than all but 10 districts, fewer veterans (5.2%) than all but 9.
Assessment Should be safe
District: CA-48
Location Coastal California from Newport Beach south to Laguna Niguel map
Representative John Campbell (R) Not confirmed
Vote view ranking 435/447 (1 is most liberal, 447 most conservative)
First elected 2005
2008 margin 56-41 over Steve Young
2006 margin 60-37
Obama margin 2008 49-49
2004 margin NA
Bush margin 2004 58-40
Current opponents Beth Krom (another too flashy site, IMHO).
Demographics The 15th wealthiest district (median income = $70K)
Assessment A long shot
District: CA-49
Location A V shaped district, running from Oceanside (on the coast) to Parris and into San Diego county [map
Representative Darrell Issa
Vote view ranking 388/447 (1 is most liberal, 447 most conservative)
First elected 2000
2008 margin 59-37 over Robert Hamilton
2006 margin 63-33
2004 margin 63-35
Obama margin 2008 45-53
Bush margin 2004 63-36
Current opponents None confirmed
Demographics Another heavily Latino district (29.5%, 52nd place)
Assessment Long shot
District: CA-50
Location Coastal California from Carlsbad south to Solana Beach and a little beyond, and inland to Escondido, surrounding San Diego map
Representative Brian Billbray (R) Not confirmed
Vote view ranking 371/447 (1 is most liberal, 447 most conservative)
First elected 2006, but was in House 1994-2000
2008 margin 50-45 over Nick Leibham
2006 margin 53-43
2004 margin NA
Obama margin 2008 51-47
Bush margin 2004 55-44
Current opponents At least 2 Democrats: Francine Busby and Tracey Emblem. Busby lost a squeaker a while back. She’s good. I don’t know much about Emblem, her site is a work in progress.
Demographics Relative wealthy (median income = $59K, 40th place).
Assessment Possible.
District: CA-51
Location The southwest corner of CA, bordering Mexico and AZ map
Representative Bob Filner (D) Not confirmed
Vote view ranking 28.5/447 (1 is most liberal, 447 most conservative)
First elected 1992
2008 margin 72-25 over David Lee Joy
2006 margin 67-30
2004 margin 62-35
Obama margin 2008 63-35
Bush margin 2004 46-53
Current opponents None declared
Demographics 22nd most Latinos (53.2%), 23rd fewest Whites (21.3%)
Assessment Probably safe
District: CA-52
Location An L shaped district, running from the San Diego suburbs east and then north through mountains and desert map
Representative Duncan Hunter (R) retiring
Vote view ranking 342/447 (1 is most liberal, 447 most conservative)
First elected 1980
2008 margin 57-39 over Mike Lumpkin
2006 margin 65-32
2004 margin 69-28
Obama margin 2008 45-53
Bush margin 2004 61-38
Current opponents None declared
Demographics Not unusual on what I track
Assessment Long shot
District: CA-53
Location Central San Diego, and some suburbs map
Representative Susan Davis (D)
Vote view ranking 129.5/447 (1 is most liberal, 447 most conservative)
First elected 2000
2008 margin 68-28 over Michael Crimmins
2006 margin 68-30
Obama margin 2008 68-30
2004 margin 66-29
Bush margin 2004 38-61
Current opponents None declared
Demographics Not unusual on what I track
Assessment Safe
Nervous yet? I know I am. It’s crazy enough having to follow the Presidential Election 24/7. But for me and my friends & family here in California, we have even more on our minds!
We have a Congressional race to win. We have an evil, discriminatory
ballot initiative to defeat. And of course, we have a community, a county, and a country to take back!
Let me tell you about what I did last weekend to make all of this happen.
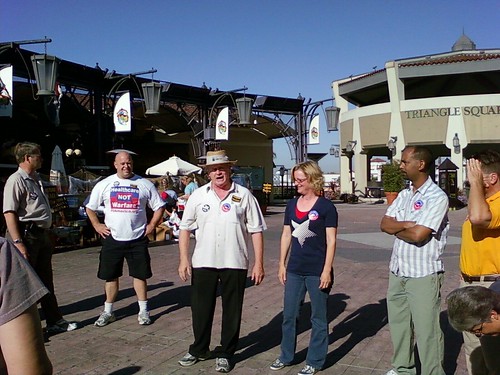
On Saturday, I met with some hard-working union friends in Costa Mesa to walk a neighborhood for Debbie Cook. As always, the pre-walk rally was great! Debbie fired up the crowd as she talked about what she would do to actually serve us in the district. Local labor leaders talked about what we can do to translate enthusiasm for Obama into votes for local Democrats. All in all, I felt quite good about what I was about to do to help Debbie win.
I also felt good about going out and talking to voters about Proposition 8. For all of you unfamiliar with California politics, we often govern by initiative because of our dysfunctional state government. Unfortunately, the radical right has used the initiative process to try to pass horrible legislation that wouldn’t otherwise see the light of day in Sacramento. Prop 8 is one of these horrid radical right power plays that would overturn marriage equality in California and reinstate a Plessy v. Ferguson style segregation that treats gay and lesbian couples as inferior to straight couples. The polls on Prop 8 are close now, so we can’t take anything for granted. That’s why I included Prop 8 in my walk.
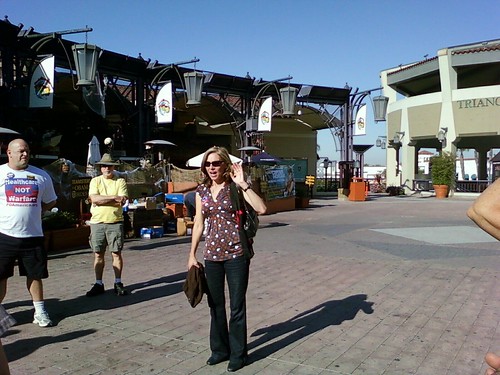
After the rally, I walked with a friend from the local Young Democrats club in a Republican leaning area near the 405 Freeway in Costa Mesa. At first, I was disheartened by all the “Yes on 8” and “McCain-Palin” signs I saw on the street. But as I began talking to the voters on our list, my experience wasn’t so demoralizing. In fact, I found a few undecided Republicans, two houses with Debbie Cook signs up, and a beautiful 90 year old woman who smiled as she told me she was voting for Debbie Cook and against Prop 8! All in all, that’s not so bad for a “Republican stronghold”!
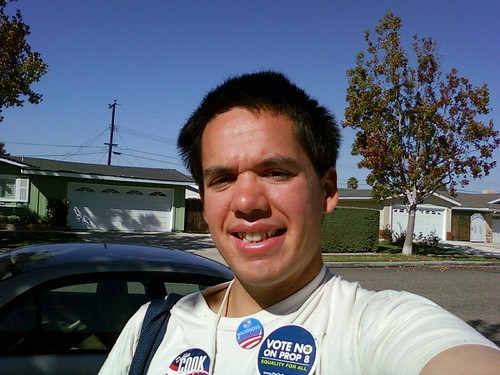
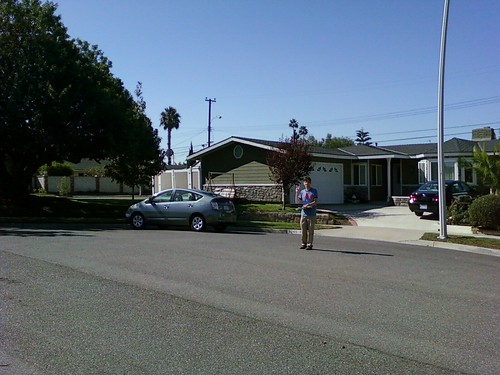
On Sunday, I shifted to the small southwestern portion of Santa Ana that lies in the 46th Congressional District. Specifically, I walked the neighborhood across the street from mine which has sizable Latino and Vietnamese populations. And while this neighborhood is less Republican than the Costa Mesa neighborhood I walked the previous day, I knew it would still be an uphill battle here. So what happened?
I was in for some pleasant surprises! I met a wonderful 80 year old woman who was glad to hear about Debbie Cook and was already voting no on 8. I met a fantastic 60+ couple who have been volunteering for MoveOn.org, so they were very receptive to what I had to say! I found a couple more undecided Republicans and some young voters who appreciated my last minute reminder to vote. So again, the final results weren’t as bad as I had originally expected.
So what does this all mean? Hopefully, this means that we can win if we work for it! Despite all the talk of whether or not Obama will “win by a landslide!”, we can’t be sidetracked into post-election punditry when we still have an election to actually win! And despite all the talk about California being “safe”, it’s NOT! It’s not safe for marriage equality, but on the other hand it’s also not safe for corrupt Republicans.
So what can we do in the next week? We can donate! We can volunteer! We can do all we can in the next week to win and WIN BIG! So don’t just stand there, but go out & help win this election! 😀

(Proudly cross-posted at Clintonistas for Obama)
Ah, how I love me the right-wing blogs! Sometimes, I find it amusing to simply lurk over there and see the vile garbage spew out of their keyboards. But to my surprise, I found out today that some of my recent diaries have been featured on an infamous local right-wing blog.
Apparently, Debbie Cook is foolish for actually talking to voters. I mean, why should she actually take time to talk to voters? “Crazy Dana” Rohrabacher obviously doesn’t. I have yet to see one neighborhood outreach walk, volunteer phone bank, or any other kind of voter outreach activity happening with his campaign.
Well, I guess it’s Crazy Dana’s loss that he doesn’t talk to voters while Debbie Cook does. The more voters here in the 46th District find out about him, the less they like him. And as they learn more about Debbie Cook, the more they like her for her hard work to protect our quality of life as well as her plan to make real change that benefits real people.
OK, so Dana doesn’t want to earn his votes? And he’d rather continue with his extreme right-wing agenda than listen to the more moderate voters in his own district? So be it.
I just hope Dana’s ready to face the consequences. From what I understand, voters don’t like to be ignored. And if Dana keeps ignoring his own voters, he may have a tougher November than what he’s planning for. I just wonder if he & his GOP buddies have actually thought this through.
Whatever. I shouldn’t have to worry about Crazy Dana & his far-right GOP pals. We have enough work to do ensuring that great Democrats like Debbie Cook get elected this fall.
Are you with me? 😉
(Proudly cross-posted at Clintonistas for Obama & The Liberal OC)
In case you missed it, something really frightening is coming to Orange County this week. Believe it or not, The Lord of Darkness (aka Dick Cheney) will be coming to here to raise some money for a good friend of his. He’ll apparently be holding a fundraiser at Richard Nixon’s beloved Casa Pacifica (how fitting!) in San Clemente for CA-44’s own Ken Calvert.
Scared yet? I guess the GOP is. I mean, really… They’re bringing in the only person in DC more unpopular than Dubya himself? And this is supposed to attract big $$$$ for Calvert? Oh my, the GOP is in hard times!
Well, we Democrats need not be. We’re making big gains in the 44th District. The partisan gap is narrowing fast, and we’re blessed to have a terrific candidate in Bill Hedrick. Unlike Calvert, Hedrick isn’t a Bush-Cheney acolyte. And unlike Calvert, Hedrick won’t put personal profit over the best interest of the people of the 44th District.
Calvert may have Bush & Cheney on his side, but Hedrick has us… All of us! Let’s show the GOP big wigs that our people power beats their dirty money.
Are you ready to show Dick Cheney & Ken Calvert what we think of their “heckuva job”?
(Proudly cross-posted at Clintonistas for Obama)
I live in Orange County, CA. I’m used to seeing scary Republicans that care nothing about environmental justice. But of all the crazy Republicans here, none can be crazier than “Crazy Dana” Rohrabacher. He’s consistently voted against the best interests of our people and our planet, and it’s time we do something about this. That’s why I’m so glad to see some good friends of ours take real action for real change.
Follow me after the flip for the details…
Here’s the big announcement from the California League of Conservation Voters (CLCV):
“We’re proud to support Debbie Cook because she has shown time and again her commitment to protecting our coastal resources,” said CLCV’s Southern California Director David Allgood. “Mayor Cook has a long record of achievement on environmental, public health and other issues important to the people of the 46th District.”
Huntington Beach Mayor & Democratic Congressional Candidate Debbie Cook has worked so hard to do so much to protect the California coastal environment. She successfully sued the state Coastal Commission to protect the ecologically sensitive Bolsa Chica Wetlands. She successfully convinced all the Republicans on the Huntington Beach City Council to join with all the Democrats on the council in unanimously agreeing to sign the city onto the US Mayors’ Climate Protection Agreement. And today, she’s working to stop a dangerous desalination plant that would harm the regional coastline while fueling more exurban sprawl.

(photo coutresy LA Times)
Debbie Cook truly is the people’s environmental champion here in Orange County, CA. And if we elect her to Congress, she can be a champion for all of us. So will you please join the League of Conservation Voters in supporting Debbie Cook?
I’ve come to know Debbie Cook pretty well as I’ve helped out with the campaign. She’s the real deal. That’s why she’s earned my full support. I hope she can earn yours as well. 🙂