Who Lost the Money Game But Won the Race?

The Center for Responsive Politics has an extremely interesting post today about how many victors in congressional races outspent the losers. The answer, in case you didn’t guess, is almost all of them (93% in the House).

There were 28 House races where the candidate who spent less money still won the race. (This appears to discount the role of third party expenditures, as you’ll see in the case of LA-06, where the role of Cassidy was to spend little while outside parties poured in the cash. Perhaps a project for a future day will be to add IEs to these numbers and re-order them.) All of the races you will recognize from our competitive House Ratings list. If you want to see the list in its entirety, please click through to their story… but I thought I’d add a wrinkle and rate the races not according to how much was spent but according to the winner/loser ratio. In other words, which victorious candidates won most efficiently? Here are the top 10:

District Winner $$$ Loser $$$ Ratio
GA-13 Scott (D) $842K Honeycutt (R) $4,406K 19.1%
LA-06 Cassidy (R) $620K Cazayoux (D) $2,279K 27.2%
PA-03 Dahlkemper (D) $712K English (R) $1,905K 37.4%
FL-16 Rooney (R) $1,021K Mahoney (D) $2,418K 42.2%
SC-01 Brown (R) $702K Ketner (D) $1,641K 42.8%
NC-08 Kissell (D) $1,100K Hayes (R) $2,509K 43.8%
AL-02 Bright (D) $850K Love (R) $1,929K 44.1%
OR-05 Schrader (D) $1,030K Erickson (R) $2,308K 44.7%
NJ-07 Lance (R) $942K Stender (D) $2,092K 45.0%
VA-02 Nye (D) $733K Drake (R) $1,372K 53.4%

In the Senate, there were only two races where the more frugal candidate won: North Carolina and New Hampshire. New Hampshire was very close (99%), but Kay Hagan won this one on the cheap: $6,014K to Dole’s $15,716K, or 38% (although, again, you should factor in the millions dumped into NC by the DSCC).

One other lesson from this story: self-funding doesn’t work. 49 Congressional candidates spend $500,000 of their own money, and of them, only 6 House candidates and 1 Senate candidate won. Perhaps the saddest case of this was Sandy Treadwell, who ran against Kirsten Gillibrand in NY-20. Treadwell poured in at least $5.9 million of his own money. (Gillibrand spent $3.6 million, but only $250 of that was her own money.) The return on Treadwell’s investment: priceless. If by ‘priceless,’ you mean losing to Gillibrand by a 23-point margin.

Mondale/McCain and Dole/Obama Counties

There’s already been a lot of analysis of the evolving political trends from 2004 to 2008 (including from me, although still nothing beats that widely-circulated New York Times county-change map) based on preliminary election returns. But with the exception of dreaminonempty‘s remarkable and must-see map diary over at Open Left, no one has really focused much on what longer-term trends look like, especially at the county-by-county level.

One question I was left with after this election was what areas have changed so much that they used to stick with the Democrats (or Republicans) even in their absolute darkest hour, but now favor Republicans (or Democrats). The darkest hour for Democrats was a pretty easy choice (Walter Mondale); for Republicans, I was initially thinking of Barry Goldwater, but his pre-Civil Rights Act map is just too different from today’s map to be useful, so I settled for the GOP’s second biggest recent failure, Bob Dole.

As I suspected, Mondale/McCain counties were clustered mostly in the same Appalachian swath where Obama underperformed the most at the statewide level; much of this transition is very recent, as a number of these counties (especially eastern Kentucky and western Pennsylvania) even went for Kerry. There were also some southern counties that are around 50/50 white/black, where enough white voters used to be yellow-dog Dixiecrats to put even Mondale barely over the edge, but collapses in white rural southern voting for Dems at the presidential level has allowed Republicans to take those counties more recently.

To my surprise, there were actually more Mondale/McCain counties than there were Dole/Obama counties. (In case any righties are trolling this article looking for some scraps of solace, there’s your takeaway: OBAMA UNDERPERFORMS MONDALE!!!) There are 97 Mondale/McCain counties, and only 85 Dole/Obama counties (or independent cities).

However, there’s a key difference. While the Mondale/McCain counties are rural and very small (and generally stagnating or getting smaller), the Dole/Obama counties include many of the nation’s largest population centers. The Mondale/McCain counties have a median 2000 population of 16,000, while the Dole/Obama counties have a median population of 103,000. The sum population of all Mondale/McCain counties? 3,197,000. For all Dole/Obama counties: 25,846,000. There’s pretty much the story of the 2008 election right there.

More specifically, there are only five Mondale/McCain counties with a 2000 census population over 100,000. Four are collar counties around Pittsburgh (Beaver, Fayette, Washington, and Westmoreland). These are counties that used to be manufacturing and coal-based union strongholds, hence the willingness to vote Dem even in the face of all that was Mondale. Unfortunately, these counties all share one common thread: little in-migration, and an elderly population aging in place (all of these counties are 17-18% 65+, a rate unseen pretty much anywhere else other than Florida)… and these counties become both smaller and more conservative each year as former unionists die off. (Bear in mind John Murtha’s comments too, as most of these counties are the core of his district.)

The fifth county is Anoka County in the Minneapolis suburbs, where there may have been something of a favorite son effect in 1984, but this is also an area where exurbanification and the mega-church religious right seems to be edging out traditional rural Lutheran Minnesota values (as seen by this county’s choice of congresscritter: Michelle Bachmann).

By contrast, the four largest Dole/Obama counties all have a population over one million: Harris (Houston) and Dallas in Texas, and San Diego and Riverside in California. These are all counties that are young, fast-growing, and most ominously for the GOP, are on the verge of tipping to Hispanic pluralities in the next decade.

Now maybe that can be shrugged off because California and Texas weren’t in play this year, but in the 800,000-1,000,000 population range are a number of swing counties in swing states that basically swung the election: Orange County, Florida (Orlando), Marion County, Indiana (Indianapolis), Hamilton County, Ohio (Cincinnati), and Fairfax County, Virginia (DC suburbs). And below that, fully 43 of the 85 Dole/Obama counties have populations over 100,000. Even the loss of the Pittsburgh-area collar counties can be more than compensated, population-wise, with the four eastern Pennsylvania counties that went Dole/Obama: Berks, Chester, Dauphin, and Monroe.

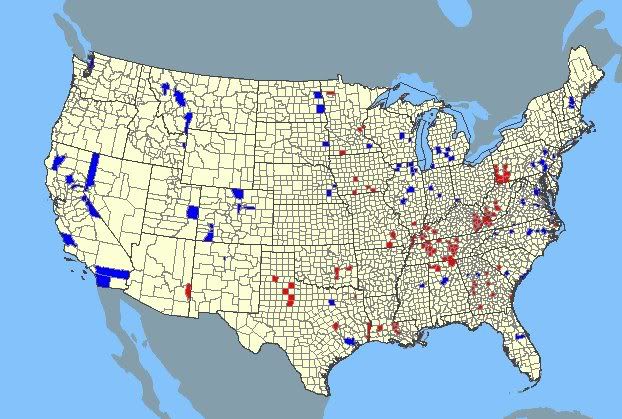
Here’s a map of the Mondale/McCain counties (in red) and the Dole/Obama counties (in blue):

Continue over the flip for full lists of the counties…

Mondale/McCain counties

AL: Colbert, Jackson, Lawrence

AZ: Greenlee

GA: Crawford, Greene, Marion, McIntosh, Mitchell, Taylor, Telfair, Webster, Williamson

IL: Franklin

IA: Dallas, Davis, Monroe, Ringgold

KY: Ballard, Breathitt, Floyd, Harlan, Knott, Letcher, Livingston, Lyon, Magoffin, Marshall, Morgan, Muhlenberg, Perry, Pike, Union, Webster

LA: Allen, Pointe Coupee, West Baton Rouge, West Feliciana

MI: Keweenaw

MN: Anoka, Chisago, Jackson, Pennington

MO: Mississippi, Oregon, Reynolds

NC: Tyrrell

OK: Coal, Haskell, Hughes

PA: Armstrong, Beaver, Fayette, Greene, Lawrence, Washington, Westmoreland

SC: Edgefield

TN: Benton, Cannon, DeKalb, Franklin, Grundy, Henry, Hickman, Humphreys, Lake, Lincoln, Overton, Perry, Robertson, Smith, Stewart, Trousdale, Van Buren, Warren, White

TX: Cottle, Dickens, Fisher, Morris, Newton, Orange, Robertson, Stonewall, Swisher

VA: Buchanan, Dickenson, Russell

WV: Brooke, Clay, Fayette, Hancock, Lincoln, Logan, Mingo, Wyoming

Dole/Obama counties

AL: Jefferson

CA: Alpine, Butte, Mono, Nevada, Riverside, San Diego, San Luis Obispo, Trinity

CO: Arapahoe, Jefferson, La Plata, Larimer, Ouray, San Juan

FL: Orange

GA: Douglas, Newton, Rockdale

ID: Teton

IL: Boone, Carroll, DuPage, Kane, Kendall, McHenry, McLean, Sangamon, Stephenson

IN: Marion, Tippecanoe

MD: Charles

MI: Berrien, Clinton, Eaton, Jackson, Kent, Leelanau

MN: Olmsted

MS: Oktibbeha

MT: Lake, Lewis & Clark, Gallatin

NE: Douglas, Lancaster

NV: Carson City, Washoe

NH: Belknap, Carroll

NJ: Somerset

NM: Los Alamos

NC: Forsyth, Pitt, Wake, Watauga, Wilson

ND: Cass, Grand Forks

OH: Hamilton

PA: Berks, Chester, Dauphin, Monroe

SC: Barnwell, Charleston

SD: Brookings

TX: Dallas, Harris

UT: Grand

VA: Albemarle, Chesapeake, Danville, Fairfax, Fairfax city, Harrisonburg, Henrico, Loudoun, Manassas, Manassas Park, Prince William, Staunton, Winchester

WA: Island

WI: Calumet, Waupaca

Republicans Left in Blue Districts

The 2006 election left a lot of unfinished business: a number of Republicans in Dem-friendly districts who survived strong challenges and got a two-year grace period. The 2008 saw another swath cut through these folks, but there are still some left to be picked off, so this list should give us an idea of where to train our fire in 2010 (and also where to expect retirements). Here are the top 10 most Democratic-leaning districts, rated by current PVI (note that PVIs will change soon, once clearer presidential numbers by district are released) represented by Republicans, before and after this week.

110th Congress Rep. PVI 111th Congress Rep. PVI
DE-AL Castle D+6.5 DE-AL Castle D+6.5
CT-04 Shays D+5.4 NJ-02 LoBiondo D+4.0
NJ-02 LoBiondo D+4.0 IL-10 Kirk D+3.6
IL-10 Kirk D+3.6 WA-08 Reichert (?) D+2.3
NY-25 Walsh D+3.4 PA-06 Gerlach D+2.2
NJ-03 Saxton D+3.3 NY-03 King D+2.1
NM-01 Wilson D+2.4 PA-15 Dent D+1.6
WA-08 Reichert D+2.3 FL-10 Young D+1.1
PA-06 Gerlach D+2.2 IA-04 Latham D+0.4
NY-03 King D+2.1 NY-23 McHugh R+0.2

Note that we’re down to only 9 GOPers left in districts with Dem-leaning PVIs (with the departures of Porter, Fosella, and Knollenberg as well).

Now let’s look at the flipside: Democrats in the darkest red districts. Not as much turnover here, but obviously it suggests Walt Minnick will be our greatest vulnerability for 2010 when he runs against a non-brain-damaged opponent.

110th Congress Rep. PVI 111th Congress Rep. PVI
TX-17 Edwards R+17.7 ID-01 Minnick R+18.9
UT-02 Matheson R+16.9 TX-17 Edwards R+17.7
MS-04 Taylor R+16.3 UT-02 Matheson R+16.9
TX-22 Lampson R+15.7 MS-04 Taylor R+16.3
ND-AL Pomeroy R+13.1 AL-02 Bright R+13.2
MO-04 Skelton R+10.8 ND-AL Pomeroy R+13.1
MS-01 Childers R+10.0 CA-04 Brown (?) R+10.9
SD-AL Herseth R+10.0 MO-04 Skelton R+10.8
IN-08 Ellsworth R+8.5 MS-01 Childers R+10.0
GA-08 Marshall R+8.4 SD-AL Herseth R+10.0

Nancy Boyda was #13 on the old list, and Don Cazayoux was #19. Kratovil and Markey will slot in on the new list at #11 and #13. Also, note that we now hold the 14th (ID-01) and 19th (TX-17) most Republican-leaning districts in the nation. The flipside of that, if you can imagine, would be if the Republicans held IL-02 (Jesse Jackson Jr. at D+34.9) and MA-08 (Capuano at D+33.0).

Post-2008 PVIs (For States)

You may remember back in July I tried to predict how the PVIs of the various states would look after the 2008 election. (PVI is a tool generally applied just to congressional districts, but you can use the formula for any unit of analysis: states, counties, whatever. Click here to learn a bit more about the method of calculating it.) That was quite the exercise in speculation (nevertheless, if you go back to that diary, I was extremely close on many of them… although that speaks more to Nate Silver’s predictive abilities than my own, as I was relying on his mid-July projections for each state, many of which were quite accurate on their own).

Now we have actual state data for the presidential race, so I can return to this topic with more authority. In most people’s minds, this was a sea change election, a total map-changer… but if you look closely at the underlying data and not just the colors on the TV screen, it wasn’t. Most of the states behaved exactly as you’d expect them to, coming in a few points more Democratic in a year where the Democratic candidate performed a few points better than the previous few Democratic candidates. In other words, most states’ boats were lifted the same amount by the one overall rising blue tide.

There were some big shifts and drops, though; where were they? The states where the PVI most notably shifted to the Democrats were Colorado (+3), Hawaii (+6), Indiana (+3), Montana (+4), Nevada (+3), New Mexico (+3), North Dakota (+3), South Dakota (+3), and Vermont (+5). With the exception of Hawaii (favorite son effect) and Vermont (large 2000 Nader effect falling out of the equation), the explanation for these states seems to be a combination of two factors: Obama’s greater appeal (maybe personality-wise more so than policy-wise) to midwestern and western states, and the fact that the Obama campaign actually put a lot of ground game effort into these states instead of treating them as an afterthought. (Like the saying goes, “80% of success is just showing up.”) Interestingly, in July one other state projected to swing big to the left in PVI was Alaska, but that was prior to Palinmania.

States going the other way were Arkansas (+5), Louisiana (+4), Oklahoma (+4), Tennessee (+4), and West Virginia (+3). (A number of northeastern states had a smaller shift, not because they moved to the right, simply because they were already pretty pro-Kerry and thus didn’t move to the left as fast as most other states.) These would tend to suggest that Obama did have at least something of an “Appalachian problem,” or at least that he underperformed notably in the states with a high white evangelical/”American ancestry” population.

State 00-04 PVI 04 results 08 results 04-08 PVI Difference
Alabama R+10 37/62 39/60 R+12 R+2
Alaska R+14 36/61 36/62 R+14 D+0
Arizona R+4 44/55 45/54 R+6 R+2
Arkansas R+3 45/54 39/59 R+8 R+5
California D+6 54/44 61/37 D+8 D+2
Colorado R+3 47/52 53/46 D+0 D+3
Connecticut D+8 54/44 60/39 D+7 R+1
Delaware D+6 53/46 61/38 D+7 D+1
Florida R+1 47/52 51/48 R+1 D+0
Georgia R+7 41/58 47/52 R+6 D+1
Hawaii D+7 54/45 72/27 D+13 D+6
Idaho R+19 30/68 36/62 R+17 D+2
Illinois D+6 55/44 62/37 D+8 D+2
Indiana R+9 39/60 50/49 R+6 D+3
Iowa D+0 49/50 54/45 D+1 D+1
Kansas R+11 37/62 41/57 R+11 D+0
Kentucky R+8 40/60 41/57 R+10 R+2
Louisiana R+5 42/57 40/59 R+9 R+4
Maine D+4 54/45 58/40 D+6 D+2
Maryland D+8 56/43 61/38 D+8 D+0
Massachusetts D+14 62/37 62/36 D+12 R+2
Michigan D+3 51/48 57/41 D+4 D+1
Minnesota D+2 51/48 54/44 D+3 D+1
Mississippi R+9 40/59 43/56 R+9 D+0
Missouri R+2 46/53 49/49 R+3 R+1
Montana R+11 39/59 47/50 R+7 D+4
Nebraska R+15 33/66 41/57 R+13 D+2
Nevada R+1 48/50 55/43 D+2 D+3
New Hampshire D+1 50/49 55/44 D+2 D+1
New Jersey D+6 53/46 57/42 D+5 R+1
New Mexico D+0 49/50 57/42 D+3 D+3
New York D+11 58/40 62/37 D+11 D+0
North Carolina R+6 44/56 50/50 R+4 D+2
North Dakota R+13 36/63 45/53 R+10 D+3
Ohio R+1 49/51 51/47 D+0 D+1
Oklahoma R+13 34/66 34/66 R+17 R+4
Oregon D+2 51/47 55/43 D+3 D+1
Pennsylvania D+2 51/48 55/44 D+3 D+1
Rhode Island D+13 59/39 63/35 D+11 R+2
South Carolina R+8 41/58 45/54 R+7 D+1
South Dakota R+11 38/60 45/53 R+8 D+3
Tennessee R+4 43/57 42/57 R+8 R+4
Texas R+11 38/61 44/56 R+10 D+1
Utah R+22 26/72 34/63 R+20 D+2
Vermont D+8 59/39 67/31 D+13 D+5
Virginia R+4 45/54 52/47 R+2 D+2
Washington D+4 53/46 57/41 D+5 D+1
West Virginia R+4 43/56 43/56 R+7 R+3
Wisconsin D+1 50/49 56/43 D+3 D+2
Wyoming R+19 29/69 33/65 R+19 D+0

Once better county data is available, we’ll be trying to slice and dice this data in all sorts of interesting ways… for instance, trying to calculate PVIs for districts that are made of a lot of counties (but not for ones that are fractions of huge counties, as county data isn’t helpful there).

Swing County Project

Swing State Project is a place for advanced election returns watchers, so here’s a tool for those who want to delve a little more into the nuts and bolts of what’s happening at the county level as swing state returns come trickling in, rather than just relying on the statewide numbers. The focus is on states with competitive senate or governor’s races, but there are also a few presidential swing states thrown in as well. Bookmark it or print it for easy reference tomorrow!

What I’ve done is start with the 2004 presidential numbers and look at all the counties that comprised 1% or more of the state’s votes (so that you aren’t spending your time worrying about 50/50 counties that turn out to only have a few thousand people in them). I’ve added (or subtracted) from those numbers to find where we need to be in each county to get over 50% on a statewide basis (regardless of whether you’re looking at these states in terms of the presidential race or another close statewide race). The assumption is that each states’ counties form a pretty consistent left-to-right spectrum no matter what the race is.

A few caveats: I didn’t want to spend weeks on this project, so these numbers presume essentially the same model as 2004 and push the percentages in exactly the same way in each county. Obviously, there are going to be some differences from that. Take Colorado, for instance. We can probably bank on increased African-American turnout in Denver, and increased young voter turnout in Boulder and Ft. Collins (Larimer County), which may express itself both as a greater Dem percentage gain than other counties and as a higher percentage of the total state tally. We also should factor in that disproportionately more growth in the last four years in Colorado has occurred in red counties (especially booming Douglas and Weld Counties), meaning those counties may also be a higher percentage of the total state… but we should also account for the fact that as suburban ripples spread out into exurban counties, they also tend to get bluer. Unfortunately, you’ll need to put on your political geography expert hats and make any of those mental adjustments yourselves.

Also, for statewide (governor or senator) races, assume that there might be regional concentrations in favor of particular candidates (i.e. the part of the state they’re from and where they know everybody… for example, look for Kay Hagan to overperform in Guilford County or Gordon Smith to overperform in Umatilla County). So what happens tomorrow won’t necessarily mirror my numbers (especially since in many places we’ll be easily exceeding 50%); they aren’t projections as much as just benchmarks on where we need to be at a minimum in order to win.

Colorado

County % of 2004
statewide vote
What we need to
break 50% statewide
2004 Pres.
Statewide 100.0 50/49 47/52
Jefferson 12.7 50/49 47/52
El Paso 11.3 35/64 32/67
Denver 11.2 73/26 70/29
Arapahoe 10.9 50/48 47/51
Boulder 7.5 69/29 66/32
Larimer 6.9 50/49 47/52
Adams 6.4 54/45 51/48
Douglas 5.7 36/64 33/67
Weld 4.2 39/60 36/63
Pueblo 3.2 56/43 53/46
Mesa 2.9 35/64 32/67
La Plata 1.2 56/43 53/46
Broomfield 1.1 50/49 47/52

Much more over the flip…

Florida

County % of 2004
statewide vote
What we need to
break 50% statewide
2004 Pres.
Statewide 100.0 50/49 47/52
Miami-Dade 10.2 56/44 53/47
Broward 9.3 67/32 64/35
Palm Beach 7.2 63/36 60/39
Hillsborough 6.1 49/50 46/53
Pinellas 6.0 53/47 50/50
Orange 5.1 53/47 50/50
Duval 5.0 45/55 42/58
Brevard 3.5 45/55 42/58
Lee 3.2 42/57 39/60
Volusia 3.0 53/46 50/49
Polk 2.8 44/56 41/59
Sarasota 2.6 48/51 45/54
Pasco 2.5 47/51 44/54
Seminole 2.4 44/55 41/58
Manatee 1.9 46/54 43/57
Escambia 1.9 37/62 34/65
Marion 1.8 44/55 41/58
Leon 1.8 65/35 62/38
Collier 1.7 37/62 34/65
Lake 1.6 42/57 39/60
Alachua 1.5 59/40 56/43
St. Lucie 1.3 55/45 52/48
Okaloosa 1.2 25/75 22/78
St. Johns 1.1 34/66 31/69
Osceola 1.1 50/49 47/52
Clay 1.1 26/73 23/76
Hernando 1.1 49/50 46/53
Charlotte 1.0 46/53 43/56

Georgia

County % of 2004
statewide vote
What we need to
break 50% statewide
2004 Pres.
Statewide 100.0 50/49 41/58
Fulton 10.2 68/31 59/40
Cobb 8.5 46/53 37/62
DeKalb 8.4 82/18 73/27
Gwinnett 7.4 42/57 33/66
Chatham 2.8 59/41 50/50
Clayton 2.4 79/20 70/29
Cherokee 2.2 29/70 20/79
Richmond 2.1 66/34 57/43
Henry 1.9 42/58 33/67
Muscogee 1.9 60/39 51/48
Bibb 1.7 60/40 51/49
Forsyth 1.7 25/74 16/83
Fayette 1.6 37/62 28/71
Hall 1.5 30/69 21/78
Columbia 1.4 33/66 24/75
Houston 1.4 42/57 33/66
Coweta 1.3 34/65 25/74
Douglas 1.3 47/52 38/61
Paulding 1.2 32/67 23/76
Clarke 1.1 67/31 58/40
Carroll 1.1 38/61 29/70
Dougherty 1.0 68/32 59/41

Kentucky

County % of 2004
statewide vote
What we need to
break 50% statewide
2004 Pres.
Statewide 100.0 50/50 40/60
Jefferson 18.8 60/39 50/49
Fayette 7.0 56/43 46/53
Kenton 3.7 44/55 34/65
Boone 2.5 37/62 27/72
Daviess 2.3 48/51 38/61
Campbell 2.2 45/54 35/64
Warren 2.2 46/53 36/63
Hardin 2.0 42/58 32/68
Madison 1.7 48/52 38/62
McCracken 1.7 48/51 38/61
Bullitt 1.6 42/58 32/68
Oldham 1.5 40/59 30/69
Pike 1.5 62/37 52/47
Pulaski 1.4 33/67 23/77
Franklin 1.3 58/41 48/51
Laurel 1.2 34/66 24/76
Boyd 1.2 57/43 47/53
Christian 1.1 43/56 33/66
Hopkins 1.0 44/55 34/65
Henderson 1.0 53/46 43/56
Jessamine 1.0 39/60 29/70

Minnesota

(I’m going to try something very different here; I’m going to set the target at 45%, to account for the Barkley effect, assuming he draws equally from both sides and finishes around 10, both of which may be completely wrong on my partl)

County % of 2004
statewide vote
What we need to
break 45% statewide
2004 Pres.
Statewide 100.0 45/42 51/48
Hennepin 22.9 53/33 59/39
Ramsey 9.6 57/30 63/36
Dakota 7.6 42/44 48/50
Anoka 6.2 40/47 46/53
Washington 4.5 42/45 48/51
St. Louis 4.2 59/28 65/34
Stearns 2.7 37/49 43/55
Olmsted 2.5 41/46 47/52
Scott 2.1 34/53 40/59
Wright 2.1 32/55 38/61
Carver 1.6 30/57 36/63
Sherburne 1.5 32/55 38/61
Crow Wing 1.2 36/51 42/57
Blue Earth 1.2 45/42 51/48
Otter Tail 1.1 31/55 37/61
Rice 1.1 47/39 53/45

Mississippi

County % of 2004
statewide vote
What we need to
break 50% statewide
2004 Pres.
Statewide 100.0 50/49 40/59
Hinds 8.0 69/30 59/40
Harrison 5.5 46/53 36/63
Rankin 4.7 30/69 20/79
Jackson 4.4 40/59 30/69
De Soto 4.4 37/62 27/72
Madison 3.3 45/54 35/64
Lee 2.7 43/56 33/66
Lauderdale 2.6 44/55 34/65
Forrest 2.3 48/51 38/61
Jones 2.3 38/62 28/72
Lowndes 2.1 53/46 43/56
Lamar 1.8 29/70 19/80
Warren 1.7 52/48 42/58
Washington 1.7 69/29 59/39
Pearl River 1.7 33/66 23/76
Hancock 1.6 39/60 29/70

(In another example of how the netroots hate the flyover states, I stopped at 1.5% of state vote share in Mississippi. Lots of medium-sized counties there.)

(I’ve left out New Hampshire because it reports by towns rather than by counties, and that would get a little too complicated.)

New Mexico

County % of 2004
statewide vote
What we need to
break 50% statewide
2004 Pres.
Statewide 100.0 50/49 49/50
Bernalillo 34.0 53/46 52/47
Santa Fe 8.8 72/27 71/28
Dona Ana 8.2 52/47 51/48
San Juan 6.0 34/65 33/66
Sandoval 5.9 49/50 48/51
Valencia 3.4 44/55 43/56
Chaves 2.9 32/67 31/68
Otero 2.7 32/67 31/68
McKinley 2.7 64/35 63/36
Eddy 2.7 35/65 34/66
Lea 2.4 21/78 20/79
Rio Arriba 2.0 66/33 65/34
Taos 2.0 75/24 74/25
Curry 1.9 26/74 25/75
Grant 1.8 54/45 53/46
San Miguel 1.6 73/26 72/27
Los Alamos 1.5 48/51 47/52
Lincoln 1.2 32/66 31/67
Socorro 1.0 52/46 51/47
Luna 1.0 45/54 44/55

North Carolina

County % of 2004
statewide vote
What we need to
break 50% statewide
2004 Pres.
Statewide 100.0 50/50 44/56
Wake 10.0 55/45 49/51
Mecklenburg 9.2 58/42 52/48
Guilford 5.7 56/43 50/49
Forsyth 4.0 52/48 46/54
Durham 3.1 74/26 68/32
Buncombe 3.0 55/44 49/50
Cumberland 2.7 54/46 48/52
New Hanover 2.3 50/50 44/56
Orange 1.8 73/26 67/32
Gaston 1.8 38/62 32/68
Union 1.7 35/64 29/70
Cabarrus 1.7 39/61 33/67
Davidson 1.7 35/65 29/71
Catawba 1.7 38/61 32/67
Iredell 1.6 38/62 32/68
Johnston 1.6 38/62 32/68
Alamance 1.5 44/55 38/61
Pitt 1.5 52/47 46/53
Rowan 1.5 38/61 32/67
Randolph 1.5 31/68 25/74
Henderson 1.2 41/59 35/65
Wayne 1.1 44/56 38/62
Moore 1.1 41/58 35/64
Brunswick 1.1 45/54 39/60
Craven 1.1 43/56 37/62
Nash 1.1 48/52 42/58
Rockingham 1.1 45/55 39/61
Onslow 1.1 36/63 30/69
Cleveland 1.1 44/55 38/61

Ohio

County % of 2004
statewide vote
What we need to
break 50% statewide
2004 Pres.
Statewide 100.0 50/50 49/51
Cuyahoga 12.0 68/32 67/33
Franklin 9.3 55/44 54/45
Hamilton 7.5 48/52 47/53
Montgomery 5.0 52/48 51/49
Summit 4.9 58/42 57/43
Lucas 3.9 61/39 60/40
Stark 3.3 52/48 51/49
Butler 3.0 35/65 34/66
Lorain 2.5 57/43 56/44
Mahoning 2.4 64/36 63/37
Lake 2.2 50/50 49/51
Trumbull 1.9 63/37 62/38
Warren 1.7 29/73 28/72
Clermont 1.6 30/70 29/71
Medina 1.5 44/56 43/57
Delaware 1.4 35/65 34/66
Licking 1.4 39/61 38/62
Greene 1.4 40/60 39/61
Portage 1.4 54/45 53/46
Clark 1.2 50/50 49/51
Fairfield 1.2 38/62 37/63
Wood 1.1 47/52 46/53
Richland 1.1 41/59 40/60

Oregon

County % of 2004
statewide vote
What we need to
break 50% statewide
2004 Pres.
Statewide 100.0 50/48 51/47
Multnomah 19.7 71/28 72/27
Washington 12.6 51/47 52/46
Clackamas 10.6 48/51 49/50
Lane 10.1 57/41 58/40
Marion 7.1 43/55 44/54
Jackson 5.6 42/56 43/55
Deschutes 4.0 41/57 42/56
Douglas 3.0 32/66 33/65
Linn 2.8 37/61 38/60
Benton 2.5 57/41 58/40
Josephine 2.3 35/63 36/62
Yamhill 2.3 41/58 42/57
Polk 1.9 43/56 44/55
Coos 1.8 42/56 43/55
Klamath 1.7 25/73 26/72
Umatilla 1.4 33/66 34/65
Columbia 1.4 49/49 50/48
Lincoln 1.3 56/43 57/42
Clatsop 1.1 53/45 54/44

Pennsylvania

County % of 2004
statewide vote
What we need to
break 50% statewide
2004 Pres.
Statewide 100.0 50/49 51/48
Philadelphia 11.7 79/20 80/19
Allegheny 11.2 56/43 57/42
Montgomery 6.9 55/45 56/44
Bucks 5.5 50/49 51/48
Delaware 4.9 56/43 57/42
Chester 4.0 47/53 48/52
Lancaster 3.8 33/67 34/66
York 3.1 35/65 36/64
Westmoreland 3.1 43/57 44/56
Berks 2.9 45/54 46/53
Lehigh 2.5 50/49 51/48
Luzerne 2.4 50/49 51/48
Northampton 2.2 49/50 50/49
Erie 2.2 53/47 54/46
Dauphin 2.1 45/55 46/54
Cumberland 1.8 35/65 36/64
Lackawanna 1.8 55/43 56/42
Washington 1.7 49/51 50/50
Butler 1.5 34/65 35/64
Beaver 1.4 50/49 51/48
Cambria 1.2 48/52 49/51
Schuylkill 1.1 44/56 45/55
Centre 1.1 47/53 48/52
Franklin 1.0 27/72 28/71

Virginia

County % of 2004
statewide vote
What we need to
break 50% statewide
2004 Pres.
Statewide 100.0 50/49 45/54
Fairfax 14.4 58/41 53/46
Virginia Beach city 5.5 45/54 40/59
Chesterfield 4.2 42/58 37/63
Henrico 4.2 51/49 46/54
Prince William 4.1 51/48 46/53
Loudoun 3.4 49/51 44/56
Arlington 3.0 73/26 68/31
Chesapeake city 2.9 47/52 42/57
Richmond city 2.3 75/24 70/29
Norfolk city 2.2 67/32 62/37
Newport News city 2.1 57/42 52/47
Alexandria city 1.9 72/37 67/32
Hampton city 1.7 62/37 57/42
Hanover 1.6 33/66 28/71
Roanoke 1.5 39/60 34/65
Stafford 1.4 42/57 37/62
Spotsylvania 1.4 42/58 37/63
Albemarle 1.4 56/43 51/48
Portsmouth city 1.2 66/34 61/39
Roanoke city 1.1 57/41 52/46
Suffolk city 1.0 52/47 47/52

Washington

County % of 2004
statewide vote
What we need to
break 50% statewide
2004 Pres.
Statewide 100.0 50/49 53/46
King 31.3 62/37 65/34
Pierce 11.0 48/51 51/48
Snohomish 10.3 50/49 53/46
Spokane 7.1 40/58 43/55
Clark 6.0 44/55 47/52
Kitsap 4.1 48/50 51/47
Thurston 3.9 53/46 56/43
Whatcom 3.2 50/48 53/45
Yakima 2.5 36/63 39/60
Benton 2.3 29/69 32/66
Skagit 1.8 45/53 48/50
Cowlitz 1.5 48/51 51/48
Island 1.3 44/54 47/51
Clallam 1.3 43/54 46/51
Lewis 1.1 30/68 33/65
Chelan 1.0 33/66 36/63