Other evidence that Illinois is very swingy: caution needed before we overreach with a 14-4 map

I am as partisan a Democrat as most people on this website.  As an Illinoisan, I am dismayed that my state elected five freshmen Republicans last fall but very grateful (for a whole lot of other reasons besides redistricting) that Governor Quinn just managed to hold on.  Otherwise we would be looking at another “incumbent protection” map, which in a state that just elected five freshmen GOP congressmen last fall, would be tantamount to a GOP gerrymander.

Various would-be mappers such as Silverspring have proposed 14-4 maps that would make Delay and Phil Burton proud.  But many of these maps go by Obama 2008 data, which is a fundamentally flawed data set to be basing districts on in my very educated opinion.  On the surface maps provided by such places as usaelection.org, you can see counties like Kendall and Grundy and Stephenson and McHenry (just to name a few) that wound up in Obama’s column in 2008.  No seasoned Democratic politician in Illinois would ever call these counties that are Democratic by any means.  Perhaps as suburban/exurban areas of McHenry and Kendall start to fill up and become more swingy, those counties might change.

This diary, however, focuses on a slightly different problem with the Obama 2008 data when compared against Kerry 2004 downstate (where it models pretty accurately – I understand the concerns people have about Cook and Dupage which may be a bit bluer now in 2011 but that trend is not noticeable anywhere outside of Chicagoland).  The problem is this: several of the downstate cities that mappers such as myself and Silver Spring and others count on to create as many Democratic-leaning districts as we can, aren’t really all that blue to begin with.  In other cases, such as Decatur and Urbana-Champaign, they are quite blue, but turnout is a problem.  Follow me across the jump where I demonstrate this using a new district I have been creating in most of my maps – a new 13th which disappears in Chicagoland and reappears as a vacant downstate cities seat.

Photobucket

On first glance this district ought to be safely Democratic, even in 2004.  It isn’t entirely so.  Believe it or not, but Bush got 49% of the vote in this district (and the narrow tendrils connecting the various cities together only amount to about 30k residents so that isn’t the problem so much).  The district is good enough for my standards, though, because Obama did get 59%.  By Cook PVI it is a D+4, perhaps not completely safe from a meltdown of 2010 proportions but most Republicans cannot win in districts any more Democratic than this, and other than Tim Johnson, there is no sitting Republican congressman from this area of the state who could have cross-over appeal.  Even then, Tim Johnson is not a Mark Kirk, and it would take a Mark Kirk for the GOP to win this seat.  So I think it is reasonably safe Team Blue, probably as safe as can be drawn in fact.

In most other parts of the country, a 51% Kerry, 59% Obama seat would be considered safely Democratic.  But again, pay attention to that swing.  At 8% it is a bit larger than nationwide if not as extreme as the 10-12% swings found everywhere in Chicagoland.  When one looks at the cities, you see what I am discussing (with the order of the numbers being Dem-Rep):

Peoria: 28,542-18,536 in 2008; 24,795-22,398 in 2004

Danville: about 8,000 – about 4,500 in 2008; about 7,500-about 5,000 in 2004 (Does anybody know where I can find Danville or Vermillion precinct numbers; their elections website is among the most unhelpful I have ever experienced?)  I calculated this by assuming, for the sake of argument, that the out-city areas of Vermillion were equally as red as the out-city areas of Champaign County next door but I could be slightly off in either direction.

Champaign-Urbana: 32,618-13,408 in 2008; 28,814-17,222 in 2004

Bloomington: 17,578-15,167 in 2008; 13,628-17,154 in 2004

Normal: 12,257-9,197 in 2008; 9,555-10,570 in 2004

Springfield: 32,463-24,019 in 2008; 24,650-28,971 in 2004

I am progressing slower than normal with my maps because it has occurred to me that there are really three scenarios that have to be taken into consideration.  Scenario A: a tactically conservative but aggressive in every other sense map that would lock down 13 Kerry districts (Rockford going together with Rock Island; the 14th going into downtown Joliet, etc.).  Scenario B: a more risky 12-4-2 map that would put Joliet in a swing seat as well as Melissa Bean in another one in the north part of Chicagoland.  Scenario C finally would aim for a 12-5-1 which would shore up Melissa Bean while pushing a Kane seat into Rockford, which would then make the downstate cities seat very swingish (voted for Bush 53-47 then flipped to Obama 55-45).

Personally I would opt for Scenario A if I were drawing the map and not try to do a 14-4.  Unfortunately with Citizens United, the money game is even more unstacked in our disfavor.  Our ticket should get a bump with Obama on the top of the ticket, but then what about the remaining four elections in the decade-long period that any map would be operative?  Finally, another reason to be aggressive when possible but tactically conservative, drawing maps more according to Kerry or 2010 congressional data rather than Obama: Illinois is notorious for split-ticket voters.  In the weeds work I have been doing up in Chicago suburbia, I cannot tell you how often a precinct that voted 60-40 for Obama voted also in the same election for Biggert or Roskam.  And that was in 2008!  Chicago suburbia is full of independents and moderates.  

That being said, it is possible to draw 13 Kerry seats to only 5 Bush seats, and if 13-5 were achieved in 2012, that would still mean -6 GOP, +5 Dem.  That is nothing to snuff at.

The Seven States of New York (Maximizing Democrats)

Previously, I did a hypothetical exercise in which I turned California into a Democratic gerrymander of five states (four of them were basically guaranteed to be Democratic under nearly all circumstances and one Democratic leaning, but not completely safe, state. The state that I really wanted to do though was New York, especially New York City (in fact, my original idea was to simply make states out of the city and the rest of New York could just be its own state, but I decided that with some creativity, it's possible to play around with the rest of the state and still give the Democrats an edge over the Republicans. Some accomodations are necessary in order to create some of these states, and that'll be apparant when they're viewed, but rather than try to explain here, I'll just let the maps do the talking:


Ok, with the maps out of the way, here come the explanations:


State 1 (New Island) (Blue)

Population: 4,191,074
Demographics: White 56%, Black 16%, Hispanic 23%, Asian 3%
Partisanship: Obama 62%, McCain 38%
Areas: Bronx, Nassau, Suffolk

Notes: Originally, my plan was to combine the Bronx with Staten Island, which would make for some poetic justice for the Bastard Child of New York City (my grandpa was born in Staten Island, so I'm allowed have a little fun at SI's expense :P). Unfortunately, a friend of mine reminded me that the Bronx has both serious corruption issues, and that the voters there are less progressive than their substantial Democratic lean would suggest (see Pedro Espada and Ruben Diaz for more on the problems with the Bronx). His suggest was that I combine the Bronx with Manhattan or with Weschester County, but I ultimately decided that would be a huge waste of Democratic votes, so I made my choice to combine the Bronx with the Long Island counties of Nassau and Suffolk. This change turns the swingy Long Island into a reliably Democratic state without giving the Bronx too much statewide influence.


State 2 (New New York) (Green)

Population: 2,151,335
Demographics: White 52%, Black 14%, Hispanic 24%, Asian 8%
Partisanship: Obama 78% McCain 21%
Areas: Staten Island, Manhattan

Notes:  Alright, as I said earlier, my original plan was to combine Staten Island with the Bronx, but it didn't work out, so I had to decide what to do with it, and the solution was to throw it in with Manhattan. Staten Island's population base is largely ethnic Italians, which also makes it relatively conservative and Republican, so naturally the best thing to do with them is to throw them in with among the most (if not the most) liberal counties in the country. This isn't horribly bad though, as the two boroughs combined are only a little bit little bit less populous than neighboring Queens. By the way, yes, the name is a shout-out to Futurama.


State 3 (New Brooklyn) (Purple)

Population: 2,589,378
Demographics: White 35%, Black 34%, Hispanic 20%, Asian 8%
Partisanship: Obama 80%, McCain 20%
Areas: Brooklyn

Notes: All I did was make Kings County into its own state. Its wikipedia page should suffice to explain my father's new birth state.


State 4 (New Queens) (Red)

Population: 2,319,060
Demographics: White 33%, Black 19%, Hispanic 25%, Asian 18%
Partisanship: Obama 75%, McCain 24%
Areas: Queens

Notes: This state is the entirety of Queens and nothing more, so I'll just give the wikipedia page for more information


State 5 (New Amsterdam) (Yellow)

Population: 1,828,601
Demographics: White 70%, Black 11%, Hispanic 13%, Asian 4%
Partisanship: Obama 58%, McCain 41%
Areas: Westchester

Notes: This is the first state that is completely outside of the borders of New York City, and the first one that did not go at least 20 points for Obama, the county is half Westchester, and half from the more Republican lower upstate counties (which is what bring down Obama's numbers, while helping to prop up his numbers at a couple of other places. Now, this does means that in a really really bad year, this state could be prone to some close calls for the Democrats, but still it's Democratic enough that I'm not horribly worried about it.


State 6 (New Albany) (Blue-Green)

Population: 4,514,692
Demographics: White 85%, Black 8%, Hispanic 3%, Asian 2%
Partisanship: Obama 57%, McCain 41%
Areas: Albany, Rochester, Buffalo

Notes: I'm sure I don't need to say just how atrocious this district is, but you know something, I'm ok with that, especially given some of the most egregious historical state gerrymanders (I'm looking at you North and South Dakota…) This state basically absorbs all of the major cities in the upstate area while taking pains to keep out the more heavily Republican parts of the state. This is the most populous of the new states, which it must be to keep it as Democratic as it is (without having to send tentacles into the city). I was originally planning to divide upstate into east and west, with one state (east) having a slight (but not very pronounced) Democratic lean, while the other half (the west) would be a pure toss-up state, but it would subject the new states to crazy swings based on the environment (even moderately bad cycles could be enough to give the Republicans 3 of 4 of the two states' senate seats), so I just decided to create a more strongly Democratic state at the cost of conceding a state to the Republicans, which leads us to…


State 7 (New Farmland) (Grey)

Population: 2,011,300
Demographics: White 95%, Black 3%, Hispanic 3%, Asian 1%
Partisanship: Obama 47% McCain 51%
Areas: Rural upstate New York

Notes: Once you take the cities of Albany, Rochester and Buffalo (not to mention places like Utica) away, upstate New York becomes quite Republican by northeast standards (although certainly more moderate). The Republicans should be able to hold this area for the short-term, though if the Republicans don't moderate themselves, they'll probably find this state will turn on them.

By what margin will Bob Shamansky win?

View Results

Loading ... Loading ...

Redistricting Upstate New York

I made this map assuming New York will lose one seat, all incumbents will win in 2010 and Republicans will hold NY-23. I chose to assume Republicans would hold the 23rd district because it seemed easier to redistrict out the 23rd district than the 26th.  

Image Hosted by ImageShack.us

Image Hosted by ImageShack.us

Image Hosted by ImageShack.us

Image Hosted by ImageShack.us

Image Hosted by ImageShack.us

NY-19 Hall Obama McCain Total
Current 19th 50.7% 46.2%  
Saratoga County 2151 1987 4217
Washington County 12741 12533 25714
Rensselaer County 39753 32840 73976
Columbia County 17556 13337 31403
Dutchess County 71060 59628 132246
Putnam County 21613 25145 47206
Total 164874 145470 314762
New 19th 52.4% 46.2%  

With slow population growth and redistricting out the 23rd district, districts had to move East and North. Since I started in the West and making it more Democratic Hall’s district changed a lot but Dutchess and Putnam Counties account for over 50% of the district which are in his district now.

NY-20 Murphy vs Scozzafava Obama McCain Total
Current 20th 50.7% 47.7%  
St Lawrence County 23706 16956 41223
Franklin County 10571 6676 17495
Clinton County 20216 12579 33312
Essex County 10390 7913 18590
Warren County 16281 15429 32206
Schenectady County 38611 29758 69765
Saratoga County 54494 50868 107008
Total 174269 140179 319599
New 20th 54.5% 43.9%  

The 20th’s new Make up is 40.9% from the old 20th, 37.7% from the old 23rd, and 21.4% from the old 21st. Every county voted for Obama.

NY-21 Tonko Obama McCain Total
Current 21st 58.1% 40%  
Lewis County 4986 5969 11129
Jefferson County 18166 20219 38847
Herkimer County 12904 14619 27176
Hamilton County 1225 2141 3408
Fulton County 9695 11709 21800
Montgomery County 9080 10711 20168
Ostego County 13570 12026 26094
Schoharie County 6009 8071 14381
Albany County 93937 50586 147110
Total 168762 136051 310113
New 21st 54.4% 43.9%  

Pickes up area from the old 23rd and 24th to the North and West becomes less Democratic. Albany County makes up about half of the district.

NY-22 Hinchey Obama McCain Total
Current 22nd 59.2% 39.3%  
Delaware County 9462 10524 20384
Greene County 9850 12059 22287
Sullivan County 16850 13900 31153
Ulster County 52539 32527 86461
Orange County 69913 60951 132233
Total 158614 129961 292518
New 22nd 54.2% 44.4%  

Becomes more compact and less Democratic by losing its finger that goes through Binghamton and to Tompkins County.

NY-23 Massa Obama McCain Total
Current 29th 48.2% 50.5%  
Monroe County 101751 82413 186379
Ontario County 17431 15978 33816
Wayne County 9803 13009 23150
Yates County 4890 5269 10264
Seneca County 7422 7038 14725
Schuyler County 3933 4542 8600
Chemung County 18888 19364 38693
Tioga County 10172 12536 23085
Steuben County* 5951* 8398* 14535*
Total 180241 168547 353247
New 23rd 51% 47.7%  

The numbers for the 23rd and 26th are not exact numbers because I could not find political data for Steuben County so I split up the numbers based on population. I would assume Corning is less repulbican than Steuben County on a whole, but since I dont know the area and couldnt find information on it I just split Steuben up evenly.

The 23rd picks up more of the Rochester exurbs and loses its strong republican areas in the Southwest. Monroe County now makes up about half of the district.

NY-24 Arcuri Obama McCain Total
Current 24th 50.3% 48%  
Cayuga County 16536 13398 30463
Cortland County 11861 9678 21897
Broome County 47204 40077 88707
Chenango County 10100 10337 20847
Madison County 14692 14434 29774
Oneida County 32627 34555 68237
Tompkins County 29826 11927 42472
Total 162846 134406 302397
New 24th 53.9% 44.4%  

After his close call in 2008 making Arcuri’s district safer was one of my main goals. Picks up the rest of Tompkins and Broome Counties making it more Democratic.

NY-25 Maffei Obama McCain Total
Current 25th 55.7% 42.6%  
Wayne County 8381 9230 17829
Onondaga County 129317 84972 218194
Oswego County 24777 23571 49249
Oneida County 10879 14701 26069
Total 173354 132474 311341
New 25th 55.6% 42.5%  

Loses its area in Monroe County and parts of Wayne County. Picks up Oswego County and parts of Oneida County. Stays almost the exact same politicaly.

NY-26 Lee Obama McCain Total
Current 26th 46.4% 52.2%  
Niagara County 26003 27267 54148
Orleans County 1758 2714 4550
Monroe County 12813 15385 28593
Genesee County 10762 15705 26866
Wyoming County 6379 10998 17665
Livingston County 13655 16030 30112
Chatauqua County 29129 28579 58762
Cattaraugus County 14307 17770 32588
Ontario County 7762 9193 17186
Allegany County 7016 11013 18386
Steuben County* 11197* 15805* 27353*
Total 140781 170459 316181
New 26th 44.5% 53.9%  

Lee would now live in the 27th but I assume he would run in the safer 26th. Becomes more republican after losing its areas in Erie County and picking up most of the heavy republican areas from the 23rd.

NY-27 Higgins Obama McCain Total
Current 27th 54.2% 44%  
Erie County 191229 125711 321941
New 27th 59.4% 39%  

Loses Chautauqua County and becomes more Democratic by picking up the rest of Buffalo.

NY-28 Slaughter Obama McCain Total
Current 28th 68.5% 30.3%  
Erie County 65070 53104 119985
Niagara County 21300 19081 41014
Orleans County 4856 6994 12024
Monroe County 92661 46355 140630
Total 183887 125534 313653
New 28th 58.6% 40%  

I kept the general earmuff shape of the district the same to allow the 23rd to pick up more of Monroe County. I also kept it pretty safe considering Slaughter would be 93 on election day 2022 most likely creating an open seat in the next decade. I also drew Slaughter out of her own district but I did it mainly to make it easier to calculate the results it wouldnt much diffrence to draw an finger out to Fairport like there is now.

Trying My Hand at Redistricting: Georgia Democratic Gerrymander Using DRA

My goals going into this were:

1.) To make sure the new district elects a Democrat.
2.) To shore up the three Central/Southern Georgia Democrats (especially Marshall and Barrow), not only for the incumbents but also Democrats in general if and when those seats come open.
3.) To create or expand our bench in our districts.
4.) To fuck with Phil Gingrey and John Linder to the best of my ability.
5.) To try my best not create an ode to the Flying Spaghetti Monster. 

To that end, I think I accomplished these goals.  My maps:
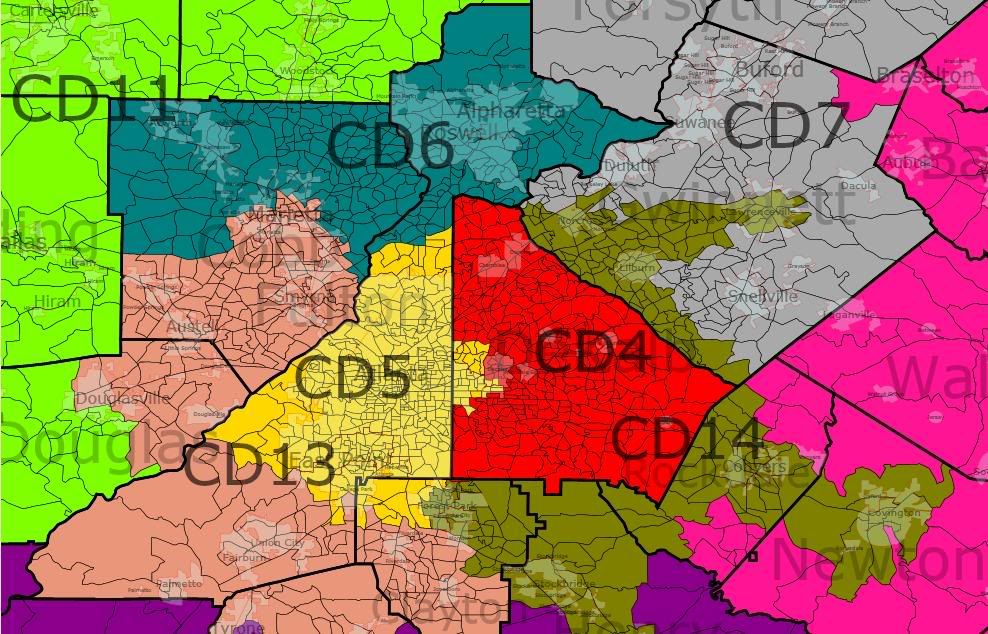


Atlanta Metro Area

1st District (Jack Kingston [R]) BLUE
New Demographics: 71.3% white | 20.8% black | .3% Native American | 1.1% Asian | 5.4% Hispanic | .1% other
Old Demographics: 72.8% white | 21.2% black | .2% Native American | .9% Asian | 3.9% Hispanic | 1% other
Old District: 72.6% white | 22.7% black | .3% Native American | .9% Asian | 4.1% Hispanic | .2% other
I used this as a dumping ground for Republican votes from the 8th and 12th districts while trying to remove Democratic areas for use in those districts.  Kingston gains several Republican counties to the north from the 12th, including much of Effingham County exchange for heavily Democratic Liberty County, some black(er) areas in McIntosh County as well as connectors in Chatham County.  He also picks up much of heavily Republican Laurens County as well as other parts from the 8th.  Surprisingly, the district gets a bit more diverse (and even more surprisingly, from Asians, Hispanics, and Native Americans), but don't hold your breath; it's a very small increase.  Kingston will win in a cakewalk; our bench in the district is non-existent, at least at the state legislature-level.

2nd District (Sanford Bishop [D]) GREEN
New Demographics: 48.4% white | 45.2% black | .3% Native American | .8% Asian | 4.3% Hispanic | 1% other
Old Demographics: 49.7% white | 45.1% black | .3% Native American | .6% Asian | 3.3% Hispanic | .9% other
Old District: 51.4% white | 44.8% black | .3% Native American | .6% Asian | 3.5% Hispanic | .1% other
With some minor scandal involving Bishop and rumors of an adminstration post, I felt the need to shore up his district a bit, considering Bush won it in 2004.  Population loss/stagnation and losses of area to the 8th necessitated moving the district northward, taking up more of Columbus, as well as extending up to take on the swingy Meriwether County plus the heavily black parts of Troup County in and around LaGrange.  Essentially, I added state Rep. Carl von Epps' district.  This also helped offset the addition of very Republican Colquitt County.  The district goes from majority white to plurality white and is trending even more minority.  Bishop should have no trouble and his successor should be in a relatively good position. 

3rd District (Lynn Westmoreland [R]) PLUM
New Demographics: 71.3% white | 20.8% black | .3% Native American | 1.1% Asian | 5.4% Hispanic | .1% other
Old Demographics: 79% white | 16.6% black | .3% Native American | 1.1% Asian | 2% Hispanic | 1% other
Old District: 72.6% white | 22.7% black | .3% Native American | .9% Asian | 4.1% Hispanic | .2% other
The 3rd loses more of Muscogee County /Columbus to the 2nd and some of its Metro Atlanta area but now goes to the Macon area, making it more of a Central Georgia district.  Other than the peninsulas from the 2nd district, it's actually more compact than before. This area has diversified at a pretty good clip, but even running 80 MPH takes a long time when you're driving from New York to Los Angeles.  Plus, it's still demographically very similar to Westmoreland's old district.  Looks like we would have to deal with his “uppity” ass for a while.

4th District (Hank Johnson [D]) RED
New Demographics: 29.9% white | 53.4% black | .2% Native American | 4.3% Asian | 10.8% Hispanic | 1.2% other
Old Demographics: 31.3% white | 54.3% black | .2% Native American | 4.1% Asian | 8.1% Hispanic | 2% other
Old District: 35.8% white | 53.5% black | .4% Native American | 4.3% Asian | 8.5% Hispanic | 0% other
I undid the horrendous four-way cracking of DeKalb, replacing it with a two-way split.  The fourth occupies the overwhelming majority of DeKalb, having been moved completely out of Gwinnett and Rockdale Counties and absorbing DeKalb areas from the 5th, 6th, and 13th.  Even though North DeKalb is pretty white, the additions from Central and South DeKalb more than make up for it.  The district gets a little less black but even more minority than before.  Hank Johnson will win easily.

5th District (John Lewis [D]) YELLOW
New Demographics: 29.9% white | 57.9% black | .2% Native American | 2.8% Asian | 8.2% Hispanic | 1% other
Old Demographics: 31.2% | 59.6% black | .2% Native American | 2% Asian | 5.7% Hispanic | 1.3% other
Old District: 37% white | 56.1% black | .2% Native American | 2.2% Asian | 6.1% Hispanic | 0% other

Pretty similar to its current form, especially in Clayton and Fulton Counties.  It's still an Atlanta plus some inner-ring suburbs districts, taking in slighly less of Forest Park and South Fulton but a bit more of unincorporated Clayton and a bit more of Sandy Springs.  The big difference is it being reducing to about 45% of it's DeKalb area, including its portion of Decatur, and is basically left with the DeKalb portion of Atlanta plus some areas northeast of this area.  John Lewis has nothing to worry about.

6th District (Tom Price [R] vs. Phil Gingrey [R]) TEAL
New Demographics: 75.3% white | 9% black | .3% Native American | 6.3% Asian | 7.7% Hispanic | 1.5% other
Old Demographics: 80.6% white | 7.9% black | .2% Native American | 4.3% Asian | 5.1% Hispanic | 1.8% other
Old District: 85.6% white | 7% black | .2% Native American | 4% Asian | 4.5% Hispanic | .1% other
This is one of my “fuck with the Republicans” districts.  Like before, the district includes white, affluent, Republican North Fulton County (including Tom Price's home) and East Cobb (likewise white, affluent, and Republican).  However, instead of going east to take up North DeKalb County and north to pick up Cherokee County, it goes west to take up the northern half of Cobb County.  In the general election, this doesn't mean anything; it's still a heavily white, Republican district in which we have no bench (although there is some diversification and it now includes a major state university).  However, the district now includes Phil Gingrey's home between Kennesaw and Marietta!

7th District (John Linder [R] vs. ?) GRAY
New Demographics: 68.1% white | 10.8% black | .3% Native American | 6.1% Asian | 13.5% Hispanic | 1.2% other
Old Demographics: 79% white | 6.8% black | .2% Native American | 3.9% Asian | 8.7% Hispanic | 1.3% other
Old District: 85.2% white | 7.1% black | .3% Native American | 3.8% Asian | 5.4% Hispanic | .1% other

Same thing with as with the 6th.  Linder loses more of the diverse areas of Gwinnett County to the 14th, as well as the Newton, Walton, and Barrow County portions.  In return, he gains almost all of Forsyth County and the Southern half of Hall County.  Depending on who wins the Republican primary in the current 9th district, this may set up a primary in this new 7th.  Regardless, this will be a Republican seat for the foreseeable future.  However, it's rapidly diversifying with every minority group taking up a larger share than before.  I think Linder's days are numbered.  It may be a fairly big number, but numbered all the same.

8th District (Jim Marshall [D]) PERIWINKLE
New Demographics: 54.2% white | 40% black | .2% Native American | 1.1% Asian | 3.6% Hispanic | 1% other
Old Demographics: 55.6% white | 39.8% black | .2% Native American | .8% Asian | 2.6% Hispanic | 1% other
Old District: 64% white | 32.6% black | .2% Native American | .8% Asian | 2.8% Hispanic | 1.4% other
Basically, I shifted the district southward and worked to make sure it was more favorable on a presidential level in anticipation of Marshall's eventual departure for higher office.  So, this meant I had to cut almost all of Laurens County out of the district.  Marshall won it big, but Obama lost it big, and Marshall performed less strikingly there in the past.  I regrettably had to remove Dem-trending Newton County from the district, but the benefit from having it in the district was outweighed by the cost of having four heavily Republican counties in the district to connect Newton to the rest of the district, especially considering Marshall only barely won Newton and lost it in 2006.  While I was at it, I also cut out the whiter parts of Bibb County.  I also removed the troublesome Colquitt County, home of Saxby Chambliss and added a few blue and purple counties along the boomerang.  I also shifted down to add Valdosta, thus increasing our bench as all four members of the state legislature from this area are Democrats.  I would have liked to have removed the more Republican parts of Houston County, but I don't know where I'd make up the lost population, but, overall, I think I made Marshall's life much easier, as the district has gotten significantly more diverse and more Democratic. Maybe he can suck less.

9th District (?) CYAN
New Demographics: 85.2% white | 3% black | .3% Native American | .8% Asian | 10% Hispanic | .8% other
Old Demographics: 89.9% white | 2.6% black | .3% Native American | .6% Asian | 6.6% Hispanic | .9% other
Old District: 82.5% white | 13.7% black | .3% Native American | 1.2% Asian | 2.6% Hispanic | .1% other
I made this district more rectangular, removing the parts that dip into the Metro Atlanta area (for the past part), giving it Chattooga and the rest of Gordon Counties, and stretching it all the way to the South Carolina border.  So, now it borders four different states.  I don't know who it will be, but this district will elect a Republican.  We have no bench whatsoever, and this would be the whitest district in Georgia.  Not only is it the whitest district, but, despite some diversification, it's also the least diverse; the majority black districts are more diverse. 

10th District (Paul Broun [R]) HOT PINK
New Demographics: 77% white | 16.3% black | .2% Native American | 1.7% Asian | 3.7% Hispanic | 1.1% other
Old Demographics: 79.9% white | 15.4% black | .2% Native American | 1.3% Asian | 2% Hispanic | 1.1% other
Old District: 89.7% white | 3.4% black | .3% Native American | .7% Asian | 9.2% Hispanic | .3% other

Other than having the tentacle from the 12th come in, the new 10th actually has a pretty regular, compact shape compared to its predecessor.  It still has a lot of its area along the South Carolina border, including the white, Republican suburbs of Augusta, but now includes parts of the Atlanta and Macon exurbs.  It's actually ten points less white than before, but means it's now only 77% white.  In other words, don't expect Broun to go anywhere, unless he gets primaried, which may happen now that a lot of his Athens primary base is gone.

11th District (New Seat) [This would be my district, by the way] NEON GREEN
New Demographics: 79.5% white | 11% black | .3% Native American | 1.3% Asian | 6.8% Hispanic | 1.2% other
Old Demographics: 86.1% white | 7.8% black | .2% Native American | .9% Asian | 3.9% Hispanic | 1.1% other
Old District: 64.8% white | 28.5% black | .3% Native American | 1.3% Asian | 7.2% Hispanic | .1% other
The new 11th looks a lot like the old 11th but becomes more exurban and suburban.  It sheds Chattooga County and its portions of Cobb and Gordon Counties for East Douglas County , a sliver of Forsyth County, and Cherokee County.  I fear I may be switching one wingnut for another in redistricting Gingrey out of his district.  We only have one state legislator in the district and he would be an idiot to try for it.  This is a demographically unfriendly district, although there may be some solace to tke from its diversification.  Still, there's a long way to go before this one's demographics are promising.

12th District (John Barrow [D]) POWDER BLUE
New Demographics: 47.4% white | 45.8% black | .2% Native American | 1.6% Asian | 4.2% Hispanic | 1.2% other
Old Demographics: 47.5% white | 44.3% black | .2% Native American | 1.4% Asian | 3.2% Hispanic | 1.3% other
Old District: 50.8% white | 44.5% black | .2% Native American | .8% Asian | 2.7% Hispanic | .1% other
I removed all or parts of some troublesome majority white, Republican counties (Bulloch, Candler, Effingham, Emmanuel, Mongtomgery, Tattnall, Treutlen, and Toombs) leaving only the areas that were more minority and/or necessary to maintain contiguousness.  In their place, I added heavily Democratic Liberty County by wrapping the district around the coastal areas of Chatham County and using water continguousness.  On the northside, I added some more of Augusta, the blacker parts of Green, and readded Clark County,  The district gets a little blacker and a lot of the old, rural white voters are replace with white voters in a college county more apt to not only vote Democratic but to vote for a black Democrat if and when Barrow gets primaried by a black Democrat.  In becoming more Democratic, I was able to free up some smaller counties along the boomerang for Jim Marshall.

13th District (David Scott [D]) SALMON
New Demographics: 36% white | 46.6% black | .3% Native American | 3% Asian | 12.6% Hispanic | 1.6% other
Old Demographics: 47.1% white | 39.6% black | .3% Native American | 2.4% Asian | 8.6% Hispanic | 2% other
Old District: 47% white | 44.1% black | .3% Native American | 5.1% Asian | 10.1% Hispanic | .1% other
The 13th stays the same mostly.  I removed some of Northeast Clayton County and added more of Central Cobb.  I also added some of the relatively more minority areas of North Fayette.  Overall, Scott's district, once plurality white, is now plurality black.  He'll do fine.

14th District (New District) OLIVE
New Demographics: 36.1% white | 36.4% black | .2% Native American | 7.7% Asian | 18.1% Hispanic | 1.5% other
Old Demographics: 54.7% white | 24.4% black | .2% Native American | 6.4% Asian | 12.3% Hispanic | 1.9% other

Last and certainly not least is the new 14th district.  This district wraps around the southeastern quadrant of the middle ring suburbs, taking in the blue and blueing areas, including Morrow, Stockbridge, McDonough, Conyers, Covington, Norcross, Lilburn, and Lawrenceville.  It would be by far Georgia's most diverse district, having the highest numbers of Asians and Hispanics, the second-highest number of “others,” is plurality black, and still has a respectable white population.  As you can see from the demographic trends, this one is getting even more diverse really quick.  This diversity is reflected in the state legislators whose districts are entirely or partially within the district which includes whites, blacks, and Hispanics.  If it doesn't elect a Democrat, then the Democratic Party has fucked up.


It's also interesting to look at the districts with the old numbers and see which areas are growing and which areas are stagnant or losing populations by seeing how under or over populated they are compared to the 2000-14 district average.  Judging from the numbers, the Southern and Central Georgia are rapidly atrophying.  The 2nd would have had 90,888 extra people!  The 1st would have 40,693, the 8th 55,570, and the 12th 67,639.  The third is pretty much stagnant, having just 2,366 extra people.  If this keeps up, I think we may be looking at the elimination of a district in Middle and South Georgia, and I think it would be a Democrat (my guess would be Marshall's district because of its centrality.

So, where are the people going?  To Metro Atlanta.  The 10th is 15,007 below average, much/most of which I suspect to be from the Metro portions of the district. The 5th is 22,014 under the average.  The 13th 26,921 under.  The 11th and 7th are under by over 60,000, 63,039 and 62,317, respectively.  The 14th is a whopping 120,767 under average.  Only the 4th and 6th are above average, to the tune of 36,782 and 11,235, respectively.