Yes, I have created another Democratic gerrymander. I think the redistrictors in Arizona must create competitive districts. I was able to create some competitive ones. My main objectives were to strengthen Gabrielle Giffords, Ann Kirkpatrick and Harry Mitchell. They are all Democrats elected to the U.S House in 2006 and 2008 in districts that McCain won in the single digits. Except maybe for Kirkpatrick, I probably strengthened those Democrats. I was able to weaken John Shadegg enough to attract strong competition. As for the other Republicans, I kept their district safely Republican while creating two new Republican districts. I had to do that because all those Republicans had to go somewhere. It is pretty difficult to aim for a 5-5 or 6-4 Democratic delegation in a state McCain won with 53% of the vote. Now here are the maps.
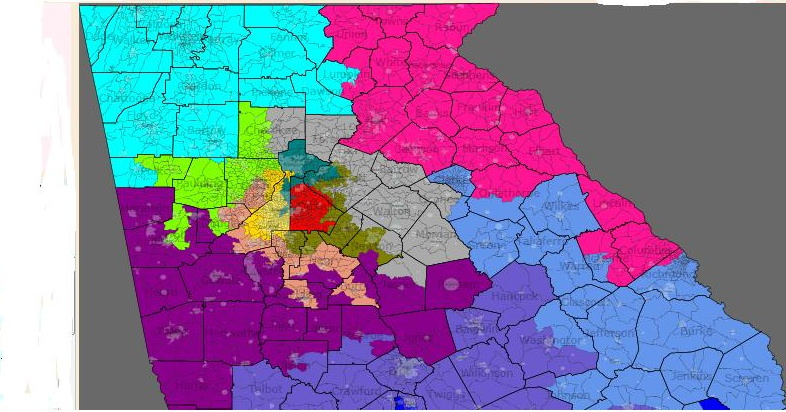
Northern Arizona
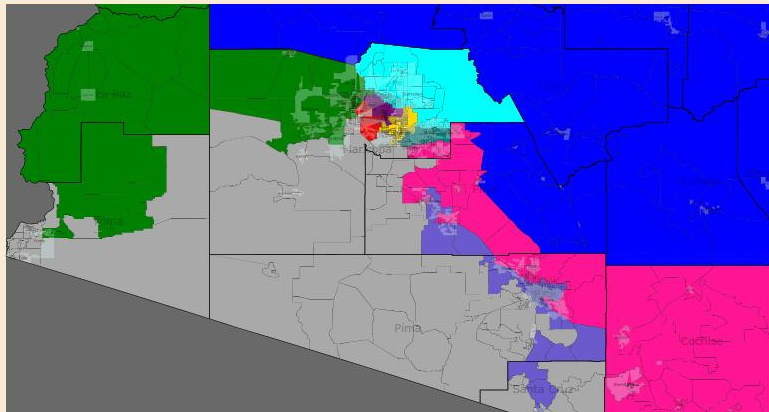
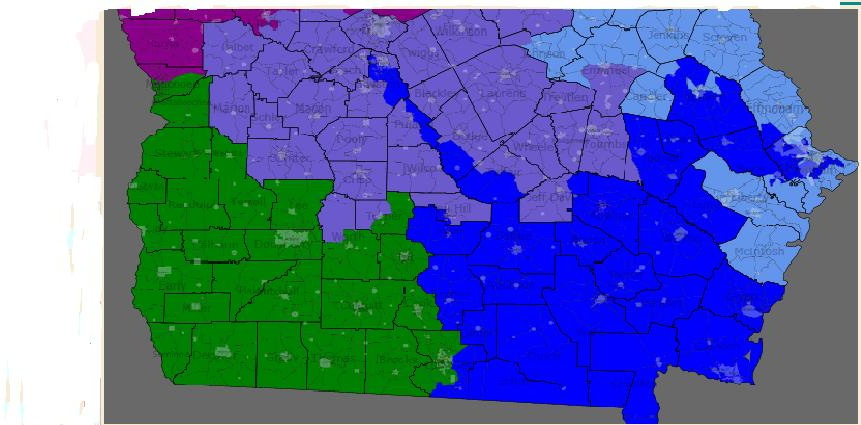
Southern Arizona
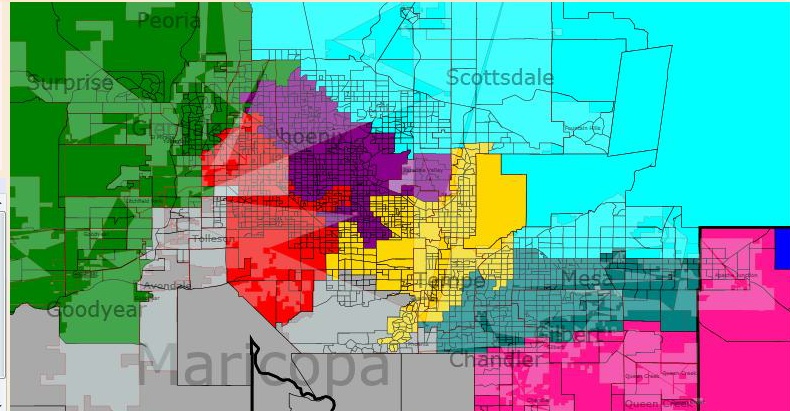
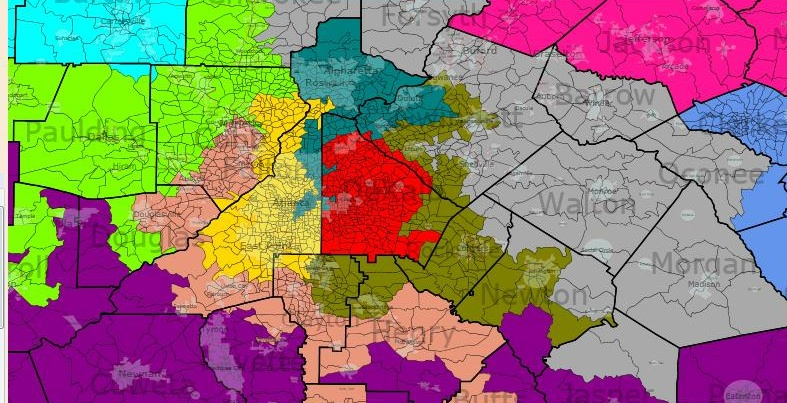
Phoenix area
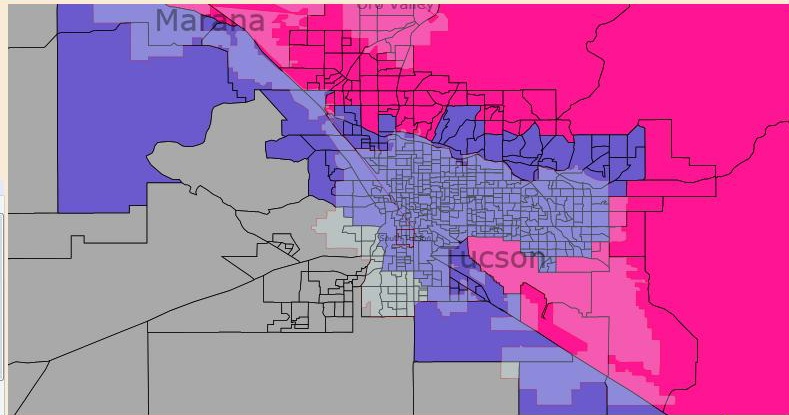
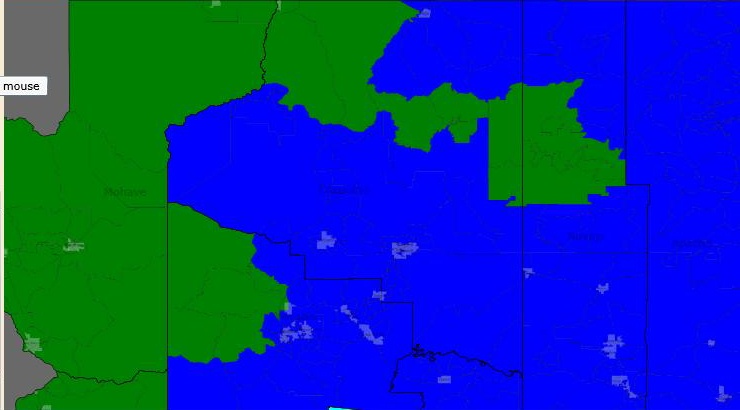
Tucson area
District 1 Ann Kirkpatrick (D) Blue
I am sorry I could not strengthen Kirkpatrick much. The best I could do was to remove only a small slice of Conservative Yavapai County. Also, I wish I could include the Hopi Reservation to allow more Democrats but because of a rivalry with the Navajo, I am unable to put both tribes in the same districts. Except for taking out a bit of Yavapai County, the district pretty much remains the same. Since Kirkpatrick easily won here by 16 points, she should be safe enough. McCain probably won 53% of the vote here. Racial stats are 16% Hispanic, 21% Native American and 60% White. Status is Likely Democratic.
District 2 Trent Franks (R) Green
This district stays pretty much the same except I moved a bit of eastern Glendale and western Phoenix out of the district. I took in some White parts of Yuma County and a bit more of Coconino County which totals to about only 7,000 people. This district probably voted about 60% for McCain. Racial stats are 17% Hispanic and 73% White. Status is Safe Republican.
District 3 John Shadegg (R) Bright Purple
Shadegg should be in for a tough race with this map. I removed the more Conservative northern part of his district. Even though I slipped in part of the current Republican 2nd district, this should not alter the political leanings of this district enough. To weaken Shadegg tremendously, I added in parts of the heavily Hispanic 4th district. This increases the Hispanic population from 14% to 30%. In 2008, Shadegg said he wanted to retire and then retracted the statement. Such a shaky district would probably propel him to retire. With Shadegg gone, this district is a prime pickup for the Democrats. The redistricting panel will like it because it is competitive enough. Obama probably won 51% of the vote here and he certainly would have won more voters if McCain were not from Arizona. The racial stats are 30% Hispanic and 59% White. Status is Toss Up if Shadegg stays, Lean Democrat if he retires.
District 4 Ed Pastor (D) Red
I had to move this district into some Republican areas to strengthen Obama’s performance in other districts. I remember Michael Barone in the Almanac of American Politics 2006 said that Republicans can dominate because they win fast growing areas. Well Michael, did you know that the fastest growing Arizona district is the heavily Hispanic 4th? The growth of Hispanics has been useful in shoring up other districts. Still, Ed Pastor should be fine in this majority Hispanic district. Obama probably won 64% of the vote here. Racial stats are 6% African American, 58% Hispanic and 31% White. Status is Safe Democrat.
District 5 Harry Mitchell (D) Yellow
I removed most of northern Scottsdale from the district and part of Tempe. I substituted that by adding part of the current 4th district to boost the Hispanic population here. Mitchell is in his late 60’s and he may retire soon. This district should be safe for him or any other Democrat who represents it. Minorities should become the majority here in a few years. Obama probably won 54% of the vote here. Racial stats are 5% African American, 34% Hispanic and 53% White. Status is Likely Democrat if Mitchell retires, Safe Democrat while he represents it.
District 6 Jeff Flake (R) Teal
I kept Flake’s district pretty much the way it used to be. I removed all of Pinal County and kept the district centered on Mesa (just for trivia, Mesa is larger than Cleveland, OH but most people in the East have never heard of it.) There are a few Hispanic neighborhoods in Mesa but they should not be nearly enough to offset the Republican majorities in the rest of the city. McCain probably won 60% of the vote here. Racial stats are 23% Hispanic and 68% White. Status is Safe Republican.
District 7 Raul Griljava (D) Gray
This district is about the same except I moved most of the Tucson area and substituted it with heavily Hispanic areas in Phoenix. I took out some Republican areas in Yuma as well as La Paz County. The Pinal County portion stays the same except I added a few Hispanic precincts. Since this district has a Hispanic majority, Griljava should not worry. Obama probably won 55% of the vote here. That should be safe enough. Racial stats are 5% African American, 5% Native American, 54% Hispanic and 34% White. Status is Safe Democrat.
District 8 Gabrielle Giffords (D) Purple
One of my priorities was to protect Giffords from a strong challenge even though she seems pretty safe in her district. To protect her, I removed every inch of Cochise County from this district and replaced it with almost all of Tucson and some Hispanic areas in Pinal County. With Republican battles for the 10th district over in Cochise County, Giffords should have no strong opponent. Obama probably won 54% of the vote here. Racial stats are 35% Hispanic and 55% White. Status is Safe Democrat.
District 9 No Incumbent (R) Light blue
If a Republican does not win here, I am shocked. I removed the whitest areas I could find from the 3rd and 5th districts and slipped in parts of the 6th district due to population growth. It would be great if someone could tell me about state legislators who might run here but former Congressman J.D Hayworth might take a run at this seat. I imagine there will be a big Republican battle for the seat but Democrats will have token opposition. McCain probably received 62% of the vote here. Racial stats are 12% Hispanic (the lowest amount for any of my districts) and 81% White (the highest for any of my districts.) Status is Safe Republican.
District 10 No Incumbent (R) Pink
This district basically takes in Republican parts of the old 8th, 7th and 1st districts. With the more Democratic areas in those districts, the 10th should stay heavily Republican. The only possible problem is growth of Hispanics but that should not be an issue for awhile. The competition in this district will be in the Republican primary. The candidates could be Randy Graf from the southern part of the district or someone from Maricopa/Pinal County. McCain probably won 59%-60% of the vote here. Racial stats are 22% Hispanic and 69% White. Status is Safe Republican.