Maps of Colorado Elections

To follow up the series of posts on Colorado, I’ve posted a few recent presidential elections in the state (courtesy of the New York Times). Each map comes with some brief analysis.

Photobucket

Boosted by a Democratic National Convention held in Denver, Senator Barack Obama wins a thorough victory in the ultimate swing state of 2008. The Democratic candidate does especially well in the Republican-leaning suburbs of Denver – winning several outright and dampening margins in Douglas County and Colorado Springs.

More below.

Photobucket

Written off early as a sure Republican victory, Colorado surprises pundits in 2004 with a surprisingly strong Democratic performance. It is one of the few states where Democrats do better than in 2000 as they pick up the 2000 Ralph Nader vote.

______________________________________________________

Photobucket

Governor George W. Bush performs well throughout the Rocky Mountains in 2000, and Colorado is no exception. With Green Party candidate Ralph Nader pulling off a substantial bloc of liberal voters, Mr. Bush even cracks the Democratic “C” that composes the Democratic base of Colorado.

______________________________________________________

Photobucket

Conservative Colorado returns to form in 1996; President Bill Clinton loses the state by the barest of margins as conservative Ross Perot voters go Republican. Republican Bob Dole wins based off Republican strength in Colorado Springs and rural Colorado.

______________________________________________________

Photobucket

Surprise! – reliably Republican Colorado votes Democratic for the first time in a generation, and for the first time in a competitive race since the days of Harry Truman. To be fair, this map somewhat overstates Democratic strength: Republican margins are dampened by Ross Perot’s strength amongst conservatives.

–Inoljt, http://mypolitikal.com/  

Analyzing Swing States: Colorado, Conclusions

This is the last part of a series of posts analyzing the swing state Colorado.

Conclusions

Colorado is much like the previous state analyzed in this series: Virginia. Both states were seen until recently as Republican strongholds and rightfully so; President George W. Bush handily won both states in 2004 and 2000.

Yet in 2004, both states showed signs of shifting Democratic. Virginia barely moved Democratic even as the South swung heavily against Senator John Kerry. As for Colorado – it actually shifted 3.7% more Democratic, against the national tide. Indeed, in 2004 Mr. Kerry performed better in Colorado than he did in Florida.

More below.

This shift cumulated in the 2008 presidential election, which showed both Colorado and Virginia as influential swing states. Colorado has thus turned from a red state into a purple state. In doing so, the Democratic Party has carved out the following coalition:

Analyzing Swing States: Colorado,Conclusions

Democratic gains since 1992 follow the “C” pattern that was also present in the actual 2008 county results. This is a pattern that is present in other parts of the country, as previous posts have observed. Democrats have generally improved along the Front Range, and especially in the Denver metropolis. They have also gained in two Republican strongholds: Colorado Springs and neighboring Douglas County.

On the other hand, Republicans have gained in several historically Democratic-voting Hispanic counties near Pueblo. They have also improved in the thinly populated rural stretches of east and west Colorado.

All in all, these changes have benefited Democrats more. This is because their gains have been in the more populated areas of Colorado:

Analyzing Swing States: Colorado,Conclusions

The heart of Colorado is therefore in the Denver metropolis, as the map indicates. Since 1992 Democrats have improved in all but one of the orange and red counties. In 2000 Mr. Bush won seven of the eleven highlighted counties. In 2008 Mr. Obama won seven of them. This is responsible for Colorado’s 17.3% leftward shift from 2000 to 2008.

This leftward shift has not turned Colorado into a blue state, but rather into a vitally important swing state. Say, for instance, that Mr. Obama had tied Senator John McCain in the popular vote. North Carolina and Indiana would have immediately flipped Republican. This would be followed by the traditional swing states Florida and then Ohio. Virginia would flip Republican next; Mr. Obama would lose by less than a percent. At this point Mr. McCain would have 262 electoral votes.

And there he would remain. In a tied election, Colorado would go by 1.7% to Mr. Obama, handing the senator 278 electoral votes and the presidency.

In the 2008 presidential election, therefore, Colorado was the most important state to win. It may remain thus in 2012.

–Inoljt, http://mypolitikal.com/

Analyzing Swing States: Colorado, Part 2

This is the second part of a series of posts analyzing the swing state Colorado. It will focus on the Republican base in Colorado. The third part can be found here.

Photobucket

History

Once upon a time, Colorado was a loyally Democratic state. Influenced by prairie populism and anger against powerful Republican businessmen in the East Coast, the state usually voted further left than the country at large. The trend continued for seven straight presidential elections.

More below.

This ended at around 1924. Colorado voted twice against President Franklin Delano Roosevelt, and throughout the remainder of the twentieth century remained a mainstay of Rocky Mountain conservatism. As late as 2005, a Republican politician might have good reason to see this as a permanent condition.

Said politician would have been shocked to see Colorado three years later, after a massive Democratic wave. In 2008, the state voted more Democratic than the national average for the first time in ten presidential elections. And as of September 2010, Attorney General John Suthers is the only statewide Republican officeholder.

Republican Colorado

For a long time, the Republican base in Colorado really was the entire state, minus Denver and a few thinly populated Hispanic counties in the south. Almost all of Colorado voted Republican; there was little that hinted it would ever be more than a solidly Republican state.

That this has changed is fairly obvious; it is why Colorado is now a swing state. The modern Republican base in Colorado consists of two entities. To get a look at the first, let’s take a look at the counties which gave Senator John McCain his strongest support.

Photobucket

The counties highlighted in red are quite representative of the first part of the Republican base: rural Colorado. This description must be qualified a bit further, since some parts of rural Colorado vote fairly Democratic. The first part of Republican Colorado actually constitutes white rural Colorado, minus those parts whose main industry consists of skiing resorts (Hispanic rural Colorado is fairly Democratic, as are the parts of rural Colorado home to massive skiing resorts).

This region has quite a lot in common with other Republican-voting rural counties in the Great Plains and Mountain West. The people are generally white and poorer than the national median. They have been also voting Republican ever since the days of President Woodrow Wilson. Democrats often bemoan the loss of poor whites in places like West Virginia who once voted faithfully Democratic. But in much of rural Colorado, the white working class was never Democratic in the first place.

There is one last distinguishing characteristic of this region: it is extremely thinly populated. Indeed, in 2008 a total of 28,159 votes were cast in the highlighted counties above – about 1.2% of Colorado’s total electorate.

Thus, Republican strength in rural Colorado is a secondary force the Republican coalition:

Photobucket

(Note: Edited NYT Image.)

The second wing of Colorado’s Republican base is different. As the above map indicates, it can be seen in the Republican margins in the counties radiating around Denver, and especially in Colorado Springs.

These suburbs and exurbs constitute the second part of the Republican base in Colorado. Like most suburbs, they are generally wealthy, well-off places. Another distinguishing factor of Republican-leaning suburbs is their ethnicity: the reddest Republican suburbs tend to be the whitest.

Colorado Springs provides of typical example what makes a Republican suburb in Colorado. The largest red circle in the map, the city is famous as being the headquarters of a number of evangelical groups (such as James Dobson’s Focus on the Family). It also contains a substantial military population, which generally votes Republican.

The map above provides an example of Republican Colorado at a strong point. In 2000 neither party competed for Colorado, and the state went predictably and strongly Republican – as it had for decades beforehand. Republican strength in rural and suburban Colorado more than overwhelmed the Democratic-voting areas.

The next post will examine how much of Republican-voting suburban Colorado turned into swing territory.

–Inoljt, http://mypolitikal.com/

Analyzing Swing States: Pennsylvania, Conclusions

This is the last part of a series of posts analyzing the swing state Pennsylvania. The previous parts can be found here.

Conclusions

For many decades, Pennsylvania constituted model of Democratic strength based upon working-class votes. Today that is changing, especially in the southwest. For the moment, nevertheless, the swing state Pennsylvania remains Democratic-leaning. This is more because of an unusually strong Democratic machine than any natural liberalism in Pennsylvania.

In 2008 Democrats won Pennsylvania by double-digits, amassing a coalition based upon poor blacks in Philadelphia and Pittsburgh, rich whites in the Philadelphia suburbs, and working-class votes outside Appalachia. It is a strange-looking combination, but it works.

More below.

Republicans built their strength upon small towns and exurban communities in “the T,” along with working-class votes in the southwest.

For decades, Republicans have been strengthening in western Pennsylvania, while weakening in eastern Pennsylvania. This map indicates these changes.

Pennsylvania,Conclusions

Although it doesn’t look like it, the 2008 Democratic candidate (who won by 10.32%) actually did better than the 1992 candidate (who won by 9.02%).

From all this, the best news for Democrats would be the blue shift Philadelphia’s suburbs have undergone. Republicans will take heart in the Appalachan southwest’s even stronger movement right.

I have previously opined that these changes benefit Democrats on the whole. Indeed, this whole series of posts has inclined toward a theory of continuing Democratic strength in Pennsylvania. I will conclude this chain of posts, therefore, with a map Republicans will like – the 2008 Pennsylvania results by municipality. This illustrates how President George W. Bush almost won Pennsylvania in 2004.

Pennsylvania,Conclusions

Note: Several months ago I posted several diaries analyzing the swing state Pennsylvania. In a search of my posting archives, I just found out that I’d apparently forgotten to post this final part – so here it is.

–Inoljt, http://mypolitikal.com/

Tampa and the 2012 Republican National Convention

By: Inoljt, http://mypolitikal.com/

According to the Times, the Republican Party has selected Tampa to host the 2012 Republican National Convention. Located in the vital swing state Florida, Republican intentions with this pick are fairly straightforward.

Not all national conventions take place in swing states. This impression may be due to 2008, when both parties held conventions in fairly competitive (or not, as it turned out) states. In 2004, however, Republicans held their convention in New York City; Democrats in Boston.

On the other hand, holding national conventions in swing states does constitute good strategy. After Democrats held their 2008 convention in Denver, Colorado ended up voting more Democratic than the nation for the first time since 1964. Likewise, the Minneapolis Republican convention helped Senator John McCain stay competitive in Minnesota weeks after Michigan and Wisconsin began moving Democratic. Choosing Tampa is another variation on this strategy.

Tampa, highly populated and fairly diverse, is a good place to hold a political convention.

More below.

While the city itself probably votes fairly Democratic, the larger  surrounding suburbs lean Republican. The convergence of these forces creates a very competitive environment. Hillsborough  County, which Tampa is located in, has gone within single digits for the past five straight presidential elections. Whoever wins the Tampa area stands a good chance of winning the state.

Florida itself constitutes a Republican-leaning swing state. This is somewhat surprising; at first glance, Florida looks like a typical Democratic-voting state. Diverse, urbanized, and heavily populated, Florida has more in common with blue California and New York than red Alabama or Kansas. The state, moreover, is becoming more minority-heavy as white retirees are replaced by Latino immigrants.

Yet a number of factors combine to make Florida a red-leaning swing state rather than a blue stronghold. Deeply conservative northern Florida, which is more like rural Georgia than Miami, gives Republicans an immediate base. Many white voters are elderly, conservative-leaning retirees. And – unlike most immigrants – the Cuban immigrant community votes strongly Republican, undercutting the Democratic stronghold in South Florida.

Florida has even been drifting right in presidential elections. President Bill Clinton and Vice President Al Gore performed respectably in the state, but Senator John Kerry lost by a sobering margin. Mr. McCain was particularly strong in Florida; he would have won the state by 4.4% given a tied electorate.

This is strange. By all rights, a place like Florida ought to be shifting Democratic, especially given its demographic changes (the opposite is true for much of the Rustbelt Midwest). Yet in the short-term the state has moving in the opposite direction.

When Republicans hold their convention in Tampa, they will attempt to keep Florida in this condition for another presidential election. It is a clever move by a clever party.

Maps of Virginia Elections

By: Inoljt, http://mypolitikal.com/

To follow up the series on Virginia, I’ve posted a few recent presidential elections in the state (courtesy of the New York Times). Each map comes with some brief analysis.

Maps of Virginia Elections

Capitalizing on a decade of Democratic movement, Senator Barack Obama becomes the first Democratic presidential candidate to win Virginia since 1964. The Senator performs best in eastern Virginia, especially the fast-growing northern Virginia metropolis. Western Virginia is not as enamored; parts of it even vote more Republican.

More below.

______________________________________________________

Maps of Virginia Elections

Nobody pays attention to Virginia in 2004, and for good reason: incumbent George W. Bush cruises along to a comfortable victory. Amid all the hoopla in Ohio, Republicans fail to notice a disquieting trend. Fairfax County, the populous heart of Northern Virginia, goes blue in the first time for decades.

______________________________________________________

Maps of Virginia Elections

Governor George W. Bush sails to an 8% victory. He artfully weaves together a classic Republican coalition: wealthy suburbs combined with Republican-trending rural Virginia.

______________________________________________________

Maps of Virginia Elections

Expecting to win the state, incumbent Bill Clinton is surprised to see Virginia slip from his grasp. He does better than in 1992 – performing well amongst Democratic constituencies in the Appalachian west, the black southeast, and the rich inner-core suburbs of Northern Virginia. But it’s not enough: a strong Republican vote in Richmond’s suburbs denies Mr. Clinton his victory.

______________________________________________________

Maps of Virginia Elections

Another presidential election, another Republican victory in Virginia powered by suburbs and small towns. Yet Governor Bill Clinton does relatively well. Compared to the 20.5% beating George H.W. Bush gave to Democratic nominee Mike Dukakis in 1988, a 4.4% loss ain’t nothing.

Analyzing Swing States: Virginia, Part 5

This is the fifth part of a series of posts analyzing the swing state Virginia. It focuses on the traditional Democratic base and its decline. The last part can be found here.

In the days of the Solid South, Democrats worried more about primary elections than Republican challengers. The party, under the sway of the Byrd machine, dominated almost every part of the state – as it did throughout the South.

Civil rights and suburban growth broke the back of this coalition. In 1952 Virginia voted for Republican candidate Dwight Eisenhower. By the 1970s Virginia had elected its first Republican governor, senator, and attorney general in nearly a century.

Democrats were left with strength in two reliable regions – the southeast and the western panhandle. These places constituted the traditional Democratic base, which Democrats relied on for a number of decades.

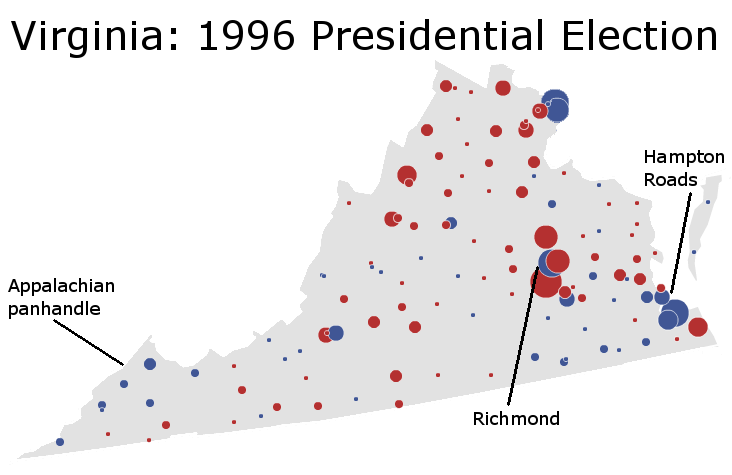
The 1996 presidential election provides an excellent illustration of this base:

Analyzing Swing States: Virginia,Part 5

More below.

With his rare ability to command support among both poor Appalachian whites and poor Southern blacks, Mr. Clinton performed powerfully with the traditional Democratic coalition. As the map indicates, the incumbent president dominated the southeast, while winning a number of counties in the panhandle. It is an illustration of the traditional base at a strong point.

Clinton also lost Virginia by two percentage points. This indicates something else: it is actually very difficult to win the state with the traditional Democratic base. There are just not enough Appalachian whites and blacks (20% of the population) in Virginia. Take mostly black, heavily Democratic  Richmond. In 2008 a little more than 90,000 votes were cast in the city. A respectable number – but barely more than half the 162,088 votes cast in  neighboring, suburban Chesterfield County.

Richmond also constitutes an important part of the Virginia’s Democratic-voting southeast – the first prong of the classical Democratic coalition. Democratic strength in this region can be explained through demographics; the region is home to much of the state’s black population:

Analyzing Swing States: Virginia,Part 5

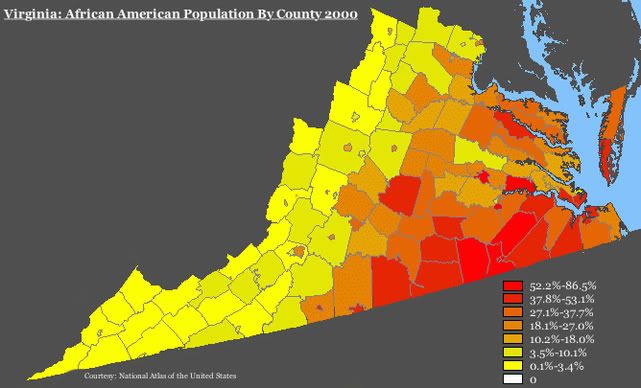
Black voters, grateful for its passage of Civil Rights, remain a vital constituency of the Democratic coalition. They constitute a  stable block of voters  for a Democratic candidate to build upon.

Geographically, Democrats usually win a few rural, majority-black counties in the southeast. In addition, black votes give Democrats sizable margins coming out of Richmond and four Hampton Roads cities – Norfolk (the largest), Portsmouth, Hampton, and Newport News. In 2008 Senator Barack Obama’s vote ranged from 64% (Newport News) to 79% (Richmond) in each of these cities.

Unfortunately for Democrats, the second prong of their traditional base – the Appalachian panhandle – is quickly moving away from them. This area is fairly rural and somewhat poor; as the map above indicates, its population is fairly homogeneously white. Until recently, Democrats could rely on panhandle votes even in the event of a double-digit loss. Its residents voted Democratic based off a combination of economic interests and tradition.

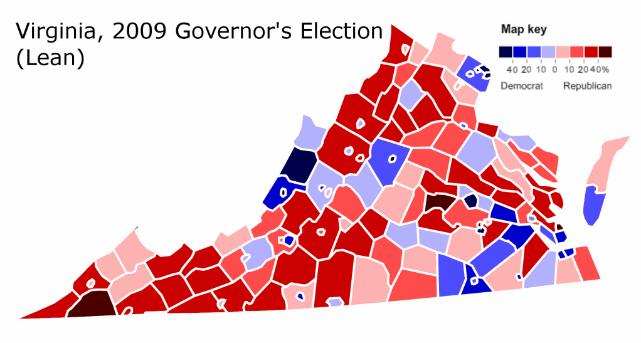
As the party becomes more metropolitan-based and liberal, however, the panhandle has been drifting away. The election of President Barack Obama, an ill-fit with Appalachian America, has accelerated the rightward movement. In 2009, Democratic candidate Creigh Deeds lost the panhandle by a landslide.

Analyzing Swing States: Virginia,Part 5

Even in the days in which the panhandle voted loyally Democratic, the base – as has been noted before – was insufficient for statewide victory. Democrats needed to add another prong to their coalition. Mr. Clinton attempted to do so by reviving support amongst the rural whites who’d long ago abandoned the Democratic Party; he mostly failed in his endeavor. In 1976, President Jimmy Carter did much better with rural whites but much worse with their suburban counterparts; Mr. Carter also barely lost Virginia.

Statewide Democratic candidates, on the other hand, have been able to win the state through a combination of the traditional base and a respectable suburban showing. Indeed, no Democratic presidential, senatorial, or gubernatorial candidate has won Virginia, for at least two decades, while losing suburban Fairfax County.

In recent years Democrats have traded the Appalachian panhandle for these NoVa suburbs. This switch has, in the aggregate, been to their benefit. The old Democratic base was rarely enough to win Virginia. With the addition of NoVa, Democrats have won three out of four past statewide elections. Virginia has moved from a red state to a purple one.

–Inoljt, http://mypolitikal.com/

Maps of Pennsylvania Elections

By: Inoljt, http://mypolitikal.com/

A few maps of Pennsylvania’s presidential elections are posted below, for your enjoyment. Each map comes with some brief analysis. Note how in each succeeding election, Democratic margins in the Philadelphia metropolis increase, while their margins in the Pittsburgh corridor decrease.

(Note: Because the Times stopped updating before all absentee/provisional ballots were counted, this map does not fully reflect the actual results. I have corrected the discrepancy.)

Maps of Pennsylvania Elections

As the national tide increasingly turns in Senator Barack Obama’s favor, Senator John McCain mounts a quixotic attempt to win Pennsylvania. While Mr. McCain improves in the southeastern rustbelt, Democratic dominance in eastern Pennsylvania ensures a double-digit blue margin.

More below.

Maps of Pennsylvania Elections

President George W. Bush mounts a determined attack on Pennsylvania, coming within 2.5% of Senator John Kerry. Mr. Bush does quite well in the traditionally Democratic Pittsburgh corridor and Republican strongholds throughout the “T.” But double-digit losses in Philadelphia’s suburbs (and a 400,000 vote deficit coming out of the city itself) prevent Mr. Bush from victory.

______________________________________________________

Maps of Pennsylvania Elections

Without President Bubba holding the line, Republican margins in Pennsyltucky are much higher. Nevertheless, Al Gore closely carries Pennsylvania based on Democratic strongholds in the Philadelphia and Pittsburgh metropolises.

_____________________________________________________

Maps of Pennsylvania Elections

With incumbent Bill Clinton poised to win comfortably weeks before election day, Senator Bob Dole does not seriously contest Pennsylvania. Democrats improve in the east and weaken in the west, while Mr. Clinton sails to a comfortable victory.

______________________________________________________

Maps of Pennsylvania Elections

Governor Bill Clinton romps to a nine-point margin, following three straight Republican victories in the state. Mr. Clinton milks Democratic strength in the industrial southwest for everything it’s worth, winning 2-1 margins in a number of counties. More ominously for Republicans, President George H. W. Bush barely loses the Philadelphia suburbs – the first Republican to do so since Senator Barry Goldwater (and before him President William Taft, in 1912).

(Note: Credit goes to the NYT for these amazing images.)

Analyzing Swing States: Virginia, Part 4

This is the fourth part of a series of posts analyzing the swing state Virginia. It is the second section of two focusing on Northern Virginia, and focuses on analyzing the structural foundation behind NoVa’s Democratic shift. The fifth part can be found here.

Analyzing Swing States: Virginia,Part 4

Demographics

In many ways, Northern Virginia represents the best America has to offer. As wealthy, diverse, and rapidly growing suburb, it offers the very essence of the American Dream.

More below.

Demographically, Northern Virginia is one of those rare places whose racial composition is representative of America as a whole. In Fairfax County today blacks constitute 9.4% of the population, Hispanics 13.5% (nationally the numbers are 12.3% and 15.1%, respectively). Asians come in at 15.8%, a higher number than the national average.

As has been much noted, Northern Virginia is getting more diverse. In Fairfax County, for instance, the numbers of blacks, Hispanics, and Asians have all increased since the 2000 census – which counted blacks as 8.6%, Hispanics as 11.0%, and Asians as 13.0% of the population.

These changes are especially striking in exurban NoVa. Loudoun County, 2000 was 5.9% Asian and 5.3% Hispanic. Since then those numbers have more than doubled; from 2006-2008, the census estimated Loudoun as 12.3% Asian and 10.1% Hispanic (blacks constituted 7.8% of the county’s population).

Finally, Northern Virginia is very, very, very rich. The median household income in both Fairfax and Loudoun exceeds $100,000; a 2008 census study estimated them as the two wealthiest counties in America (see page 13). More than one-third of individuals over 25 in Arlington County hold graduate degrees, compared with less than 10% of Americans at large. Life expectancy is the highest in the nation.

The Future

Although Northern Virginia continues become more diverse, it is unclear how much more Democratic it can get. Suburbs rarely give a party more than 60% of the vote, and 65% seems to be the upper limit for Democrats. Given that President Barack Obama won 60.12% in Fairfax County, Democrats appear to be near this line.

Analyzing Swing States: Virginia,Part 4

On the other hand, the suburban metropolis that does break this rule (the Bay Area) has a lot in common with Northern Virginia. Like NoVa, the Bay Area is rich, diverse, and growing. But the Bay is also composed of a majority of minorities; this will not happen anytime soon in Northern Virginia.

Moreover, Virginia is missing the one piece that would truly make it a Democratic stronghold. Democratic suburbs like NoVa often surround poor, astonishingly Democratic cities. The good news is that NoVa does surround such a city – and that city gave Democrats 92.46% of its vote in 2008. The bad news is that the city’s name is Washington D.C.

All this may not matter, however, if Northern Virginia continues its rapid growth. Today the exurbs in Loudoun and Prince Williams are the main sites of development, while Fairfax County’s growth appears to have slowed down. This translates into many more voters:

Analyzing Swing States: Virginia,Part 4

As Loudoun and Prince Williams become more diverse, moreover, they are been voting ever more Democratic. In 2000 Loudoun voted Republican by a 8.25% margin; in 2008 it voted Democratic by a 15.22% margin.

If Northern Virginia continues growing at this rate – and voting Democratic by a 3-2 margin – Virginia may eventually change into a Democratic-leaning state. This will probably be balanced out as other Democratic states naturally turn Republican-leaning. Nevertheless, adding NoVa to the old Democratic base leaves the Democratic Party in strong shape. That traditional base will be the subject of the next post.

Analyzing Swing States: Virginia, Part 3

This is the third part of a series of posts analyzing the swing state Virginia. It is the first section of two focusing on Northern Virginia. The fourth part can be found here.


NoVa

A vast and growing suburban metropolis, Northern Virginia has become increasingly important in Virginia politics. There, demographic changes have imperiled Republican dominance of Virginia.

To illustrate the exceptional nature of this movement, compare the two elections below. Here is 2000:

Photobucket

Eight years later, Northern Virginia has transformed:

Photobucket

More below.

In 2000, Governor George W. Bush had won Virginia by a comfortable 8.1% margin, carving out the traditional Republican coalition of rural and suburban Virginia. As this picture indicates, Virginia Democrats in 2000 really don’t have a base of support, except perhaps the heavily black southeast parts of the state. By 2008 Senator Barack Obama won the state by an equally comfortable 6.30% – a 14.3% shift in support.

Before digging into the dynamics of modern NoVa, it is worth exploring its past behavior to gain a sense of context.

A History

Northern Virginia was not always as populous as it is today; well into the twentieth century, it remained a rural (and heavily Democratic) backwater. In the 1940 presidential election, for instance, less than 10,000 people voted in Arlington County.

Growth began in the 1940s, however, driven by an ever-expanding federal government. The inner-ring suburbs in Arlington started expanding first, followed by Fairfax County in the 1950s. Like many other white and wealthy suburbs, Northern Virginia leaned Republican during this era.

Photobucket

Unlike some suburbs, however, Northern Virginia never fell in love with Republicanism. In Fairfax County, Republican presidential candidates only once took more than 65% of the vote (in 1972) – something which would regularly happen in a place like Chesterfield County, a suburb of Richmond.

Change first began in the 1980s, when inner-ring suburbs such as Arlington started voting Democratic. In the 2000 map, one sees Arlington County as the lonely blue bubble to the right of Fairfax County.

By 2000, as the graph above indicates, change was coming to the suburban communities in Fairfax. In 2004 the county voted Democratic by a 7.30% margin, which should have been a warning sign to Republicans. A mere two years later, it powered Democratic candidate Jim Webb to a narrow victory over incumbent Senator George Allen (he won the county by 18.9%). In 2008 Fairfax – well, just look at the map to see what happened in 2008.

In just eight short years, Northern Virginia has turned from a Republican-leaning suburb into a fundamental part of the Democratic base. Virginia has changed from a red state into a purple one, due mainly (but not entirely) to Northern Virginia.

The next post will explore Northern Virginia today – in order to get a sense of how this has happened.

–Inoljt, http://mypolitikal.com/