Analyzing Swing States: Virginia, Part 2

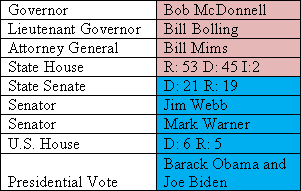
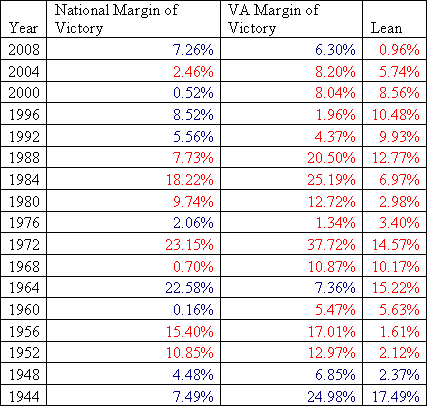
This is the second part of a series of posts analyzing the swing state Virginia. It will focus on Republican Virginia. The third part can be found here.

Analyzing Swing States: Virginia,Part 2

History

After the Civil War, Virginia constituted a reliable Democratic stronghold. Conservative Democrats such as Harry F. Byrd, who controlled the state’s politics for decades, typified the state’s politicians.

Like many southern states, Virginia enacted a strict set of voting restrictions which successfully disenfranchised blacks. However, it never voted as overwhelmingly Democratic as the Deep South; only one Democrat (FDR) ever won more than 70% of the vote.

Earlier than most Southern states, Virginia began moving Republican, beginning in 1952 (when it cast the ballot for General Dwight Eisenhower). Republican strength rested upon the mountainous west (Republican even in the days of the Solid South) and the fast-growing, Republican-leaning suburbs. The west still votes Republican, but the suburbs are changing fast.

More below.

Republican Virginia

Analyzing Swing States: Virginia,Part 2

Like many states in the South – and, in fact, like America itself – the “normal” voter usually leans Republican. When one imagines a Virginian (perhaps a hard-scrabble Appalachian type or a white suburban businessman), one is usually looking at a conservative. It is the growing numbers of “other” voters in the state that are making it competitive today.

These Republicans have several factors in common. Exit polls of the 2008 presidential election provide an interesting but incomplete picture of who they are. As is true of the United States in general, Virginia Republicans are predominately white (60% voted for Senator John McCain, versus 55% nationwide). White college graduates are substantially more Democratic than white non-graduates, but polling did not reveal an income gap. Evangelism Evangelicalism constituted a major factor: white evangelicals voted for McCain by a 4-1 margin. Interestingly, white women did not vote much more Democratic than white men; Virginia’s gender gap was quite narrow relative to the nation at large.

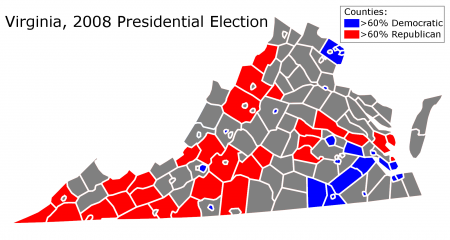
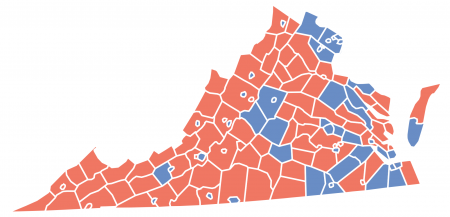
As the map above indicates, the Republicans do best in the western reaches of Virginia. Partly this is because Democratic-voting minorities – mostly blacks – generally live in the east. The quick rightward drift of Appalachian America also accounts for Republican strength, which is growing in the region.

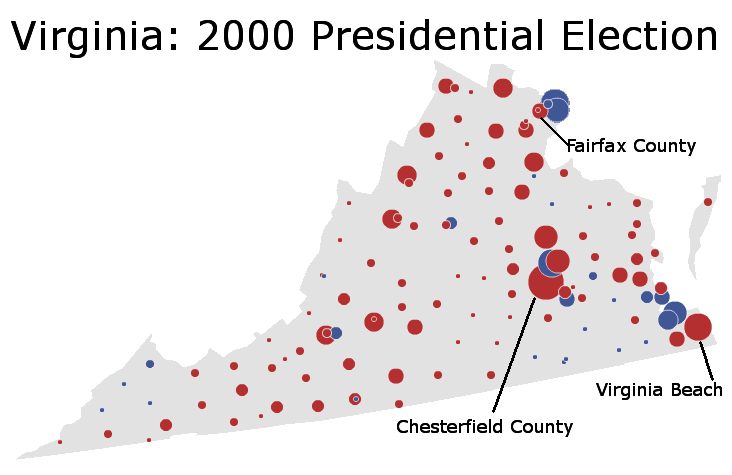
Republicans also retain strength in Virginia’s suburbs and exurbs. Specifically, suburban Richmond and Hampton Roads used to vote Republican quite strongly, ensuring Republican victories even when Democrats undercut their margins in rural Virginia. President Bill Clinton, for instance, did quite well in rural Virginia; it was his losses in these places (Chesterfield and Virginia Beach counties) that kept the state red.

The 2000 presidential election provides an illuminating illustration of Republican Virginia at a strong point:

Analyzing Swing States: Virginia,Part 2

In that election, Vice President Al Gore lost the state by 8.04% while barely winning the nationwide popular vote. Unlike Mr. Clinton, he was crushed in both rural and suburban Virginia. The former was quickly drifting right, while the suburb’s movement left had yet to materialize.

Since that time, of course, things have changed. While Democratic candidates previously – and mostly unsuccessfully – attacked the rural component of Republican Virginia, they have since switched their focus to populous, wealthy, and diverse suburban Virginia. In particular, Democrats have been appealing quite effectively to the suburban NoVa metropolis, which never really fell in love with Republicanism.

–Inoljt, http://mypolitikal.com/
Maps of Ohio Elections

By: Inoljt, http://mypolitikal.com/

A few maps of Ohio’s presidential elections are posted below, for your enjoyment. Each map comes with some brief analysis.

Maps of Ohio Elections

(Note: Because the Times stopped updating before all absentee/provisional ballots were counted, this map does not fully reflect the actual results. I have corrected the discrepancy.)

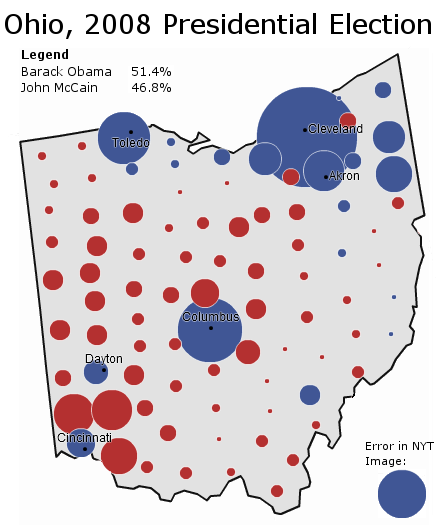
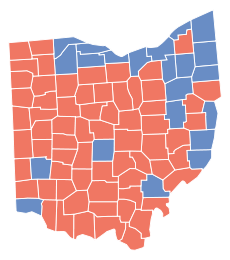
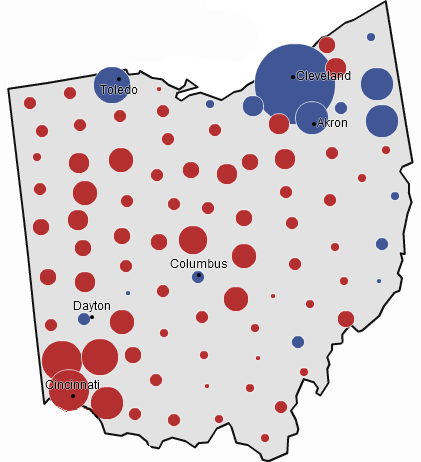
Senator Barack Obama wins Ohio by 4.6%, a solid but unimpressive victory. Mr. Obama performs poorly in traditional Democratic areas – the northeast and even Cleveland – but offsets this with unique strength in Columbus and Cincinnati. Senator McCain runs strongly in the Republican base.

More below.

Maps of Ohio Elections

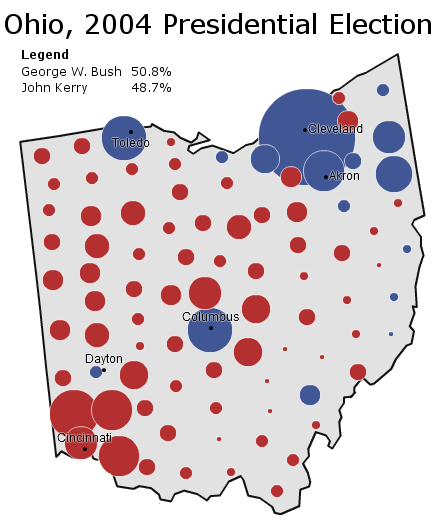
President George W. Bush wins Ohio by a close but decisive margin. Senator John Kerry does extremely well – winning Columbus and Cleveland by what his campaign wants – but Mr. Bush’s exurban strength famously overwhelms this strength. Nevertheless, Ohio votes more Democratic than the nation, the first time since 1972.

______________________________________________________

Maps of Ohio Elections

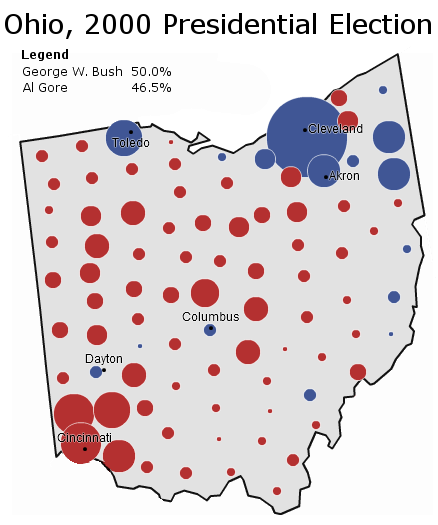
Vice President Al Gore gives up Ohio before election-day; Governor George W. Bush wins the state by 3.5%. Perhaps, campaign strategists later muse, they should not have abandoned the state.

______________________________________________________

Maps of Ohio Elections

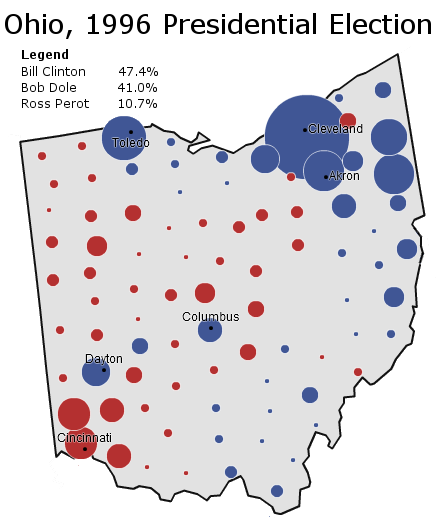
Incumbent Bill Clinton cruises to a comfortable victory – the best Democratic performance since LBJ (and before that, FDR). The former Arkansas governor runs strong in the industrial northeast and the Appalachian southwest, while severely undercutting Senator Bob Dole’s margins in Republican territory. It’s a classic Democratic victory.

______________________________________________________

Maps of Ohio Elections

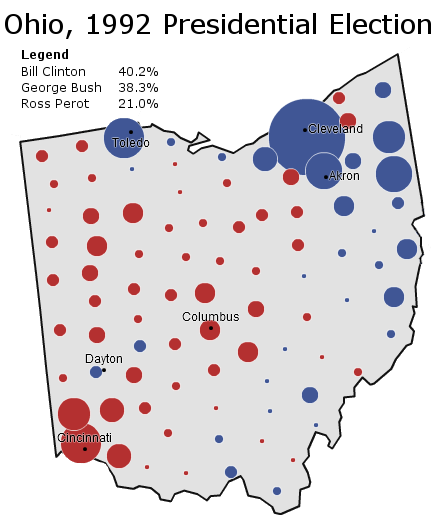
It’s an exact replica of the 1996 map – except this time the Democratic strongholds are a bit less blue, the Republican strongholds a bit more red, and Ross Perot is running strong. Governor Clinton wins by a mere 1.8%.

Analyzing Swing States: Virginia, Part 1

This is the first part of a series of posts analyzing the swing state Virginia. The second part can be found here.

Analyzing Swing States: Virginia,Part 1

During the ’08 campaign, the political beltway famously defined Virginia as a Republican stronghold gone Democratic. For ten straight presidential elections, the state had reliably turned up in the Republican column. President Barack Obama, however, promised to change that – and he did.

More below.

Virginia indeed is becoming bluer – but not as much as one might think. The state moved Republican sooner than the rest of the South, but never became as deep red as places like Alabama. The actual trend from ’04 to ’08 is less prominent than one might think:

Analyzing Swing States: Virginia,Part 1

I think this in fact slightly understates Republican strength. Mr. Obama, after all, fit extremely well with Virginia’s Democratic base – blacks and rich NoVa residents. He might have overperformed. In many ways, Virginia still constitutes a purple state, perhaps even a red-leaning one. Democrats must run competent candidates and/or do this in favorable national environments; if both conditions are missing, they may get pummeled ala Creigh Deeds.

This may change in the future. As its wealthy, diverse, and Democratic-leaning NoVa suburbs continue growing; Virginia may soon become more Democratic than even Pennsylvania. This trend was much noted in 2008.

What is less noted is the degree to which the media has overstated this change. These demographic shifts are the work of decades, not one election; they occur very gradually. Moreover, even as bluing NoVa expands, Virginia’s western regions continue to redden – especially the once Democratic-leaning panhandle. This blunts the NoVa effect. Virginia may be turning Democratic, but Democrats should not underestimate continued Republican strength.

–Inoljt, http://mypolitikal.com/
Analyzing Swing States: Pennsylvania, Part 5

This is the fifth part of an analysis of the swing state Pennsylvania. It focuses on the traditionally Republican region between the Democratic strongholds in the southeast and southwest. The last part can be found here.

Photobucket

Pennsyltucky

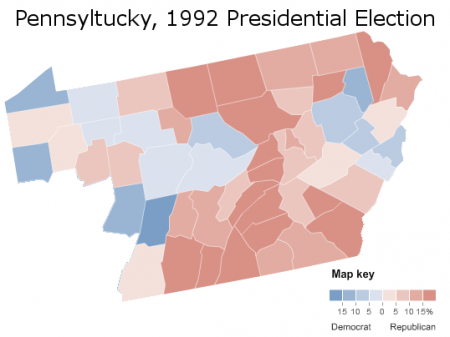
Outside the Pittsburgh and the Philadelphia metropolis, Pennsylvania is a very different place. Political analysts often label this area “the T,” while others call it Pennsyltucky.

Popular culture mythologizes Pennsyltucky as red-neck capital – a rural region dominated by NASCAR-loving red-necks. Politically, James Carville compared Pennsyltucky to Alabama without the blacks.

In fact, this stereotype is inaccurate on two accounts. Firstly, Pennsyltucky contains far more than so-called rural red-necks; most of its counties are fairly populated (they are far more densely peopled than, say, rural Arkansas). Secondly, many of these supposedly NASCAR-loving red-necks also belong to the local union and vote Democratic on economic issues. The majority may support Republicans, but that majority certainly is below the 88% of Alabama whites that voted for John McCain.

Nevertheless, the “T” does constitute the Republican base in Pennsylvania. Former president George W. Bush pulled 48.42% of the state’s vote in 2004, and he had to get those votes somewhere.

More below.

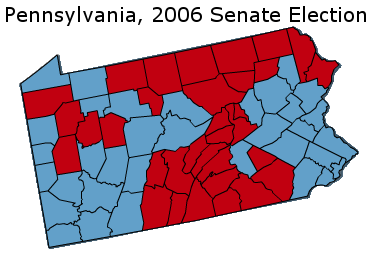
Pennsylvania’s 2006 Senate election provides a geographic illustration of this base. In that election, former Senator Rick Santorum lost by a landslide 17.36% margin; only the reddest counties supported him:

Photobucket

Although they cover a lot of land, not all these counties are rural enclaves of Pennsyltucky (if they were all rural, Senator John Kerry would have won by double-digits in the state). In fact, fast-growing exurbs constitute a substantial source of Republican votes. Located east of the Philadelphia metropolis, these are somewhat wealthy and mostly white. They include Lancaster County (where Bush won 65.80% of the vote) and York County (where he won 63.74%); the former president came out of these two counties with a 121,832 margin, enough to offset Pittsburgh, Erie, and Scranton.

Erie and Scranton both constitute solidly blue areas belonging to “the T.” They give lie to the myth that all Pennsyltucky votes loyally Republican. Like the southwest, Erie and Scranton contain a number of working-class Democrats; unlike the southwest, however, cultural appeals have not swayed these folk into voting Republican.

Indeed, Democrats do respectably in many parts of Pennsyltucky. Here is President Barack Obama’s performance:

Photobucket

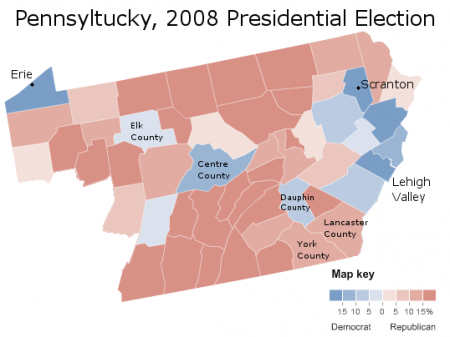
Mr. Obama did not just win Erie and Scranton; he took several other counties and ran closely elsewhere. These included Centre County, home to Pennsylvania State University, and Dauphin County, which has a relatively high black population. All the Lehigh Valley – somewhat an extension of Philadelphia’s suburbs – voted for the president. More surprisingly, Obama ran very closely in several rural, lily-white regions of the T; one such county (Elk) even gave the president a 4% margin of victory.

Obama was not the only Democrat to do well in parts of Pennsyltucky. Here is how former president Bill Clinton performed:

Photobucket

Mr. Clinton, of course, was a fellow with immense appeal to so-called “red-necks.” Since his time, much of Pennsyltucky has moved to the right. Yet not all of it is deep-red: while some counties gave Mr. McCain more than 70% of the vote, others – demographically identical – gave him barely more than 50%. These are substantial and curious variations.

While Pennsyltucky as a whole votes strongly Republican, it is wrong to generalize the area. Its most populous regions – the exurbs – constitute a vital part of the Republican coalition, while some rural counties have a fairly weak Republican habit. Finally, a number of places dependent upon industry routinely support Democrats. To stereotype the “T” as a composed solely of Republican-voting red-necks would do injustice to the region’s complexities.

(Note: All statistics come from http://uselectionatlas.org/ . Some pictures modified from the NYT.)

–Inoljt, http://mypolitikal.com/
Analyzing Swing States: Pennsylvania, Part 4

This is the fourth part of an analysis of the swing state Pennsylvania. It focuses on the industrial southwest, a once deep-blue region rapidly trending Republican. Part five can be found here.


Pittsburgh and the Southwest

Pennsylvania’s southwest has much in common with West Virginia and Southeast Ohio, the northern end of Appalachia. Electoral change in the region is best understood by grouping these three areas together as a whole.

Socially conservative (the region is famously supportive of the NRA) but economically liberal, the industrial southwest voters typify white working-class Democrats. These voters can be found in unexpected places: Catholics in Rhode Island and Massachusetts, loggers along the Washington coast, rust-belt workers in Duluth, Minnesota and Buffalo, New York.

It was President Franklin D. Roosevelt and the New Deal that brought the working-class to the Democratic Party; before his time, the party constituted a regional force confined mainly to the South. In Pennsylvania, a Republican stronghold that had voted for President Herbert Hoover, Mr. Roosevelt laid the foundations for a lasting Democratic coalition.

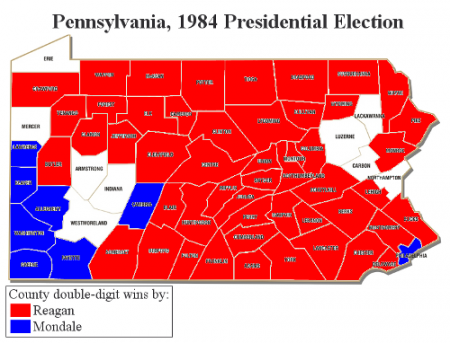
For decades, voters in southwest Pennsylvania constituted this coalition’s foundation. Take, for instance, Democratic nominee Walter Mondale:

Photobucket

In 1984, the industrial southwest, badly hurting from a receding recession, cast a strong ballot for Mr. Mondale. It did so again for Governor Mike Dukakis, and twice for President Bill Clinton.

Ironically, it was during the presidency of Mr. Clinton – a man much liked by Appalachia – that the Democrats became regarded as the party of the coasts and the elite. Ever since his time, Pennsylvania’s industrial southwest has been in a bad way for Democrats.

More below.

Thus, whilst metropolitan Philadelphia has been moving steadily left, Pittsburgh and the industrial southwest have been marching in the opposite direction.

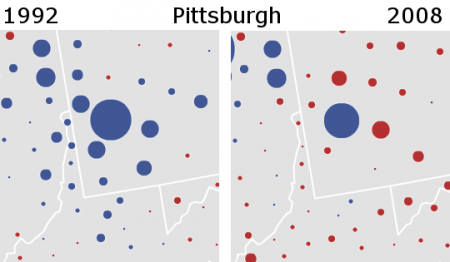
To get a sense of the movement in this region, compare these two maps:

Photobucket

In less than a generation’s span, one sees Democratic strength in northern Appalachia utterly vanish.

In a state where things have been going badly for Republicans, southwest Pennsylvania provides some consolation. Were it not for the southwest’s rightward trend, Pennsylvania would today be a fairly solid Democratic state.

Nevertheless, if I were to choose between Pittsburgh and the industrial southwest or Philadelphia and the suburban southeast, I would much prefer the latter. While Philadelphia itself is in declining, its metropolitan area as a whole has experienced rapid growth. The southwest’s population, on the other hand, remains basically stagnant, suffering the effects of economic decline.

In absolute terms, moreover, eastern Pennsylvania holds far more votes:

Photobucket

Republicans might take comfort in Allegheny County’s vote reservoir – were it not consistently blue. Indeed, Democratic strength in Pittsburgh ensures that, as a whole, the southwest will still vote Democratic for some time yet. Although – unique to practically every other major city – Republicans have been improving in Pittsburgh, its substantial black population limits their potential.

The puzzling thing, however, is why Appalachian working-class whites are moving so rapidly right. It cannot be simply race: both Vice President Al Gore and Senator John Kerry were white, after all, yet they still did progressively worse. It cannot be simply elitism, either: Governor Mike Dukakis and Governor Adlai Stevenson were intellectual technocrats, yet they won what Mr. Kerry and Mr. Gore could not.

Finally, it is not as if all the white working-class has suddenly turned Republican: voters in Michigan, northeast Ohio, upstate New York, and Silver Bow and Deer Lodge Montana, amongst other regions, still retain the Democratic habit. In Pennsylvania, working-class strongholds such as Scranton and Erie, surrounded by a sea of Republican counties, also continue to vote deep blue. They will be the topics of the next post.

–Inoljt, http://mypolitikal.com/
Analyzing Swing States: Pennsylvania, Part 3

This is the third part of a series of posts analyzing the swing state Pennsylvania. Part four can be found here.


Philadelphia’s Suburbs

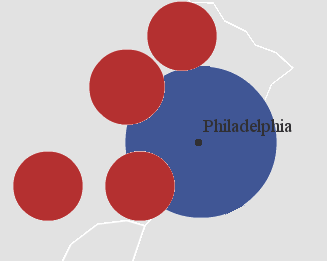
There used to be a time when Republicans could count on Philadelphia’s suburbs to counter Democratic margins from the city. This is Philadelphia, circa 1988:

Photobucket

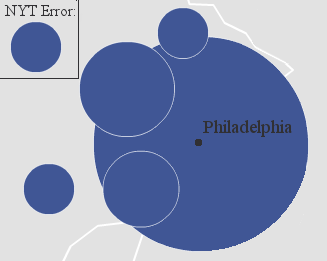
Not anymore. Philadelphia, 2008:

Photobucket

(Note: Because the Times stopped updating before all absentee/provisional ballots were counted, this map does not fully reflect the actual results. I have corrected the discrepancy.)

Indeed, in 2008 President Barack Obama’s suburban margins were so great that Democrats did not even need Philadelphia to win Pennsylvania.

Philadelphia’s suburbs stretch across four counties: Bucks, Chester, Delaware, and Montgomery. Bucks contains more working-class, Catholic communities. Chester, on the other hand, is more exurban and conservative (in this century, Democrats have only incontrovertibly won the county twice – in 1964 and 2008).

More below.

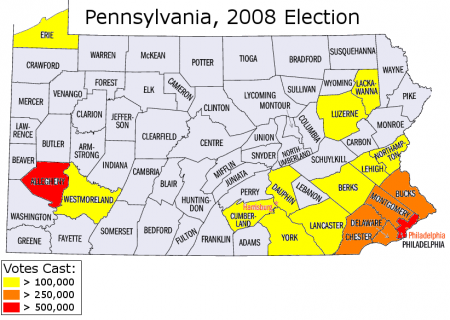
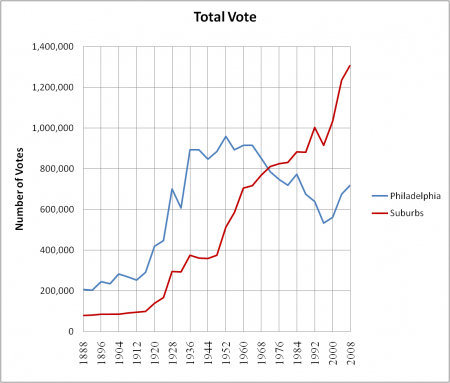
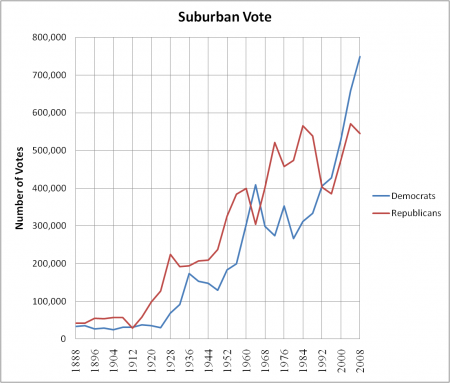
The suburbs hold more importance than implied by the above maps, which tend to exaggerate Philadelphia’s size due to its one-sided voting pattern. While the city’s population continues its long, slow decline, its suburbs have grown at a rapid clip. Today, the number of votes they hold almost doubles the city’s reservoir.

Photobucket

While regional differences exist, Philly’s suburbs do have one thing in common: they compose the wealthiest area in the entire state. Chester, Bucks, and Montgomery Counties rank #1, #2, and #3 in the state’s median household income. They also lack diversity; the census classifies around 90% of Bucks County residents as non-Hispanic whites.

Given these characteristics, one might expect Philly’s suburbs to be rock-hard Republican strongholds. Until recently they did vote strongly Republican; Democrats only won the suburbs twice (in 1964 and – due to TR’s Bull Moose candidacy – 1912) before 1992. It was President Bill Clinton who changed this pattern; in 1992 he barely managed to turn Bucks, Delaware, and Montegomery blue (his greatest margin was 3.4%). Ever since then Democrats have been doing better and better.

Photobucket

This shift does not constitute an anomaly; Democratic candidates since Mr. Clinton have been winning a number of wealthy, white suburban counties that used to go strongly Republican. Before Clinton, Long Island and Westchester consistently gave Republicans double-digit margins; today they’ve voted Democratic for the past four consecutive elections. Detroit’s suburbs – Oakland and Macomb counties – have gone from Reagan Democrat fortresses to regions John Kerry tied. Senator John McCain barely won Orange County, that symbol of suburban Republican might.

Montgomery and Delaware counties are especially Democratic-friendly. They  identify more with the populous, sophisticated northeastern seaboard than the more conservative Midwest. As such, these counties by nature sympathize with liberal sentiment; George W. Bush lost both by double-digits. This does not necessary mean, however, that Montgomery and Delaware constitute bastions of acceptance; products of white flight from Philadelphia, they can at times be fairly hostile to people who are considered different.

Increasing Democratic strength in these well-off suburbs portends great trouble for Republicans. In 2008, Mr. Obama’s performance in Montgomery and Delaware counties eclipsed his suburban strength in practically every other swing state. Only suburbs in places like the Bay Area, Seattle, and New England voted more Democratic.

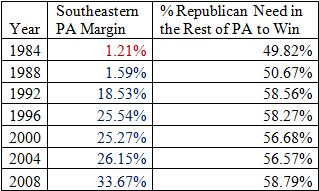
In total, Obama won the Philly suburbs by 15.56%. Combined with his landslide in the city itself, he came out of southeast Pennsylvania with a 682,392 vote margin. This meant that John McCain needed to win the rest of the state by 58.79%.

Photobucket

If Pennsylvania was like Missouri – if the remainder of the state voted strongly Republican – this might just have been possible. But Pennsylvania is not like Missouri; southwestern Pennsylvania used to be unchallenged Democratic territory, while Scranton, Erie, and the Lehigh Valley all lean Democratic. John McCain thus lost the state by double-digits.  His only successes occurred in southwestern Pennsylvania, which is reddening almost as quickly as the southeast is bluing.

–Inoljt, http://mypolitikal.com/
Analyzing Swing States: Pennsylvania, Part 2.5

This is part of an analysis of the swing state Pennsylvania. Part three can be found here.

(A note: There will be a lot of maps in this post.)

Philadelphia: Precinct Results

My first post on the swing state Pennsylvania focused on the city Philadelphia, an incredibly Democratic city. At the time, I looked for detailed ward and precinct results but was unable to find any. Recently, however, I have come across a website which maps Philadelphia precinct results across a whole range of elections; it is a literal gold mine. This offers the opportunity to substantially deepen the previous analysis.

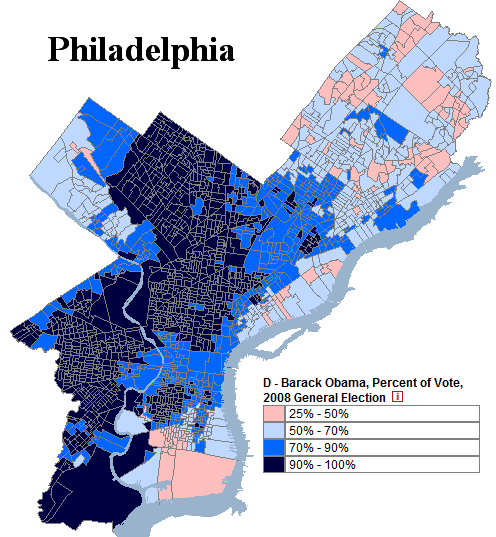
Below is a map, derived from the website, of the 2008 presidential election in Philadelphia (by precinct!)

Photobucket

An analysis of this result below.

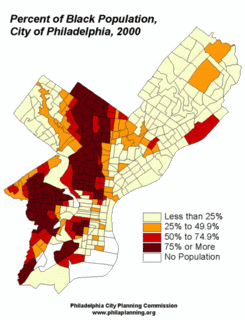
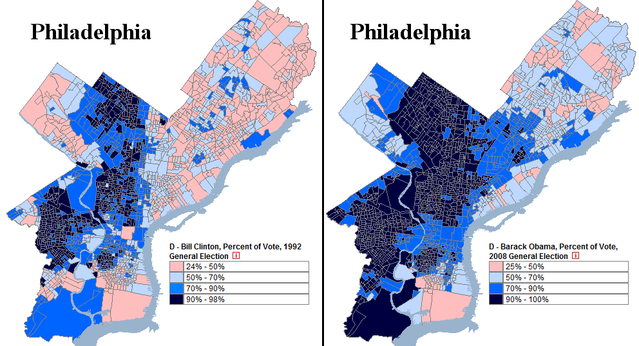
The legend ranges from President Barack Obama’s weakest precinct (25% of the vote) to his strongest (literally every single person voted for him). In total, Mr. Obama won 83.00% of the county’s vote – an amazingly high figure. For reference, below is a map of Philadelphia’s black population.

Photobucket

There is, of course, a distinct parallel between the two demographic maps; blacks vote heavily Democratic and will continue to do so in the foreseeable future.

For decades, the city Philadelphia has trended Democratic. In percentage terms, its Democratic vote has increased for the past seven consecutive elections. In 1992, for example, former President Bill Clinton won 68.16% of the county. A comparison to Obama’s performance is revealing:

Photobucket

If there is any consolation for Republicans in all this, it is northeast (and parts of south) Philadelphia. Notice that in both maps above, Mr. Clinton and Mr. Obama perform distinctly worse here. This area of the city is populated mostly by white Catholics and Jews, although white flight has weakened their numbers. Nevertheless, northeast Philadelphia remains far whiter than the rest of the city, and as assimilated Catholics lose their traditional Democratic loyalties, Republicans have been gradually improving their percentages. John McCain actually did better than Bush in parts Northeast Philadelphia, supported by voters uncomfortable with Barack Obama’s race.

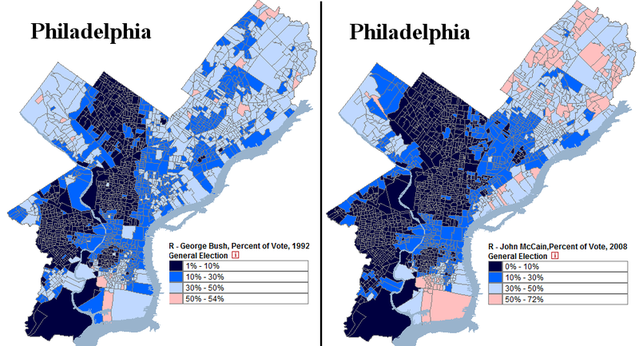
The above map hides this trend; many northeast Philadelphia voters cast their ballots for Ross Perot in 1992, so the Democratic percentage vote was artificially low that year (minority voters, on the other hand, generally did not vote for Mr. Perot). Comparing the Republican vote is more useful:

Photobucket

In general, Senator John McCain (who won 16.33% of the vote) does worse than former President George H.W. Bush (who won 20.19%). In the northeast, however, the opposite trend occurs. The shift is gradual and slow – not like West Virginia’s rapid red turn – but enough to be noticeable.

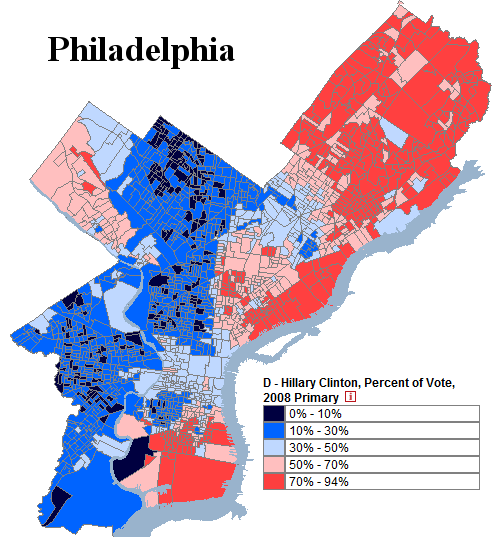
Under perfect conditions, growing Republican strength might result in something like this:

Photobucket

This is Secretary of State Hillary Clinton’s performance during the Pennsylvania primary. The senator won a respectable 34.80% of Philadelphia’s vote, fueled by support amongst white Catholics in the northeast. As evident in the map, the city contained extensive polarization; the majority of precincts gave over 70% of the vote to one candidate. In effect, Philadelphia split into two different blocs.

To be clear, Republicans will have a very difficult time achieving a result like this. It would take a momentous change for white Catholics to cast more than 70% of their ballots for Republicans. If this happened, moreover, winning Philadelphia would be the least of Democratic worries.

The other possibility would be for Republicans to improve their percentage amongst African-Americans. Statistically, 90+% support for any party seems untenable over a long period of time. Republicans, however, do not appear anywhere close to achieving this goal. The fact that they are more likely to reach 60% support amongst white Catholics than 15% support amongst blacks says a lot about the state of the Republican Party (and the state of America, too).

–Inoljt, http://mypolitikal.com/
Analyzing Swing States: Pennsylvania, Part 1

This is the first part of an analysis of the swing state Pennsylvania. Part two can be found here.

Photobucket

In the dying days of his campaign John McCain mounted a quixotic attempt to win Pennsylvania. Despite his efforts, Obama cruised to a double-digit victory; from May to November 4th, only one poll showed McCain leading.

Two years previously, Pennsylvania Senator Rick Santorum – a Republican politician who had ambitions of becoming president – ran for re-election. A hard-line, nationally known conservative, he was overwhelmingly defeated by challenger Robert Casey.

These two instances provide a sense of Pennsylvania’s political climate; the state, while not exactly liberal, naturally leans towards Democratic candidates. The average Republican must overcome a formidable Democratic machine to win Pennsylvania.

More below.

There used to be a time when the opposite was the case; Republicans could usually count on Pennsylvania turning up in their column. If, by chance, the state didn’t go red – well, it didn’t really matter, because they were probably losing a landslide anyways.

This state of affairs ended in 1952.

Photobucket

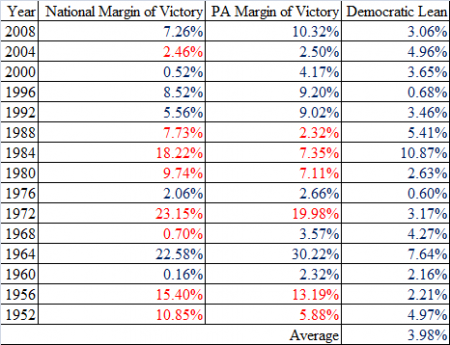
Since then Pennsylvania has been an average of four percent more Democratic than the nation at large. Structurally, the state is a tough nut for Republicans to crack – tougher than most Republican strategists realize. There are several very tall obstacles a Republican must overcome to win.

The first is Philadelphia, a very big and very Democratic city. The second is Pittsburgh, another fairly big and Democratic-leaning city. Either Republicans must do well in Philly and Pittsburgh, or they must overcome their margins elsewhere. The first option is a non-starter; most Republicans don’t even try winning big cities anymore. Twenty years ago, Republicans could use Philadelphia’s suburbs to balance Democratic margins from the city itself (that was how George H. W. Bush won the state). Not anymore: the suburbs voted Democratic for the past five elections. Republican candidates are therefore forced to rely on exurban and rural votes along the “T” and – sometimes, but not often – in the dying industrial west.

So Republicans are in trouble right off the bat in Pennsylvania.

–Inoljt, http://mypolitikal.com/
The Modern Electoral Map

By: Inoljt, http://thepolitikalblog.wordpr…


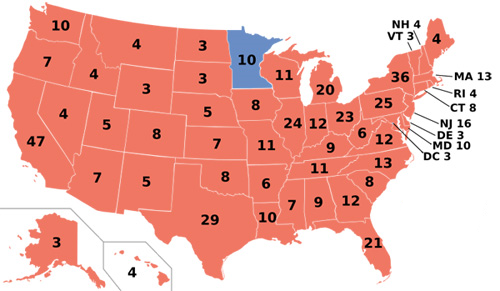
Some of you may recognize this map.

Photobucket

For those who don’t, this is Ronald Reagan’s landslide election over his hapless opponent Walter Mondale.

Unfortunately, for those who look for political trends, this map hides more than it reveals. For example, Reagan wins Massachusetts, but reasonable people would agree that Massachusetts is normally a Democratic state.

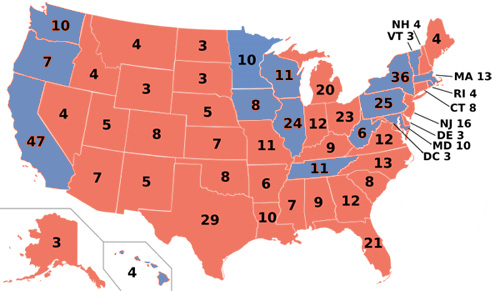
Here is a more revealing map.

Photobucket

You probably don’t recognize this map. There’s a good reason for that – there’s never been a presidential election with the above results.

More below the flip.

In fact, the previous electoral college is what would have happened if Walter Mondale and Ronald Reagan won an equal share of votes. The blue states are those in which Reagan won with less than 18.2%, the exact amount by which he beat Mondale.

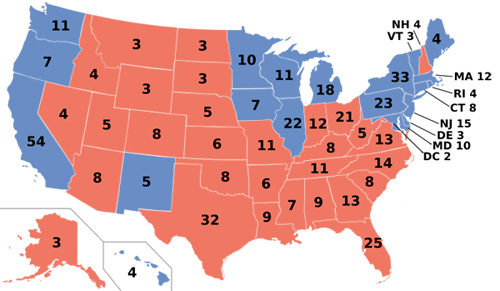
This map bears an eerie resemblance to today’s electoral maps. For example, here is the 2000 presidential election, in which Bush and Gore effectively ran to a dead heat.

Photobucket

There have been some changes since Reagan’s time. The Northeast has been turning blue; it is much harder today for Republicans to win a state like New Jersey or Maine. California has also been changing; Reagan would have lost it by only 2% in the hypothetical. To compensate, Appalachia has been moving the other direction; Democrats are hard-pressed to turn Tennessee and West Virginia blue nowadays. Places like Missouri and Kentucky were less than 3% redder than the nation in 1984. That was not the case last November.

By and large, however, what is striking is the degree to which the electoral maps look alike. For all the talk  nowadays about blue states turning red and red states turning blue, much more has remained the same than has changed. Democrats do well in the Pacific Coast, the Midwest, and the Northeast; Republicans do well in the Mountain West, the Plains, and the South. The Democratic and Republican coalitions remain much the same as they were two decades ago.

Ohio, Part 4

By: http://thepolitikalblog.wordpr…

This is the last part of my review of the swing state Ohio.

Republican Ohio

What parts of Ohio vote Republican?

All of it, of course, except for the parts that vote Democratic.

That is a pretty facetious answer to a fairly serious question, but there is something to it. Blue Ohio has a set of defined, separate characteristics. Red Ohio does too, but not to the same degree. It is far easier to describe Democratic Ohio than Republican Ohio.

The following map is a good beginning in exploring Republican Ohio.

Photobucket

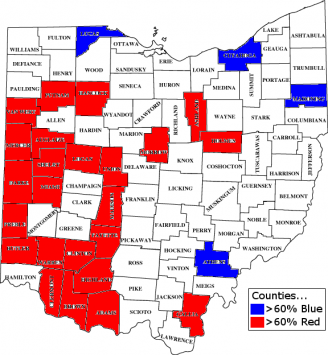
These are the places which most heavily supported John McCain (for those who are curious, the most Democratic counties were Cleveland, Toledo, Ohio University, and Youngstown). They are located primarily in the southwestern portion of the state, away from the Democratic ‘7’. Interestingly, practically none are part of Appalachia – considered Obama’s weakest region in the country.

Southwest Ohio historically – and to this day remains – the most conservative part of Ohio. Geographically, it is the Republican base; even in Democratic landslides, it often will vote for the red candidate.

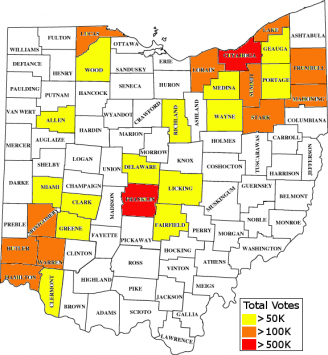
There is another trait the highlighted counties have in common: most are semirural and somewhat less populated. Another map helpfully illustrates this.

Photobucket

Compare the two maps. Very few of the counties in which John McCain took over 60% of the vote were populated enough to appear on the above map. There is very little overlap between the reddest parts of Ohio and the densest parts of Ohio – except, importantly, the suburbs of Cincinnati.

More below the flip.

This does not mean, however, that all counties with over fifty thousand votes went blue. Quite the opposite, in fact: many of the yellow counties voted for McCain. Only counties with over one hundred thousand votes tread Democratic. Take a look:

Photobucket

What does this mean?

The yellow counties are an imperfect representation of what famously cost John Kerry the state: the exurban reaches of Ohio, especially in Columbus and Cincinnati. Most of them are well-off and home to middle-class folk, like exurbs in general. White flight played an important role in their formation (although it was not, as some maintain, the biggest motivator). Both McCain and Bush got their largest margins from these places; they constitute an important – perhaps the most important – block of the GOP coalition today.

This has not always been the case. Before 2000, Hamilton County (Cincinnati) tended to give Republican candidates their biggest margins in the state. Today, it has been replaced by the surrounding counties, rapidly growing exurban communities. Nevertheless, Hamilton County remains a reliable Republican stronghold.

Contrary to popular perception, the city Cincinnati itself is not that conservative (not anymore); its deep red suburbs account for the county’s Republican lean. Cities in general never vote Republican, but in GOP strongholds – like Cincinnati – the overwhelmingly red suburban vote outweighs their Democratic lean.

For a visual illustration of Cincinnati’s importance, here is how George Bush did in Ohio:

Photobucket

Cincinnati and its surrounding exurbs provide the largest Republican margins. The exurbs of Columbus are going heavily Republican; so is much of eastern Ohio.

Note, however, that George Bush only won the state by 3.5%. Unfortunately the Times does not have maps of stronger Republican victories (e.g. 1988, 1980).

How has the Republican base changed since 2000? The following map provides a sense of how things stand today.

Photobucket

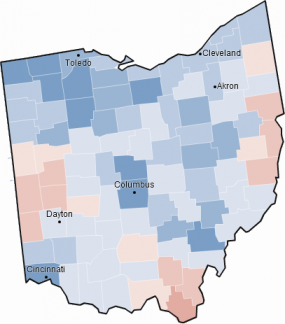
There is not too much to show. One can see a coherent north-south divide; northern Ohio has become more Democratic, southern Ohio less so. Most of the rural southwest is fairly lukewarm to Obama – but so is the blue east. Interestingly, the exurbs seem to have moved Democratic more than their rural brethren. Note that most counties are blue because the country as a whole voted more Democratic in 2008.

It is difficult to tell how much of this is permanent and how much was specific to 2008. Perhaps the exurban counties were only bluer because of the housing crisis. Certainly a place like Cincinnati (with its large black population) voted for Obama as a person, not the Democratic party. Then again, maybe not; the county supported Bush ’04 by only 5%.

But as a whole, red Ohio seems to vote the same way it has for the past few years (or generations). Neither it nor the Ohio Republican Party has changed much in recent years. The same cannot be said for the Democrats.