IN, NC & OH Primary Results Thread

Polls have now closed in all three states with primaries tonight: Indiana, North Carolina, and Ohio.

RESULTS


9:51PM: Well, this thread is getting a bit obese. Let’s move this discussion over here.

9:45PM: Get ready for a runoff between Elaine Marshall (37%) and DSCC fave Cal Cunningham (27%) in North Carolina.

9:43PM: With half the vote in, Krikorian leads Yalamanchili by 40-34.

9:38PM: So, er, looks like we jumped to conclusions a bit in IN-09 – Hankins is now fewer than 300 votes behind Young. But it still looks like Young is favored.

9:37PM: Risk loses Kamchatka. The AP calls IN-08 for Larry Bucshon. (Hey teabaggers — vote for Trent out of spite!)

9:35PM: The AP calls OH-02 for Jean Schmidt. She scored 62% of the vote this time.

9:33PM: Unreal. Looks like Dan Burton is gonna live again — he’s at 29.7% of the vote, just over 2000 votes head of Luke Messer with 4 precincts outstanding. What a pathetic showing for Burton!

9:25PM: Despite Travis Hankins’ exciting late surge, Todd Young has pulled away with an almost 2K vote lead. Less than 10% of the vote is outstanding, which means that fewer than 5K more ballots are still out there. Almost impossible to make up that gap. (And incidentally, Mike Sodrel pulled back into second place.)

9:22PM: Elaine Marshall’s share of the vote keeps slipping downward. She’s now just above 37%.

9:09PM: With 477 of 587 precincts in, Todd Young leads Travis Hankins by 225 votes in IN-09.

9:03PM: With 9.5% of the vote in, Lee Fisher leads Jennifer Brunner by 56-44.

9:00PM: I note that Dan Coats won his nomination with about the same percentage as Alexi Giannoulias won his.

8:53PM: Whoa, check out IN-09 — Young leads teabagger Travis Hankins by 34-33, with 30% for Sodrel. Still about a fifth of the vote left to count there.

8:51PM: Risk is now back up by 31-29 in IN-08, but there are still 71 Bucshon-friendly precincts outstanding in Evansville left to count.

8:49PM: Whoa mama joe! In Ohio, it’s still 52-48 Fisher with 7% of the vote in.

8:47PM: Worth noting: Neither Kissell nor Shuler’s primary opponent filed an FEC report, and Shuler’s guy doesn’t even have a contribution link on his website.

8:46PM: The problem for Dan Burton? He has no strongholds left, and his Hamilton County performance is quite weak. This should be very close.

8:45PM: Buschon now up by 31-30 based on his strength in Evansville. 2/3rds of the vote now in.

8:43PM: Almost 2/3rds of the votes are now counted in IN-05, and Burton leads Messer by 31-28. The Hamilton County votes, which are starting to come in now, are split 25-25-25 for Burton, Messer, and McGoff.

8:41PM: The AP calls the Indiana Senate primary for Dan Coats.

8:41PM: Note that both Shuler and Kissell voted against healthcare — are we seeing some fallout there?

8:38PM: NC-11: And Heath Shuler is up just 57-43 against Aixa Wilson.

8:37PM: NC-08: Dem Rep. Larry Kissell up just 60-40 against challenger from the left with 15% in.

8:36PM: A bit over half of the vote is in, and Dan Burton leads Luke Messer by 32-30.

8:29PM: Risk only up 12 votes in IN-08, 30-30, she’ll continue to lose ground as more of Vanderburgh County comes in.

8:26PM: Harold Johnson leads D’Annuzio by 35-34 in NC-08. Looks like a runoff is a live possibility here.

8:25PM: Now that a bit over a quarter of the vote is in, Elaine Marshall leads Cal Cunningham by 38-28. Ken Lewis is at 15.

8:22PM: With a bit over half the vote counted in IN-09, Young leads Sodrel by 37-31, while teabagger Travis Hankins is close behind with 29%.

8:21PM: Teabagger Kristi Risk now only leads Buschon by 300 votes in IN-08, now that Evansville (Buschon’s home base) is starting to report.

8:19PM: In NC-08, Harold Johnson leads businessman Tim D’Annuzio by 37-34. Looks like that’s just the early vote, though.

8:18PM: NC-10: McHenry comfortably ahead with a small number of votes in, 60-25.

8:16PM: Check out OH-16, where Matt Miller is leading NRCC fave Jim Renacci by 72-23 thanks to some early votes in in Ashland, his home county.

8:13PM: The bean counters at SSP labs think that a runoff is likely in North Carolina. There’s a huge chunk of eastern NC that’s largely African-American where Ken Lewis is going to do better than he’s been doing right now, as well as Durham/Mecklenburg counties outstanding.

8:11PM: With under half of the vote in, teabagger Kristi Risk leads DC-backed surgeon Larry Buschon by 31-26. Wow!

8:10PM: The AP has called IN-02 for Wacky Jackie Walorski.

8:09PM: IN-09: Todd Young leads Mike Sodrel 38-33, with Travis Hankins back at 26.

8:08PM: In North Carolina, the Senate race is now 39M-27C-16L, but as Tom Jensen points out, the minor candidates may force this into a runoff.

8:04PM: With just 11 precincts in (but also a big chunk of votes in from Franklin County), Fisher leads Brunner by 52-48 in Ohio.

8:00PM: The AP has declared GOP Rep. Mark Souder the winner of his primary. I’m kind of surprised!

7:57PM: Dan Burton is in a very tight race. With 40% in, he leads Messer by 33-31.

7:56PM: IN-04: Rokita crushing 45-18 with about a third of the vote in.

7:56PM: IN-03: Souder very likely to hold on – 49-34 with 72% in.

7:55PM: IN-02: Wacky Jackie now up 57-31 with 43% in.

7:48PM: With the early vote in North Carolina in, Elaine Marshall leads Cal Cunningham by 39.5% to 26%.

7:42PM: Kristi Risk now ahead by just 15 votes in IN-08 (216 of 635 precincts reporting).

7:40PM: With 28% of precincts in statewide, Dan Coats leads Marlin Stutzman by 42%-30%.

Indiana, North Carolina, Ohio & Utah Primary/Convention Preview

The primary season gets underway in earnest this week, with contests in Indiana, North Carolina, and Ohio tomorrow. Additionally, Utah’s state GOP convention is on Saturday. Also note that North Carolina has a top-two run-off (scheduled for June 22nd) for any races where the leading candidate fails to clear 40% in the first round. (For a complete primary & run-off calendar, click here.)  Below is a roundup of some of the key races to watch for:

Indiana:

  • IN-Sen (R): This may well be the most interesting primary on Tuesday. It’s a true ground zero face-off between the establishment and the teabaggers. In one corner is Dan Coats, who couldn’t get more bougie if he tried. Not only is he a former Senator, he’s spent the last decade as a Washington lobbyist for a host of unsavory clients. In the other corner… well, there are two corners. One is occupied by certified nutball ex-Rep. John Hostettler, who is as allergic to raising money as he is to sanity. The latter quality has endeared him to the base, but the former is a big obstacle to, well, winning. Which leaves state Sen. Marlin Stutzman, who has been eating a good portion of Hostettler’s lunch – among other things, he’s secured the endorsement of Jim DeMint, the patron saint of hopeless right-wing primary candidates. There’s been precious little polling of the race, but what we’ve seen indeed suggests that Stutzman and Hostettler are splitting the crazies, which could allow Coats to sneak through with a very underwhelming vote total. This is one of those races where it’s just hard for a Democrat to say who we’d be better off with as our opponent – they’re all great! (David)
  • IN-02 (R): Most people have assumed that state Rep. Jackie Walorski – “Wacky Jackie” to those who know her best – will be the GOP’s nominee in the 2nd, as she was the NRCC’s prize pick and she’s well-known (as a former local TV news reporter and a member of GOP leadership in the state House). She still faces a challenge from Jack Jordan, the president of the Bremen school board. Despite a long stint as an executive at local pharma company Eli Lilly, Jordan seems to be working the angry average-guy angle, and if there’s a year to be doing that, it’s this year. (Crisitunity)
  • IN-03 (R): Republican incumbent Mark Souder, a notorious under-performer in this deeply Republican district, may finally be running out of rope. A recent SUSA poll only gave Souder a 35-29 edge over auto dealer Bob Thomas, with attorney and former Dan Coats staffer Phil Troyer gobbling up nearly 20%. One way or the other, though, Souder’s time in Congress is rapidly coming to a close — he recently told Brian Howey that he’s strongly inclined to retire in 2012 if he survives this dogfight. The winner of this pie fight gets to face ’06 Democratic nominee Tom Hayhurst, a physician and former Fort Wayne city councilor. (James)
  • IN-04 (R): With incumbent Republican Steve Buyer making this term his last in this deeply Republican suburban donut district, the GOP primary is where it’s at. Secretary of State Todd Rokita may think he has control of the two turntables and the microphone in this race, but state Sen. Brandt Hershman has been raising a respectable sum of cash – and has Buyer’s endorsement. State Sen. Mike Young is also in the mix, but his fundraising is barely existent. (J)
  • IN-05 (R): If there was ever a year to give GOP Rep. Dan Burton’s ass the boot, it’s this one. After winning a surprisingly close primary contest against former Marion County Coroner John McGoff, four viable Republicans have stepped up to challenge Burton this year – including McGoff again. Joining them are state Rep. Mike Murphy, ex-state Rep. Luke Messer, and former Dan Quayle/Dan Coats staffer Brose McVey. With a field chopped up in so many ways, Burton just may survive. (J)
  • IN-08 (R): Republicans were caught off guard in this district after Democrats managed to beam up incumbent Rep. Brad Ellsworth to the Senate race, and they lack a well-known name to take advantage of this open seat. However, NRCC-types like surgeon Larry Buschon, who has managed to bank a decent amount of coin for his bid. However, he’ll have to fight through a field crowded with seven other candidates, including teabagger fave Kristi Risk. The theory swirling around the tubes is that, since this district is ground zero for John Hostettler nut-wing Republicans, Hoss’s Senate campaign may excite enough ‘baggers to threaten Buschon. It’d be surprisng if this one plays out that way, though. (J)
  • IN-09 (R): Douchebag ex-Rep. Mike Sodrel is making his fifth crack at this seat, but he’s facing somewhat stiff competition in the primary from attorney Todd Young, who seems to be the favorite of an establishment tired of the retread Sodrel. Also waiting in the wings is teabagger Travis Hankins, who has raised enough scrilla to keep himself in the game. (J)

North Carolina:

  • NC-Sen (D): North Carolina Democrats will head to the polls to give either Secretary of State Elaine Marshall, ex-state Sen. Cal Cunningham, and attorney Ken Lewis the right to take on anonymous frosh GOP Sen. Richard Burr in November. One of these candidates will need to break the 40% barrier in order to avoid a June runoff. While no one has polled close to that marker yet, local boy Tom Jensen is betting that one of Cunningham (the man with the money) or Marshall (the name you know) will cross that barrier. (J)
  • NC-08 (R): Republicans have been licking their chops over the chance to dethrone Larry Kissell after just one term in the House, but their field of candidates is decidedly second-tier. Businessman Tim d’Annunzio has spent nearly $1 million, making him something of a favorite – but he’s also racked up a long list of unflattering incidents on the campaign trail that suggest his campaign, though well-funded, is completely unhinged. D’Annuzio will face ex-sportscaster Harold Johnson, retired Army Col. Lou Huddleston, and engineer Hal Jordan in the primary. It wouldn’t be a shock to see this one go to a runoff. (J)
  • NC-11 (R): This one may not rank very highly on the GOP’s target list, but Republicans have a number of warm bodies in the race against sophomore Dem Rep. Heath Shuler, in case things get interesting. Businessman Jeff Miller and ophthalmologist Dan Eichenbaum have both spent over $100K on their campaigns as of mid-April, while Hendersonville Mayor Greg Newman is running on spare change and a pocketful of dreams. (J)

Ohio:

  • OH-Sen (D): Two Democrats are fighting for the right to take on Republican Rob Portman, the former congressman and Bush budget director: Lt. Gov. Lee Fisher and Secretary of State Jennifer Brunner. Fisher, who’s enjoyed a sizable fundraising edge as well as support from the DSCC, has seen his lead expand a good deal in recent public polling. Turnout will probably be low, which always increases unpredictability, so it may not be quite a done deal – but Fisher is looking pretty good. (D)
  • OH-02 (D): The choice for Dems is between Surya Yalamanchili, a former star of the reality show “Apprentice,” and novelty playing-cards mogul David Krikorian, who took 18% as an independent in 2008. “Chili,” as he is known, has not raised very much but appears to have consolidated the support of much of the local establishment (including endorsements from the past two Dem nominees in the district, Vic Wulsin and Paul Hackett). Meanwhile, Krikorian (a self-described “Reagan conservative”) seems to have ticked a few people off and apparently mocked his opponent’s name at a recent campaign event. Not pretty. (D)
  • OH-02 (R): Jean Schmidt, who hasn’t been in Congress all that long, has faced serious primary challenges in both of her re-election campaigns, escaping by just 5% in 2006 and a somewhat more respectable 18% in 2008. Part of the reason Schmidt survived both times is because of the split field facing her. The same is true this year. Warren County commissioner Mike Kilburn is probably Schmidt’s most legitimate challenger, but Some Dudes Debbi Alsfelder and Tim Martz are also in the race. Kilburn has only raised $30K, though, while Schmidt has spent more than $400 grand. Still, with anti-incumbent sentiment running as high as it has in ages, and with Schmidt being Schmidt, I suppose you never know. (D)
  • OH-16 (R): Businessman and former smalltown mayor Jim Renacci is the NRCC’s favorite here, and he’s raised over half a million to date (plus he’s given himself a $120K loan). But he’s facing a challenge from his right in the form of Matt Miller, a former Ashland County Commissioner. Miller is no run-of-the-mill teabagger. In 2006, he pulled in 42% of the vote against incumbent Rep. Ralph Regula (who was running what would be his last race). And in 2008, with the seat open, Miller came within 5 points of snatching the nomination from establishment-preferred state Sen. Kirk Schuring. Against this history, Renacci has already spent $500K to Miller’s tiny $24K. An upset is a definite possibility here. The winner takes on freshman Rep. John Boccierri. (D)
  • OH-18 (R): In a somewhat similar scenario, state Sen. Bob Gibbs is the GOP bigs’ favorite to challenge sophomore Rep. Zack Space. Classically, this means that Gibbs is hated by the teabag set, and he faces some real opposition, especially given his un-awesome fundraising. Fred Dailey, the 2008 nominee who got splattered by Space 60-40, is running, and he’s been howling loudly about the alleged “favoritism” the establishment has shown toward Gibbs. The other notable candidate is Jeanette Moll, who lost to Dailey in the primary last cycle and has run radio ads attacking Gibbs as a tax-increasing libruhl. Both this race and the contest in the 16th CD ought to provide an interesting read on how big the split really is between the grassroots and the powers-that-be in the Republican Party. (D)

Utah:

  • UT-Sen (R): Saturday is D-Day for Bob Bennett, who seems poised to become the first incumbent member of the Senate to fall this year. Oddly, though, the voters may not even get to take the chance to take their anger out on him, because he may not be able to make it out of the state Republican convention onto the primary ballot. In fact, Bennett would probably prefer that the broader population of primary voters, rather than the right-wing activists who dominate the convention, decide his fate. That’s because a variety of polls of convention delegates suggest that Bennett will be hard pressed to even make it to the final round of balloting (where Mike Lee and Tim Bridgewater seem to poll better). And even if Bennett somehow does make it to the final round against Lee, Lee is likely to consolidate all the anti-Bennett votes and clear the 60% mark needed to nail down the GOP nomination without a primary. Bennett is by no means a moderate, but he’s guilty of occasionally trying to legislate in conjunction with Democrats, which in this climate means he’s likely to get his walking papers. (C)

    SSP Daily Digest: 4/27 (Morning Edition)

  • KY-Sen: Obnoxious theocrat James Dobson is endorsing establishment dude Trey Grayson over weirdo Rand Paul. It feels like it’s gotten late early around here, with Grayson badly trailing in the last few polls, so you gotta wonder whether this or anything else can make much of a difference.
  • NV-Sen: According to Reid Wilson, the Tea Party Express (the political action wing, such as it is, of the teabaggers) says they’ll spend $100 to $150K on behalf of wingnut favorite Sharron Angle. Angle’s trailed pretty badly in most polling, though.
  • OH-Sen: With Ohio’s primary around the corner, the Hotline is reporting that the DSCC will apparently step into the race on Lee Fisher’s behalf. The not-terribly-well-funded Fisher is facing off against the almost-penniless Jennifer Brunner, but apparently Bob Menendez doesn’t want to take any chances.
  • WI-Sen: One-time beer baron Dick Leinenkugel officially decided to join the now-crowded GOP field hoping to take on Sen. Russ Feingold. Leinenkugel’s chief problem appears to be the fact that he just resigned as the governor’s Commerce Secretary… and the governor of Wisconsin is Jim Doyle, a Democrat. The Kugel’s new opponents were, needless to say, quick to point this out.
  • AZ-Gov: A couple of tidbits from a PPP poll that is slated to be released later today:
  • • Brewer has seen a significant improvement in her job approval numbers with Republicans. When we looked at the state in September she was under water even with voters of her own party, as 37% of them expressed disapproval of her job performance while only 28% felt she was doing a good job. Now 54% of Republicans approve of her and only 27% disapprove, so she’s seen a good deal of improvement on that front, which should be particularly helpful for her prospects of winning nomination for a full term against a crowded field of primary opponents.

    • At the same time Democratic candidate Terry Goddard leads Brewer 71-25 with Hispanics. That may seem ho hum, but consider this: Barack Obama only won Hispanic voters in the state by a 56-41 margin. So Goddard’s outperforming him by more than 30 points there. And on our September poll Goddard was up just 53-33 with Hispanics so it’s a 26 point improvement on the margin even relative to that.

  • FL-22: Combustible Republican Allen West is flashing an internal poll (from Wilson Research Strategies) which allegedly has him up 44-42 over incumbent Dem Ron Klein.
  • IN-09: Todd Young, seeking the GOP nod against ultra-retread Mike Sodrel, has a new ad up on TV, trying to paint himself as the “true conservative” choice. To CQ’s credit, they asked how much is being spent on the ad. To the Young campaign’s discredit, they declined to say.
  • MI-01: The Republican field in this race is getting’ mighty crowded here, too. GOP state Sen. Jason Allen, who is term-limited, is the latest to seek the Republican nod to replace Bart Stupak.
  • Fundraising: CQ has a handy chart of pre-primary fundraising filings in the three states which have primaries next week: Indiana, North Carolina, and Ohio.
  • Immigration: The Hill surveys the races out West where Arizona’s new immigration law may bolster Latino turnout – and help Dems. Jon Ralston notes that Brian Sandoval, the GOP’s would-be savior in the NV-Gov race, has come out in favor of the law. This could all get very ugly – well, even uglier than it already is.
  • SSP Daily Digest: 4/9 (Morning Edition)

  • FL-Sen: It’s official: Charlie Crist wants to lose. He definitively says he won’t run as an independent, “once and for all.” Given the way his statement is worded, though, he could still run as a Democrat.
  • KY-Sen: Is the Rand Paul money train slowing down? Trey Grayson raised $733K in Q1, topping Paul’s $630K. Given that Paul is the only Paulist running much of a campaign this cycle, I’m wondering why his freakazoid coterie hasn’t raised more for him. What’s more, Grayson is touting an internal poll from Jan van Lohuizen showing him with a narrow 39-37 primary lead – the first time we’ve seen a good poll for Grayson in some time. This is a case when I’d expect Paul to produce a dueling internal – if he has a decent one.
  • NV-Sen: I got awful tired of this kind of story after Mark Sanford managed not to resign despite multiple stories, week after week, of people “pressuring” him to quit. So the fact that a couple of Republican semi-bigs in NV want John Ensign to go don’t impress-a me much. You want to get someone to drop out, you need to threaten to support a credible primary challenger and cut off their fundraising. And hell, even that doesn’t always work. (Just look at Gov. Jim Gibbons!)
  • UT-Sen: Looks like Sen. Bob Bennett is ignoring his job in order to try and save it. Congress is on a recess right now and will reconvene next week, but Bennett is going to stay behind in Utah to campaign until the May 8th GOP caucus. While Bennett probably can’t get the 60% of convention votes he would need to secure the Republican nomination, he can try to block someone else from doing so, thus forcing a primary in June.
  • FL-Gov: Alex Sink has parted ways with her campaign manager, Paul Dunn, who came on board last year after managing Rep. Suzanne Kosmas’s 2008 campaign. “Longtime Sink confidante” Jim Cassady will take over the helm.
  • CA-36: Marcy Winograd, challenging Rep. Jane Harman in the primary, succeeded in denying Harman the “pre-endorsement” of the California Democratic Party by collecting 300 delegate signatures. Now the fight for the party’s endorsement goes to the floor of the state convention, which meets in L.A. next week. Winograd can still fight on to the June primary regardless of what happens with the endorsement, though.
  • GA-08: Some Paulist is dropping out of the GOP primary to spend more time with her gold bullion. Valerie Meyers says she won’t continue in the race to challenge Dem Rep. Jim Marshall. WMAZ (click the link) has a good primer on who else is still in the running.
  • HI-01: The Asian American Action Fund, a pro-Dem group, is slamming the DCCC for getting involved in the race, and particularly for siding with the white guy. The organization isn’t hesitating to point out that Hawaii’s 1st CD is 58% Asian and Pacific Islander. Meanwhile, Republican Charles Djou is – as James Hell envisaged – attacking the DCCC as a “mainland group” and criticizing its “outside interference.” If Djou’s framing takes hold, it’s possible that both Colleen Hanabusa and Ed Case will get tainted as a result. That would be just great – and eminently predictable. (BTW, Hanabusa says she raised $450K in Q1.)
  • PA-04: Labor leader Jack Shea, who had been considering a write-in or independent challenge to Dem Rep. Jason Altmire on account of his vote against healthcare reform, has decided against a run.
  • PA-08: Zoiks! Republican Mike Fitzpatrick’s campaign tells PoliticsPA that they raised $500K in just two months. Fitzpatrick is trying to win his seat back from Rep. Patrick Murphy.
  • PA-12: A source tells the Hill that the NRCC plans to go up with some TV ads in the special election to fill Jack Murtha’s seat. Aaron Blake recites my favorite line, though: “There is no indication as to the size of the NRCC buy.” They’ll have to file an independent expenditure report soon enough, though (if this buy is for real).
  • TN-08: Somewhere in the Sonoran Desert, John McCain’s head just exploded. That’s because one Robert Kirkland just filed an independent expenditure report… on behalf of his brother, Ronald. What hath McCain-Feingold wrought? Now these two can’t even speak to one another at the family Fourth of July barbecue!
  • WV-01: Some fundraising numbers from Republican candidates in West Virginia. David McKinley says he’s raised $300K, while Sarah Minear has raised $272K (but a quarter mil of that was a self-loan). Mac Warner, a third candidate, hasn’t released any nums yet.
  • North Carolina: SEIU says it’s trying to form a new third party in NC, called North Carolina First, with the goal of running candidates in this fall’s elections. The Tarheel State is home to three Dems who voted “no” on healthcare reform: Heath Shuler, Mike McIntyre and Larry Kissell. SSP rates Shuler and Kissell as Likely Dem and McIntyre as Safe Dem, but a third-party challenge from the left could of course alter that calculus.
  • Data: A new site called Transparency Data is offering contributor data for the last twenty years… for federal and state races. Looks like a good one to bookmark.
  • Redistricting North Carolina (w/ data)

    Well I really liked Johnny Longtorso’s map of North Carolina, so I decided to expand on that and create a similar map while figuring out the partisan data for each district. Nothing fancy, just county level voting for the 2008 election. The map is 9-4-1, either 9-5 or 10-4 depending on whether a Democrat can defeat Myrick.

    Unfortunately, according to the new census report North Carolina will probably not get a 14th district. Plus it probably violates VRA, but it’s an example of how the VRA hurts Democrats in redistricting. So this map is a bit useless, but I like it.  

    Congressional District 1: Butterfield (D)

    County Obama Vote McCain Vote
    Vance 13,166 7,606
    Warren 7,086 3,063
    Franklin 13,085 13,273
    Nash 23,099 23,728
    Wilson* 19,652 17,375
    Greene 3,796 4,272
    Edgecombe 17,403 8,445
    Halifax 16,047 8,961
    Northampton 6,903 3,671
    Hertford 7,513 3,089
    Gates 2,830 2,547
    Bertie 6,365 3,376
    Martin 6,539 5,957
    Pitt 40,501 33,927
    Washington*
    Total 183,985 139,290
    New % 56.91%
    Old % 62.72%

    This is now a 41% Black district (still majority minority) down from 50.6%. And probably a violation of the VRA. Butterfield Got 70.28% in the old district. Likely Democratic (Safe with Butterfield).

    Congressional District 2: Etheridge (D)

    County Obama Vote McCain Vote
    Harnett 16,785 23,579
    Johnston 26,795 43,622
    Wake* 110,410 76,809
    Wilson*
    Total 153,990 144,010
    New % 51.67%
    Old % 52.33%

    Leans Democratic. (Safe with Etheridge).

    Congressional District 3: Jones (R)

    County Obama Vote McCain Vote
    Brunswick 21,331 30,753
    Onslow 19,499 30,278
    Craven 19,352 24,901
    Carteret 11,130 23,131
    Pamlico 2,838 3,823
    Beaufort 9,454 13,460
    Hyde 1,241 1,212
    Dare 8,074 9,745
    Tyrrell 933 960
    Washington 3,748 2,670
    Chowan 3,688 3,773
    Perquimans 2,772 3,678
    Camden 1,597 3,140
    Pasquotank 10,272 7,778
    Currituck 3,737 7,234
    Pender* 9,907 13,618
    New Hanover* 49,145 50,544
    Total* 119,666 166,536
    New % 38.14%
    Old % 41.81%

    District 3 basically gets all the Republican friendly coastal counties in one district. It’s also is the most visually gerrymandered district as it avoids taking Wilmington from the the 7th district. Safe Republican.

    Congressional District 4: Price (D)

    County Obama Vote McCain Vote
    Alamance 28,918 34,859
    Orange 53,806 20,266
    Durham 103,456 32,353
    Chatham 17,862 14,668
    Lee 10,784 12,775
    Total 214,826 114,921
    New % 65.15%
    Old % 63.32%

    District consists of Durham, Chapel Hill, and Burlington. Looses parts of Wake, gains the entirety of Almanace, Chatham and Lee counties. It’s a very compact district and keeps all the counties together, but I think that there are a bit too many Democrats in this district (I’d aim for more around 60%). Safe Democratic.

    Congressional District 5: Foxx (R)

    County Obama Vote McCain Vote
    Mitchell 2,238 5,499
    Avery 2,178 5,681
    Watauga 14,558 13,344
    Caldwell 12,081 22,526
    Alexander 5,167 11,790
    Iredell 27,318 45,148
    Wilkes 8,934 20,288
    Ashe 4,872 7,916
    Alleghany 2,021 3,124
    Surry 10,475 18,730
    Yadkin 4,527 12,409
    Davie 6,178 13,981
    Stokes 6,875 14,488
    Total 107,422 194,924
    New % 35.53%
    Old % 39.37%

    Ugh. So this one really hurt as I passionately hate Virginia Foxx. So that’s probably the best news about this map being ruined with North Carolina only getting 13 districts. Hopefully more  Republican areas can get eaten up by 10th district and Winston-Salem can be incorporated into the 5th to make at least a 45%+ area where Foxx shouldn’t be able to win. As it stands, this Northwestern congressional district is Obama’s worst district aptly home to batshit insane Foxx. Safe Republcian.

    Congressional District 6: Coble(R)

    County Obama Vote McCain Vote
    Rowan 23,391 37,451
    Davidson 22,433 45,419
    Randolph 16,414 40,998
    Rockingham* 17,255 23,899
    Guilford* 45,000 45,000
    Guilford* 142,101 97,718
    Total* 124,493 192,767
    New % 39.24%
    Old % 36.52%

    Without the 14th district, this too probably will get more Democratic as it will get Greensboro and cede some Republican area to the too Democratic 4th district. But as it stands it is Safe Republican.

    Congressional District 7: McIntyre(D)

    County Obama Vote McCain Vote
    Columbus 11,076 12,994
    Bladen 7,853 7,532
    Duplin 8,958 10,834
    Sampson 11,836 14,038
    Lenoir 13,378 13,401
    Wayne 22,671 26,952
    Jones 2,378 2,817
    Pender* 9,907 13,618
    New Hanover* 49,145 50,544
    Cumberland* 15,400 10,000
    Total 152,602 162,730
    New % 48.39%
    Old % 47.20%

    Considering that this is a McCain district, I made sure that I kept all of McIntyre’s base intact I gave most of Robeson County to the 8th to strengthen Kissell, though I attempted to snake McIntyre’s home (Lumberton) into the district.  This district is a percentage better than before. My reason for adding the rest of Sampson, all of Lenoir and Wayne is because while the counties are all either Republican or Tossup, they all seem like McIntyre can do well and build a Democratic base in.

    Since from what I can see Generic Democrat did about 3% better than Obama this district is Tossup Democratic. (Safe for McIntyre).

    Congressional District 8: Kissell(D)

    County Obama Vote McCain Vote
    Total 138,448 118,982
    Anson 6,456 4,207
    Montgomery 4,926 6,155
    Richmond 9,713 9,424
    Moore 17,624 27,314
    Scotland 8,151 6,005
    Hoke 9,227 6,293
    Robeson 23,058 17,433
    Cumberland* 59,293 42,151
    Total 138,448 118,982
    New % 53.78%
    Old % 52.96%

    I made Kissell’s district a bit more Democratic by  grabbing more of Fayetteville and Robeson and Republican Moore, but loosing all the Republican territory in Cabarrus, Stanly, and Union and Republican part of Mecklenburg (Charlotte) which he lost 34.7k to 46.4k. This is now Leans to  Likely Democratic.

    Congressional District 9: Myrick (R)

    County Obama Vote McCain Vote
    Union 31,189 54,123
    Stanly 8,878 19,329
    Cabarrus 31,546 45,924
    Mecklenburg* 76,958 30,848
    Total 148,571 150,224
    New % 49.72%
    Old % 45.11%

    This is a pretty spiteful gerrymander specifically to get rid of Myrick  

    The Solid South

    By: Inoljt, http://thepolitikalblog.wordpr…

    It is a popular today to say that the South has switched from voting Democratic to Republican. Many people are fond of looking at previous electoral maps. Hey, isn’t that funny – the states have completely switched parties. It’s like the Republicans have recreated the Solid South.

    That statement is unequivocally false. Most people have no idea how unbelievably Democratic the Solid South was. For half a century, Democrats in the Deep South did about as well as the Communist Party did in Soviet Union elections.

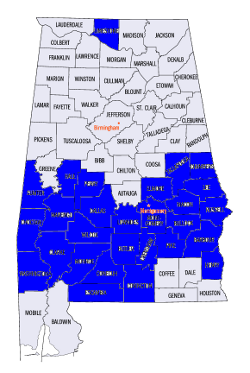
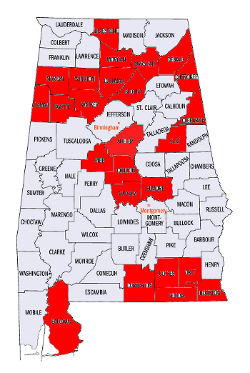
    Let’s take a look at a model Republican southern state: Alabama. John McCain won 60.32% of the vote here, his second best showing in the South. Below are the counties in which Mr. McCain won over 70% of the vote (all my statistics below are from http://www.uselectionatlas.org/ – an amazing website).

    Photobucket

    That’s a lot of counties. The Republicans are doing quite well – about as well as the Democrats used to do in Alabama, many would say.

    Here is another map, filled with blue counties.

    It is the 1940 presidential election. I invite you to guess – what do these blue counties represent? Counties in which Roosevelt won over 70% of the vote? 80%? 90%? Remember, Roosevelt was quite a popular guy. He must have done pretty well in Alabama, part of the Solid South.

    Photobucket

    Continued below the flip.

    In fact, the blue counties are those in which Roosevelt won over 95% of the vote in 1940. In all, he won 85.22% of the good folk of Alabama.

    Those are incredible numbers. If today that result occurred, we would all cry fraud.

    Of course, fraud – of a sort – was occurring in Alabama at that time. As everybody knows, blacks were not allowed to vote at that time. Notice how all but one of the blue counties surround Alabama’s Black Belt. What is less well known, however, is that many poor whites (more likely to vote Republican) were also unable to vote. The poll tax didn’t hurt just African-Americans, after all.

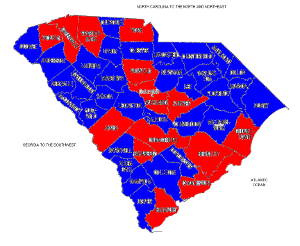
    Different southern states enacted different voting restrictions with an intent to continue Democratic dominance. Some were more strict; some were less so. Republicans in North Carolina, for example, generally held Democrats to below 60% of the vote; they even won the state in 1928. On the other hand, South Carolina probably disenfranchised the most voters.

    Here is the result:

    Photobucket

    The blue indicates a county that gave the Republican candidate less than 10% of the vote – for nine straight elections, from 1912 to 1944. From 1900 to 1944, South Carolina’s average vote (per election) went 94.89% Democratic, 3.98% Republican.

    How did South Carolina achieve this amazing result?

    A revealing clue is provided by looking at the voting count numbers. For example, in the year 1912 a total of 50,405 people voted in South Carolina (48,357 of whom supported the Democrat). At that time the census had just reapportioned electoral votes; South Carolina had a total of nine.

    By comparing South Carolina to states with similar populations, one can get an idea of how many potential voters were disenfranchised. Kansas, for example, had ten electoral votes; 365,560 people in the state voted that year. West Virginia had eight electoral votes; 268,828 people voted in that state (remember, this was before women’s suffrage). In South Carolina, therefore, several times more citizens “should” have voted than actually did.

    In conclusion, to state that the Solid South always voted Democratic is a misnomer. Even to say that it voted extremely Democratic might still be inaccurate. It would be like saying I’m interested in politics. Technically its true, but the picture the words imply far and away understates the reality.

    A look at the 2010 North Carolina elections

    2010 will be a key year in North Carolina politics.  There has been some discussion on whether my home state has officially “seceded” from the South.  2010 (and 2012) will probably direct us on whether the Tar Heel state will become more reliably Democratic for the next generation.

    NC-Sen  Richard Burr is not popular, and he is not unpopular.  The truth of the matter, Burr is unknown by a large portion of the electorate.  Enter in Cal Cunningham and Elaine Marshall, and we will see a healthy Democratic primary (Elaine is a class act, and Cal seems to be a true progressive).  This seat is a Tossup.

    NC-01 G.K. Butterfield (D) will be re-elected.  Period.

    NC-02 If Bob Etheridge (D) does not run for the US Senate, he will be easily re-elected.  If he doesn’t run, this seat will be a tossup.  Etheridge relates well in this area, but at the same time he represents a mildly conservative district.

    NC-03  Until 1994, Walter B. Jones Jr.(R) was a Democrat!  Few know that his father was a representative for 28 years.  His father was a moderate/conservative Democrat.  That being said, Walter Jr. is popular in his conservative district, and as Republicans go, he doesn’t mind voting against his party.

    NC-04 David Price (D) (my representative) will win in a cakewalk.

    NC-05 Virginia Foxx (R)is not as popular in her very conservative district as many might think.  However, barring a scandal Foxx will be re-elected.

    NC-06 Howard Coble (R) will win easily if he runs for re-election (he will be 79 in 2010).  If he doesn’t run, whomever wins the Republican primary will win the general election.  This is a very conservative district.

    NC-07 Mike McIntyre (D) is a blue dog that represents his district well.  He will have no problem being re-elected.

    NC-08 Larry Kissell (D) will have a fight on his hands even if the GOP can only pursuade a 2nd-rate candidate.  I think Kissell wil win, but he will probably get no more than 55-58% of the vote.  This district is culturally conservative, but a populist Democrat can (and will) prevail.

    NC-09 Sue Myrick (R) will win re-election with little problem.

    NC-10 Patrick McHenry (R) will win this race although he’s probably not as popular as you might think in a conservative district.  Unfortunately, the very young McHenry will become more entrenched as the years go by.

    NC-11 Heath Shuler (D) knows how to play this district well.  A good challenger could defeat Shuler, but Shuler should win easier as the years go by.

    NC-12 Mel Watt (D) will win this election as long as he has the desire to run.  There is no indication that he wants to step down.

    NC-13 Brad Miller (D) will be safe barring (a) another economic meltdown and (b) a personal scandal.  I don’t consider a divorce will be much of a factor.

    In conclusion, the Democrats have one race where they might pick up (NC-Sen), but they will have to play some defense in NC-08.  Also, if Bob Etheridge or Mike McIntyre leave their districts, the Democrats will have to play some defense.

    By what margin will Bob Shamansky win?

    View Results

    Loading ... Loading ...

    PBI (Party Brand Index) Part 3: North Carolina

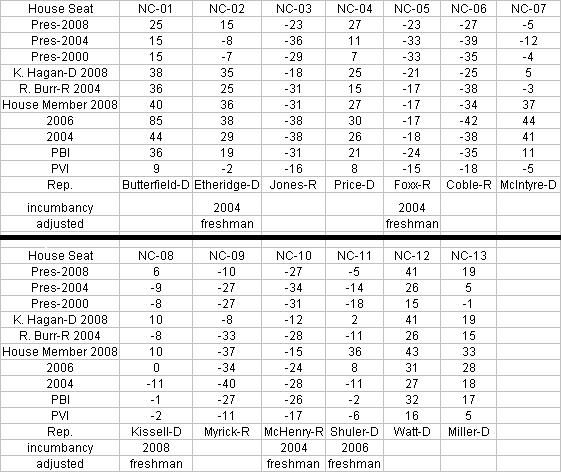
    I have been working on a concept I’m calling PBI or Party Brand Index, as a replacement for PVI.  PVI (Partisan Voting Index), which is measured by averaging voting percentage from the last two presidential elections in each house district, and comparing it to how the nation as a whole voted, is a useful shorthand for understanding the liberal v. conservative dynamics of a district. But in my opinion it falls short in a number of areas. First it doesn’t explain states like Arkansas or West Virginia. These states have districts who’s PVI indicates a Democrat shouldn’t win, yet Democrats (outside of the presidency) win quite handily. Secondly why is this the case in Arkansas but not Oklahoma with similar PVI rated districts?

    Secondly PVI can miss trends as it takes 4 years to readjust. The main purpose of Party Brand Index is to give a better idea of how a candidate does not relative to how the presidential candidate did, but compared to how their generic PARTY would be expected to perform. This week I’ll tackle North Carolina.

    Last week I tackled Colorado and Virginia in PBI part 2. My general strategy is to work my way “out” from swing states.

    Some of the divergences between PBI and PVI in North Carolina are, Rep. Etheridge who has won by margins of between 29-36% goes from being in a lean GOP district to a safe Democratic district. Similarly Rep. McIntyre who has won with between 44 – 37% of the vote goes from being in a lean GOP district (-5 PVI) to a moderate democratic one of (+11 PBI).

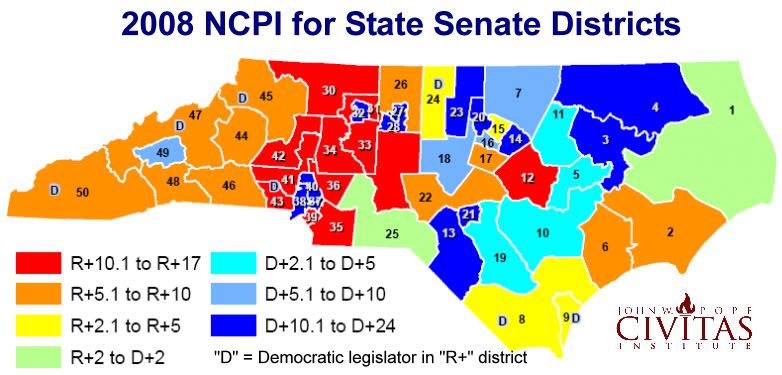
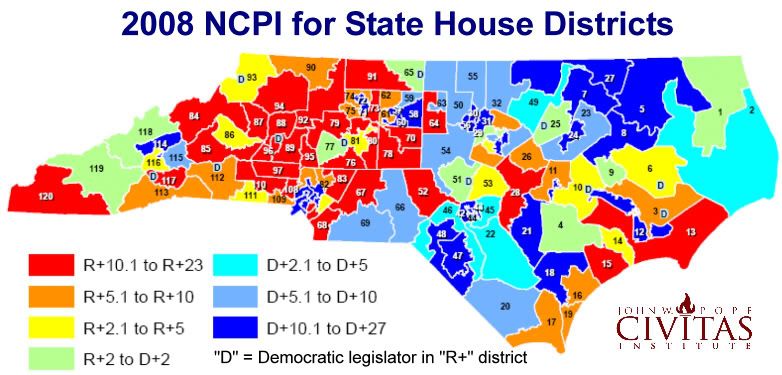
    For more North Carolina fun in 2008, the Civitas Institute premiered the North Carolina Partisan Index using data from the 2004 General Election. Even though the Civitas Institute is libertarian their numbers and calculations are open sourced, and are valid.

    This year, we have updated the NCPI to reflect voters’ choices in the 2008 General Election.

    Modeled after the Cook Partisan Voting Index developed for congressional districts, the North Carolina Partisan Index compares the political leanings of voters in each state house and senate district with the partisan voting tendencies of the state as a whole. The end result is a letter (D or R) followed by a number, indicating the extent to which each district leans one way or the other.

    The new NCPI was developed using adjusted 2008 data on the elections for Governor and other council of state offices – Lieutenant Governor, Attorney General, Commissioners of Agriculture, Labor, and Insurance, Secretary of State, State Auditor, State Treasurer, and Superintendent of Public Instruction.

    ______________________________________________________________________________


    As a reminder I will review how I calculate Party Brand Index.

    To compute PBI I basically did the following. I weighed the last 3 presidential elections by a factor of 0.45. Presidential preference is the most indicative vote since it’s the one politician people follow the most. The POTUS is the elected official people identify with or despise the most, thus illuminating their own ideological identification. I then weighed each house seat by 0.35. House seats are gerrymandered and the local leader can most closely match their districts make up in a way the POTUS can’t. So even though they have a lower profile I still gave them a heavy weight. Lastly I gave the last two Senate elections a weight of 0.2. Senatorial preference can make a difference, although I think it’s less than that of the President or the House members. Also (more practically) because I have to back calculate (estimate) Senate result totals from county results, a smaller number helps lessen the “noise” caused by any errors I may make. Under my system Democratic leaning have a positive number, the GOP has a negative number.

    I then developed a way to weight for incumbents.  The reelection numbers for incumbents is so high it would be a mistake to weight a district solely on the fact that an incumbent continues to get elected. There is a long list of districts that have PVI that deviate from their incumbent members, whom none the less keep getting elected. These districts then change parties as soon as the incumbent member retires. This is evidence that incumbency can disguise the ideology of voters in a district.

    Next I added a weighting of about 7% for House members. I remember reading that incumbency is worth about 5-10%. Nate wrote in a 538.com article that a VP pick from a small state was worth about a 7% swing, a house seat could in fact be thought of as a small state, that seems as good a number as any to start from. Conversely I will deduct 7% from an incumbents win. I think this will score them closer to the natural weight of a district. By the way I’m weighting the win 7% less, not actually subtracting 7% from the number.  Open seat races will be considered “pure” events and will remain neutral as far as weighting goes.  A seat switching parties will also be considered a neutral event. The 1st defense of a seat by a freshman house member will be given a weighting of 2%. The toughest race for any incumbent is their 1st defense. I decided to adjust for this fact. Note: Indiana’s bloody 9th was a tough call a case could be made that when a seat keeps flipping, and the same two guys run 4 straight times in a row each election should be a neutral event.

    Senate weighting is as follows. In state with a single House seat the Senate seat will be weighted the same as a house. In states with multiple seats, the Senate will get a weighting of 2%. Nate Silver stated that a VP pick in a large state is worth this amount. An argument could be made for a sliding scale of Senate weighting from 2-7%, this added complexity may be added at a later date. I will give incumbent presidents a 2% weighting, until I get better data on how powerful a “pull” being the sitting POTUS is, I will give them the same weighting as a senator.

    GE 2008, the Democratic pick up states: an exhaustive summary analysis

    Now that all 9 Democratic pick-up states plus NE-02 have been analysed, I have also provided an exhaustive and most unique non-partisan summary of the pick-up states. I can guarantee you that there is information in this summary that you will not find anywhere else in this quality, clarity or combination.

    There are a number of side-documents that go with the summary, plus links to all of the nine analyses and the GE 2008 final analysis for the entire Union.

    I want to explain again that I have farmed this kind of thing out to Google Docs as it makes it easier for me to publish charts, tables and graphics. It is my hope that you will read the summary in it’s entirety. There are surprises all over the place that only become apparent when one scratches under the surface and researches the GE 2008 at the county level, county for county. In the case of the 9.25 pick-ups, we are talking about 696 counties.

    The summary is divided into 2 parts and all of this information is after the jump.

    Part I of the summary contains:

    – links for the individual analyses for all the pick-up states plus the links for the GE 2008 analysis for the entire Union are given again. They will be reproduced at the bottom of this diary entry.

    – an overview of the raw vote and percentage totals for the pick-ups states, first for 2008 only and then a comparison to 2004.

    – three maps. One shows the geographic position of the pick-ups within the USA. The second shows the geographical relationship between the pick-ups and the Democratic retentions from 2004. The third shows the Democratic states from 2008 plus the 5 leanest GOP wins from 2008.

    – a question: “How does this compare on a historical level?”

    The question is referring to the number of electoral votes that changed parties in 2008, namely, 113 EV. I then provide a table showing each general election back to 1948 and how many electors changed parties, and in which direction. The answer to the question is that Obama’s EC shift is on par with the last election cycle, but less than in the 1980s.

    Afterward, there is an introduction to the county-level analysis, including an exact numeric count of counties per state: Democratic retentions, Democratic pick-ups, Republican retentions and Republican pick-ups.

    Quote:

    “In the pick-up states, the Democratic party retained 146 of 148 Democratic counties from 2004 and then picked-up an additional 89 counties, for a total of 235 counties (33.76%). The Republican party lost 89 counties from 2004, retaining 459 counties and then picked-up 2 counties, for a total of 461 (66.24%). 235 + 461 = 696 counties.”

    “Nationally, all 9 states trended Democratic as Obama won them and their electors according to the WTA (winner-takes-all) system, but when we look at the inner details, the picture is much clearer: 642 of 696 counties in the pick-up states (92.24%) swung Democratic. The remaining 54 counties (7.76%) swing Republican. This indicates a statistical grand sweep for the Democratic party in the pick-up states.

    In 4 states, the ENTIRE state trended Democratic: Colorado, New Mexico, Nevada (all three western pick-ups) and Indiana.The pick-up in Indiana is historic not only because this is the first time since 1964 that a Democrat has won the state, but it also had the largest partisan shift of all 50 states in the GE 2008: +21.71%

    The state with the largest contra-trend (Republican) against the national trend: Florida.”

    Part I ends with maps of Ohio, Virginia and North Carolina, showing the geographic position of the 28 counties that swung Republican, showing their proximity to Appalachia.

    You can link to Part I via Google Docs.

    Part II starts with an extensive study of the 39 largest counties out of the 9.25 pick-ups states, plus Durham County (NC) as honorable mention.

    Quote:

    “I have done a statistical analysis of the 39 largest counties of the 9.25 pick-ups. These are all counties that had a total vote of more than 170,000 and at least one candidate should have also gotten at least 100,000 of those votes or very,very close to it. All of those counties meet both criteria. Two counties (Stark County / OH, Washoe County / NV) had no candidate with 100,000 votes or more, but in both cases one candidate was very close to 100,000 and the countwide total vote was well over 170,000.  Those 39 counties accounted for 44.49% of the total popular vote of the pick-up states, which is actually slightly LESS than it was in 2004 for the same states: 44.91%. Nonetheless, when only 39 of 696 analysed counties (5.60%, numerically) have almost half the electoral firepower of the region, then it is statistically very clear that the large urban areas have the real electoral firepower in presidential elections. The candidate who sweeps the urban areas has a far better chance of winning the presidency.

    Of these 39 counties, there were 21 Democratic retentions, 8 Democratic pick-ups and 10 Republican retentions. This means that of the same 39 counties in 2004, the picture was much more even: in 2004, there were 21 Democratic counties of these 39 and 18 Republican counties.

    The Democratic party picked up Hillsborough (Tampa) and Pinellas (Clearwater) counties in Florida, Wake (Raleigh) county in North Carolina, Washoe (Reno) County in Nevada, Hamilton (Cincinnati) County in Ohio, Jefferson (Golden) and Arahapoe (Littleton) counties in Colorado and Douglas (Omaha) County in Nebraska.”

    The important thing about this study is it’s depth and breadth: each of the 39 (40) counties are analysed comparing 2008 to 2004, measuring raw vote and margin differences, also the counties’ percentual take of their respective states’ popular vote and also their take of the pick-up states combined. But the counties are also each given a spreadsheet to trace their voting history back to 1960 and the results are nothing less than amazing!

    Next, from the analysis in Part II:

    Superlatives:

    – the largest raw vote total of all 39 counties: Miami-Dade County, FL: 864,636 votes

    – the largest Democratic winning raw vote total: Miami-Dade County, FL: 499,831 votes

    – the largest Democratic raw-vote margin of the pick-ups: Cuyahoga County, OH (Cleveland): +258,542 vote margin

    – the three highest Democratic winning percentages: Denver- CO,  Boulder, CO and Cuyahoga- OH: 75.45%, 72.29% and 68.70%, respectively.

    – the three largest Democratic winning margins (by percent): Denver- CO,  Boulder- CO and Cuyahoga- OH: +52.41%, +46.14% and +38.74%, respectively

    – the highest democratic margin-shift (swing): Marion County, IN: +26.40% margin shift. This is especially impressive, as this shift was not from a pick-up, but rather, a Democratic retention county.

    – the largest Republican winning raw vote total: Duval County, FL: 210,537 votes

    – the largest Republican raw-vote margin of the pick-ups: El Paso County, CO: +51,419 vote margin

    – the three highest Republican winning percentages: Butler – OH, El Paso- Co and Lee- FL:  60.52%, 58.69% and 54.67%, respectively

    – the three largest Republican winning margins (by percent): Butler – OH, El Paso- CO and Brevard- FL: +22.58%, +18.82% and +10.37%, respectively

    – the lowest negative Republican margin-shift (swing): Brevard County, FL: -5.73% margin shift

    All of the Democratic retentions and pick-ups showed raw vote, percentual and margin GAINS.

    All of the Republican retentions showed percentual and margin LOSSES.

    4 of the Republican retentions showed raw-vote gains: Brevard, Lee, Polk and Pasco counties, all in Florida. The other 6 Republican retentions showed raw-vote losses.

    9 Republican or Democratic tipping-point (margin = less than 4%) counties from 2004 became solid Democratic wins in 2008: Pinellas, Volusia and Orange Counties-FL, Wake, Guilford and Mecklenburg Counties- NC, Montgomery and Stark Counties – OH, Arapahoe County- CO

    5 Republican retentions have become tipping point counties for 2012: Sarasota (+0.10%), Virginia Beach (+0.71%), Duval (+1.90), Seminole (+2.70%) and Pasco (+3.75%) . Statistically this means that 1/2 of the Republican retentions studied here are endangered territory for 2012 and (this has been proven historically many times over) in the case of a sucessful re-election campaign for the Democratic party in 2012, these five counties are the most likely candidates to become Democratic pick-ups in 2012.

    O Democratic retentions or pick-ups are tipping-point counties for 2012.

    Here is the EXCEL SPREADSHEET that has all of the raw calculations for the 39 (40) largest counties.

    In order to simplify the look of the table and make the information easier to see, I created a table to show the chronological progression of each county from 1960 to 2008. For each county and year, I have assigned either a D, R or an I, depending on which party won the county in that year. And then I have shaded each cell according to winning party. I then organized the table in order from CORE GOP counties to CORE DEM counties. Take a good, hard look at the table when you read Part II, it is most enlightening.

    You can link to Part II via Google Docs.

    Quotes:

    “In the case of some counties that visually look as if they should be core GOP counties there is instead the marking steady; these are GOP counties that should be core counties, but which almost flipped in 2008, so their status is now uncertain. And some Democratic counties are marked as steady as the margins are very lean.

    But the table makes it very easy to see which years are landslide years: 1972 and 1984, to a smaller extent 1992 and 2008. In 1972, we see a sea of red go through all counties except Lucas County, OH. In 1984, we see a sea of red go through all counties except the bottom 5. At the top we see 3 core GOP counties that also resisted the Johnson landslide of 1964. Notice that all three counties are in Florida.

    Starting in 1988, the Democratic party started re-building in the urban areas:

    3 counties were added to the Democratic column in 1988, resisting the GOP pull in that year: Boulder, Summit and Lucas counties. And those counties have become core DEM counties since then.

    8 counties joined the Democratic column in 1992 and have stayed there since then: Palm Beach, Broward, Volusia, Bernalillo, Franklin, Montgomery, Clark, Miami-Dade. They are mostly strong DEM counties, save for Montgomery and Volusia, which tend to go with leans margins. There are 4 more counties that joined the Democratic column in 1992, but were reclaimed by the GOP in either 1996 or 2000: Pasco, Wake, Stark, Guilford. Pasco returned to the GOP in 2004 and has stayed there. It is therefore the only county to complete buck the blue trend, in spite of reduced margins in 2008.

    Mecklenburg and Pinellas counties joined the Democratic column in 1996, were reclaimed by the GOP in 2000 or 2004 and were reclaimed by the Democratic party in 2004 or 2008.

    Fairfax joined the Democratic column in 2000 and has stayed there since, with ever increasing margins.

    Orange and Marion counties joined in 2004 and were retained in 2008. Both of these retentions had massive margin shifts toward the Democratic party in 2008: +18.41 and +26.40%, respectively.

    The 8 counties that Obama picked-up are clear to see in the middle of the table. Six of those counties have one thing in common: this is the first time they have gone Democratic since 1964, statistical evidence of a sweep similar to but not as extreme as Johnson in 1964: Hamilton, Douglas, Jefferson, Wake, Hillsborough and Pinellas counties were slightly smaller wins for the Democratic party than in 1964. However, Washoe and Arapahoe counties were larger wins for the Democratic party than in 1964, thus breaking a 44 year record. Notice that both of those counties are in the west.

    We can see clearly from the table that the last time a party had flipped 8 counties or more was in 1992, when Bill Clinton picked-up 12 counties. George W. Bush, Jr. picked up 3 counties in 2000 and 1 more in 2004. Those counties returned to the Democratic party in 2000 or 2004.

    In 1988- just analyzing these 40 counties- there were 8 Democratic counties and 32 Republican counties. In 1992, out of the same mix of 40 counties, there were 20 Republican counties and 20 Democratic counties, an even split. In 2000, there were 21 Republican counties and 19 Democratic counties. But in 2004, in spite of a republican re-election, the Democrats had 22 counties, the Republicans 18. And now in 2008, it’s 30 Democratic, 10 Republican. There can be no doubt about it: statistically, the urban areas in the Union have moved decisively to the Democratic party in 47 of 50 states (the evidence for which I will present before the end of 2009). This example from the 9.25 Democratic pick-ups is mild in comparison to the statistical data that came out of cities in core Democratic territory: Philadelphia (83% for Obama), Detroit (74% for Obama), New York (86% for Obama), Los Angeles (69% for Obama), Seattle (70% for Obama), Portland (77% for Obama) Chicago (76% for Obama), Boston (64% for Obama), Honolulu (70% for Obama), Milwaukee (67% for Obama), Madison (73% for Obama), New Orleans (79%), Baton Rouge, Dallas (deep in GOP territory: 57% for Obama), St. Louis (60% for Obama) etc, etc, etc.”

    Conclusion:

    “The Democratic wins in the pick-up states, as in the retentions, was not the example of the Democratic party barely holding on the to so-called “blue” states plus one “red” state or getting to one vote over 50%. The sweep through the pick-ups is statistically clear. The last time a sweep like this happened in the Republican party, it held the white house for 12 years. On the other hand, Johnson and Nixon had massive sweeps in 1964 and 1972 and in spite of this,the White House switched hands in the following cycles. So, though such a sweep is no forecast for the future, the data tells us quite clearly where the new battle lines will form in these nine states for the 2012 General Election. And both parties will be targeting key counties in key districts in 2010 in order to sway the affected area to their side before 2012 even gets off the ground.”

    ————————————————————–

    Here the links to the individual analyses, with a detailed description afterwards:

    Mid-west:

    OHIO – Part I, Part II, Part III , raw data / INDIANA – Part I, Part II and Part III, raw data

    IOWA – Part I, Part II, Part III, raw data / NEBRASKA CD-02 – raw data

    South:

    VIRGINIA – Part I, Part II, Part III, raw data / NORTH CAROLINA – Part I, Part II, Part III, raw data  

    FLORIDA – Part I, Part II, Part III, raw data

    West:  

    COLORADO – Part I , Part II , Part III , raw data, special 9-county 48-year voting history study

    Supplemental to Colorado: DEMOGRAPHIC and ECONOMIC profile of Colorado (p.4, hispanic population)

    NEW MEXICO – Part I, Part II, Part III, raw data, special 12 county 48-year voting history study   Supplemental to Nevada: DEMOGRAPHIC and ECONOMIC profile of New Mexico (p.4, hispanic population)  

    NEVADA – Part I, Part II , Part III, raw data, special 6 county 48-year voting history study  

    Supplemental to Nevada: DEMOGRAPHIC and ECONOMIC profile of Nevada (p.4, hispanic population)   Quick Census facts on Nevada  

    An analysis for NE-02 (which is the „.25″ part of „9.25″) will be published when I have received the complete precinct data for Douglas and (part of) Sarpy counties from election officials who are willing to dig up the data over 48 years for me. But a comparison 2008 to 2004 is already possible and here is the raw-data.

    Links to the large analysis for the entire Union

    Full analysis Part I

    Full analysis Part II  

    Full analysis Part III

    Full analysis Part IV  

    Full analysis Part V

    raw-vote total data  

    Obama’s standing in the national rankings since 1824  

    Obama’s standing in the rankings, per state
    Redistricting North Carolina

    (From the diaries – promoted by DavidNYC)

    So you all know the drill by now – take some VTDs, consolidate them to reflect updated population stats, then piece them together. I couldn’t think of a witty title today either. Oh well.

    My goals for North Carolina were to:

    • strengthen Kissell (8th) and Shuler (11th)
    • draw Foxx (5th) out of her district
    • obey the VRA – that is, a majority-black district for Butterfield (1st) and a majority-minority district for Watt (12th)
    • maintain percentages for the other Democrats: Etheridge (2nd), Price (4th), McIntyre (7th), and Miller (13th)
    • get rid of that touch-point continuity in Guilford County between the 6th (Coble) and the 13th

    Update: Many of you have correctly pointed out that NC may be gaining a 14th seat. There’s a plan for that in the works too.

    Here’s the new map (yes, everything is contiguous!):

    So here are two useful pieces of info that I had:

    Here’s average Democratic performance, by consolidated VTD, across 10 contests (US President, US Senate, Governor, Lieutenant Governor, State Treasurer, State Auditor, Commissioners of Agriculture, Insurance, and Labor, and State Superintendent of Education). Average performance in 2008 was 51% Democratic.

    Here’s also a map of the minority population of each VTD:

    Stats here are: Population, Black Population, Latino Population, Average Democratic and Republican performance, Obama%, McCain%, the number of Democratic and Republican VTDs. SQL is getting angry at me for putting too much data in, so if you want the county breakdown, you’ll have to look here.

    So district-by-district:


    01 708,845 354,742 22,994 66.73% 32.51% 62.03% 37.50% 260 43

    One of the hardest districts I’ve had to draw. The problem is, with NC’s population growth, each district has to contain more people. Additionally, the majority-minority areas of Northeastern NC have also lost population. Thus, the far reaching tentacles that hit so many counties, including Pitt (Greenville), Lenoir (Kinston), Wayne (Goldsboro), Wilson, Nash (Rocky Mount), Beaufort (Washington), and the list goes on. I like to think of this as the Petey Pablo district (listen to ‘Raise Up’ if you have any questions.) As you can see, we barely cross the threshold at 50.04% African-American. Average Democratic performance is 66.7% – Butterfield’s not in any danger. Obama and Hagan underperformed at 62.0% and 64.5% respectively; Bev Perdue crusied here with 69.3%.


    02 708,383 203,577 51,146 54.85% 43.96% 51.35% 47.92% 76 50

    Bob Etheridge’s district has never been that Democratic on a presidential level – Obama winning was a big surprise – but still quite Democratic on a local level. This district reflects that reality as well, but shifted somewhat further south. Etheridge’s home in Lillington (Harnett County) isn’t moved, and Harnett and Lee Counties remain in this district entirely. A large chunk of Republican leaning Johnston County is cut out in the north, replaced by Anson, Hoke, and Richmond counties along the SC border. Instead of anchoring Democratic performance in Raleigh, an updated 2nd finds its strength in Fayetteville.  Average Democratic performance is 54.9%. Obama got 51.4%, Hagan 54.9% and Perdue 55.0%.


    03 709,086 103,074 34,867 41.25% 57.37% 36.01% 63.15% 33 173

    This district contains 33 Democratic precincts, which in my mind is 33 too many. However, the 3rd has to accommodate all the parts that would dilute the minority-concentrated 1st district too much, and many of those urban precincts do lean left. This is most evident in Pitt County, where average Democratic performance was 49%. Given the polarized voting often evident in the South though, the rest of this district scores 41.3% overall. Obama severely underperformed, getting 36%.  Hagan and Perdue did better, getting 40% and 47% respectively. This has potential, but it simply isn’t possible to satisfy the VRA and make this district Democratic at the same time.


    07 708,733 176,916 29,459 54.74% 43.74% 49.71% 49.46% 128 69

    Mike McIntyre’s district is pretty much like Etheridge’s, more Democratic at the local level than nationally. This district stays with Wilmington and Lumberton, along with a part of Fayetteville not in the 2nd. This district really doesn’t change all that much, other than some traded precincts with the 3rd to make this more Democratic. Obama nudged out a win with 49.7%, 5 points below the average of 54.7%. Hagan and Perdue both did well here at 55.4% and 56.4% respectively.


    04 709,502 168,493 37,358 59.17% 39.34% 60.65% 38.43% 99 59

    David Price, we seem to forget, actually lost in the Republican tide of 1994 before reclaiming his district in 1996. The Triangle, of course, has changed quite a bit since then. This district remains centered on Durham and Chapel Hill (52% of the population), with some Republican-leaning sections of Wake County thrown in for another 22%. This district does expand eastward to grab some rural areas that couldn’t fit into the first 3 districts, but Price need not be concerned. It’s 59% Democratic, but this is one of those districts where Obama overperformed (60.7%). A 60.6% showing for Hagan is a testament to the Democratic nature of this district; Perdue did underperform at 57.1%.


    13 708,616 153,464 41,474 57.07% 41.40% 59.86% 39.17% 83 32

    Even in the most gerrymandered of states, you still have some examples of compactness. This is this map’s token compact district, if you will. It consists of Wake County only, losing a good chunk of border territory along the Virginia border and an arm into Greensboro (and that touch-point!). It contains all of Raleigh and Cary, along with some suburbs. Another strong Democratic district; average performance is a bit low at 57%, but this is where Obama excelled with 59.9%, an improvement over Brad Miller’s current district, actually.


    05 708,588 142,544 30,781 53.80% 44.77% 52.85% 46.21% 130 85

    This is the other half of Brad Miller’s district, featuring the Northern border counties – Person, Caswell, Rockingham, and Stokes. That’s not where the population is though, and to compensate, this district has a southern arm that hits parts of Orange, Alamance, Guilford, and Forsyth counties, including significant parts of Greensboro and Winston-Salem not drawn into Mel Watt’s 12th. Virginia Foxx doesn’t even live in this district, and I have a hard time seeing her winning this 53.8% Democratic district. Obama scored a respectable 52.9%, and Perdue 54.0%. Hagan, being from Greensboro, stomped here with 56.4%.


    06 708,652 37,671 24,307 33.30% 65.21% 33.11% 65.90% 3 187

    All the Republicans in central NC have to go somewhere, and this district is it. I think the packing of Republicans is especially evident, given that there are 3 Democratic precincts out of 190. With the Democrats in Alamance, Guilford, Union, and Mecklenburg drawn into other districts, all the Republicans are left here. At 33.3%, this is the most Republican district in NC on average. Obama scored 33.11%. Hagan did comparatively well at 37.3%, and Perdue absolutely bombed here, netting 29.2%. Sue Myrick may have less incentive to retire now.


    12 709,069 306,416 48,281 65.15% 33.77% 65.35% 33.99% 122 58

    Mel Watt’s VRA district was significantly easier to draw than Butterfield’s, partially because of the looser requirement. In essence, you have to have the majority-black precincts of Charlotte (Mecklenburg) and the Triad (Greensboro, High Point, and Winston-Salem) along with some connecting precincts. Much like the current 12th, I chose to run this district through Cabarrus, Rowan and Davidson Counties, roughly paralleling I-85. New is an arm into Statesville in Iredell County. In the interest of leaving more high-performing Democratic precincts for the 5th and 8th districts, this district also barely makes the cut at 50.02% minority. Watt’s still in no danger though, at 65.2% Democratic, 65.4% Obama, 66.7% Hagan, and 61.9% Perdue.


    08 708,785 163,472 55,333 57.16% 41.60% 58.96% 40.24% 99 58

    Larry Kissell gets a significant boost out of this district, though it becomes much more Charlotte-centric. His home in Montgomery County remains, although with a connecting strip through Stanly and Union counties into Mecklenburg. 72.6% of this district is now in Mecklenburg County, which is nice for Kissell since this district’s part of Charlotte was on average 63.3% Democratic (Obama did better at 66.3%). Overall, this makes for a 57.2% Democratic district; Obama did better at 59.0% and Hagan better still at 59.7%. Even Bev Perdue, who underperformed heavily in Charlotte (where Pat McCrory is Mayor) won, eking out a 400-vote win. This, I think, is a testament to the Democratic nature of this district, which should be safe for Kissell.


    09 708,310 32,978 22,045 35.74% 62.55% 32.14% 66.53% 14 250

    This district sets the stage for a Foxx-Coble showdown. I know the core of Coble’s district is actually in the new 6th, but Sue Myrick lives in the Mecklenburg part. Coble also lives in the Guilford part of this district. Funny how that works. (Foxx lives in the Avery County section.) More of this district is Foxx’s, but Coble’s also actually sane. I’ll leave you to decide how a primary between the two works out. The college town of Boone (Appalachian State) is removed, replaced by an arm into the Republican sections of Greensboro and Alamance County. Again, packing Republicans is at work here, with 14 out of 264 precincts being Democratic for an average of 35.8%. Obama got 32.1% (this is Appalachia, after all); Hagan 38.2%, and Perdue 36.9%.


    10 708,675 50,090 26,779 37.10% 61.41% 35.10% 63.89% 15 162

    Patrick McHenry’s district doesn’t change too much – he and Heath Shuler trade some precincts in the South to make Shuler’s district more Democratic by removing the vast majority of Republican Henderson County. I had originally wanted to draw a good district for 2008 candidate Daniel Johnson, but another Democratic district in Western NC was simply unrealistic. 15 out of 177 precincts are Democratic, leaving it at 37.1% Democratic, 35.1% Obama, 39.6% Hagan, and 33.0% Perdue.


    11 708,808 62,133 17,174 52.09% 46.21% 48.89% 49.78% 120 127

    I really tried to get Heath Shuler a district that Obama won, but it simply wasn’t possible without the district hitting Charlotte. Thus, we’re left with an Asheville-centered district that takes all of WNC to the west, and then sprouts two arms. One arm reaches northeast to grab Boone, and the other goes sawtooth along the SC border to get Forest City (Rutherford County), Shelby (Columbus), and finally, Gastonia (Gaston). This makes a 52.1% Democratic district, with Hagan and Perdue overperforming at 52.7% and 52.4% each. Obama came closer, falling 3,000 votes or 0.9% short, at 48.9%.

    And there you have it, a 9-4 map of North Carolina. Without the VRA, it would be possible to squeeze at least one more Democrat out, but you can’t have everything. Questions, comments, and witty remarks about what these districts actually look like welcome.

    By what margin will Bob Shamansky win?

    View Results

    Loading ... Loading ...