Texas Lege Redistricting

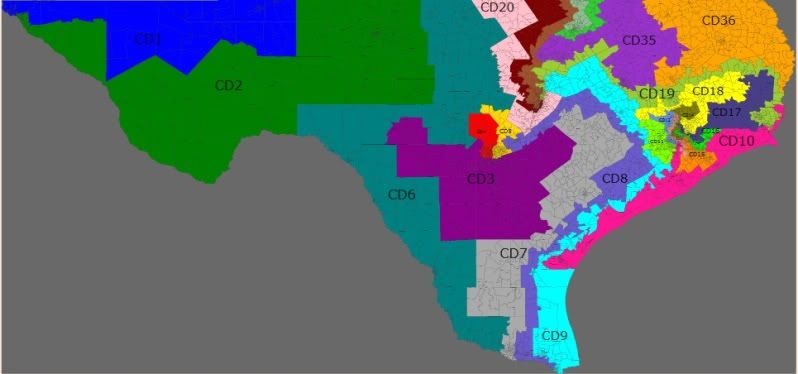
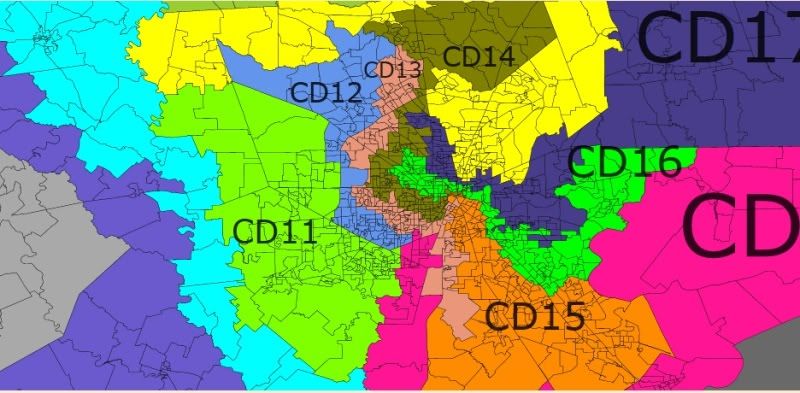
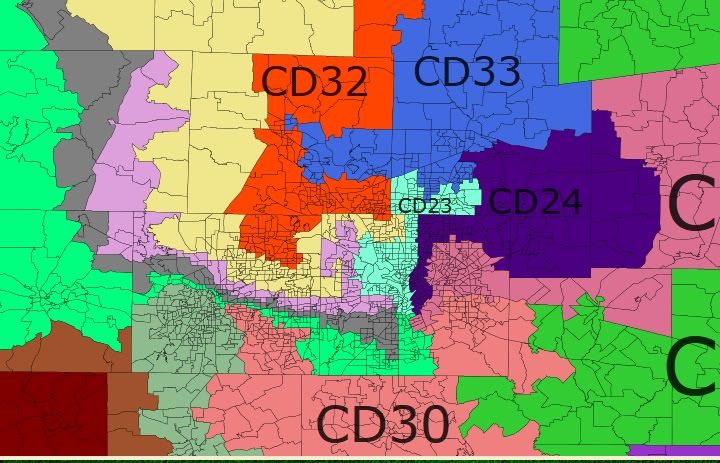
With 4 new congressional seats, Texas of course grew. While we get to increase our congressional delegation, our legislature will stay the same. This means, that state senators will continue to have even larger constituencies and districts than members of congress.

Everyone has speculated where the new congressional districts will be, and looking at the state legislature, especially the house, you can also get a good visual of the growth.

The new population of 25,145,561 means that State Senate districts (31) should have an ideal population of 811,147 and State House districts (150) 167,637.

Which districts will need to grow and which will need to shrink?

Green colored districts (green because they grew over the past decade) are those that are currently over the ideal population and will need to lose people.  White/non-colored districts are those that will need to add population.

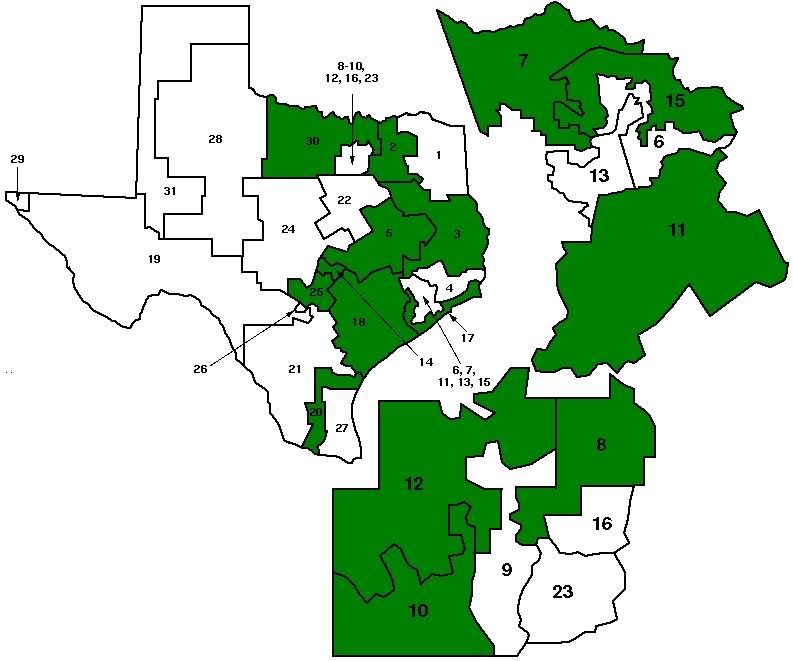
Right now 15 State Senate districts will need to shrink and 16 will need to grow. Half and half.


District Population Deviation Party
1 731,108 (80,039) R
2 856,525 45,378 R
3 818,359 7,212 R
4 790,149 (20,998) R
5 899,155 88,008 R
6 643,019 (168,128) D
7 1,015,027 203,880 R
8 940,963 129,816 R
9 807,907 (3,240) R
10 834,265 23,118 D
11 838,090 26,943 R
12 1,013,641 202,494 R
13 730,086 (81,061) D
14 872,176 61,029 D
15 824,336 13,189 D
16 641,007 (170,140) R
17 847,887 36,740 R
18 861,831 50,684 R
19 766,044 (45,103) D
20 836,938 25,791 D
21 752,602 (58,545) D
22 789,412 (21,735) R
23 749,622 (61,525) D
24 778,148 (32,999) R
25 984,664 173,517 R
26 721,704 (89,443) D
27 786,946 (24,201) D
28 704,340 (106,807) R
29 758,901 (52,246) D
30 823,594 12,447 R
31 727,1151 (84,032) R
Total: 25,145,561

As the list shows, the two largest districts right now, population wise, are 7 & 12. 7 is represented by Republican Dan Patrick who is committed to solving the budget crisis with his abortion sonogram bill. 12 is represented by Republican Jane Nelson.

Patrick and Nelson each represent more people than the states of Wyoming, Vermont, North Dakota, Alaska, South Dakota, Delaware, and Montana. (not combined, just each state individually)

Out of the districts that need to lose population 4 have Democratic state senators (10, 14, 15, 20), with the other 11 having Republican state senators.

Of the districts that need to add people, it’s exactly 8 Democratic districts (6, 13, 19, 21, 23, 26, 27, 29) and 8 Republican districts (1, 4, 9, 16, 22, 24, 28, 31).


District Population Deviation Party
1 146,509 (21,128) R
2 149,622 (18,015) R
3 145,984 (21,653) R
4 181,882 14,245 R
5 159,305 (8,332) R
6 170,168 2,531 R
7 161,276 (6,361) R
8 149,393 (18,244) R
9 145,381 (22,256) R
10 184,699 17,062 R
11 151,703 (15,934) R
12 149,506 (18,131) R
13 156,600 (11,037) R
14 182,078 14,441 R
15 222,505 54,868 R
16 203,299 35,662 R
17 166,171 (1,466) R
18 150,998 (16,639) R
19 139,948 (27,689) R
20 228,091 60,454 R
21 137,058 (30,579) R
22 126,184 (41,453) D
23 144,933 (22,704) D
24 181,472 13,835 R
25 141,704 (25,933) R
26 180,729 13,092 R
27 225,449 57,812 D
28 263,682 96,045 R
29 208,164 40,527 R
30 147,611 (20,026) R
31 165,121 (2,516) D
32 157,055 (10,582) R
33 148,929 (18,708) R
34 143,582 (24,055) R
35 151,882 (15,755) R
36 201,386 33,749 D
37 142,621 (25,016) D
38 182,363 14,726 D
39 172,273 4,636 D
40 215,412 47,775 R
41 185,698 18,061 D
42 171,951 4,314 D
43 148,370 (19,267) D
44 194,258 26,621 R
45 205,670 38,033 R
46 172,464 4,827 D
47 198,311 30,674 R
48 161,817 (5,820) D
49 141,144 (26,493) D
50 191,756 24,119 D
51 158,774 (8,863) D
52 219,345 51,708 R
53 145,845 (21,792) R
54 196,447 28,810 R
55 176,215 8,578 R
56 155,303 (12,334) R
57 144,556 (23,081) R
58 169,146 1,509 R
59 149,195 (18,442) R
60 148,990 (18,647) R
61 176,054 8,417 R
62 154,792 (12,845) R
63 218,386 50,749 R
64 219,345 51,708 R
65 224,883 57,246 R
66 160,543 (7,094) R
67 145,358 (22,279) R
68 135,942 (31,695) R
69 140,554 (27,083) R
70 300,801 133,164 R
71 146,722 (20,915) R
72 139,868 (27,769) R
73 187,204 19,567 R
74 143,566 (24,071) D
75 219,408 51,771 D
76 132,715 (34,922) D
77 132,567 (35,070) D
78 168,785 1,148 R
79 147,172 (20,465) D
80 149,638 (17,999) D
81 159,026 (8,611) R
82 163,234 (4,403) R
83 173,230 5,593 R
84 157,068 (10,569) R
85 143,267 (24,370) R
86 154,914 (12,723) R
87 152,193 (15,444) R
88 141,962 (25,675) R
89 253,976 86,339 R
90 141,349 (26,288) D
91 164,484 (3,153) R
92 154,749 (12,888) R
93 179,024 11,387 R
94 143,509 (24,128) R
95 155,511 (12,126) D
96 231,782 64,145 R
97 168,045 408 R
98 239,343 71,706 R
99 231,238 63,601 R
100 149,033 (18,604) D
101 163,601 (4,036) R
102 131,327 (36,310) R
103 117,346 (50,291) D
104 131,900 (35,737) D
105 164,238 (3,399) R
106 159,716 (7,921) R
107 140,457 (27,180) R
108 143,531 (24,106) R
109 175,255 7,618 D
110 150,703 (16,934) D
111 163,374 (4,263) D
112 148,911 (18,726) R
113 161,303 (6,334) R
114 126,576 (41,061) R
115 140,868 (26,769) R
116 142,944 (24,693) D
117 220,360 52,723 R
118 152,809 (14,828) D
119 157,106 (10,531) D
120 163,187 (4,450) D
121 158,873 (8,764) R
122 246,846 79,209 R
123 132,442 (35,195) D
124 178,044 10,407 D
125 162,162 (5,475) D
126 172,274 4,637 R
127 187,102 19,465 R
128 148,817 (18,820) R
129 150,798 (16,839) R
130 252,386 84,749 R
131 152,889 (14,748) D
132 264,426 96,789 R
133 155,296 (12,341) R
134 147,146 (20,491) R
135 166,937 (700) R
136 146,854 (20,783) R
137 137,876 (29,761) D
138 136,881 (30,756) R
139 150,919 (16,718) D
140 139,275 (28,362) D
141 184,720 17,083 D
142 154,794 (12,843) D
143 127,381 (40,256) D
144 169,715 2,078 R
145 132,730 (34,907) D
146 143,120 (24,517) D
147 146,857 (20,780) D
148 140,946 (26,691) D
149 169,836 2,199 D
150 212,484 44,847 R
Total: 25,145,561

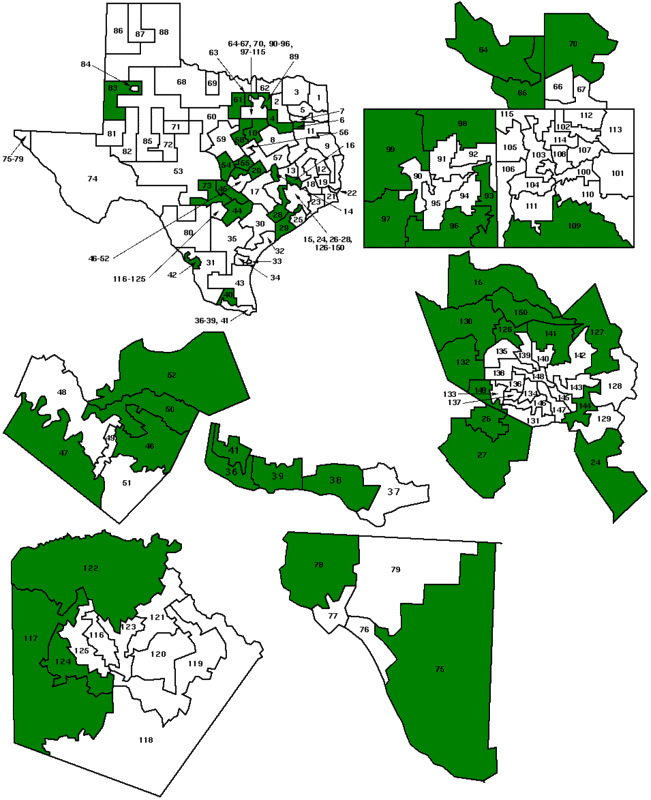
The district with the largest population is 70 represented by Republican Ken Paxton.

54 House districts need to lose population, while 96 House districts need to add people.

Of the districts that need to lose population, 13 are represented by Democrats (27, 36, 38, 39, 41, 42, 46, 50, 75, 109, 124, 141, 149) and 41 are represented by Republicans.

Of the districts that need to add population, 36 are represented by Democrats (22, 23, 31, 37, 43, 48, 49, 51, 74, 76, 77, 79, 80, 90, 95, 100, 103, 104, 110, 111, 116, 118-120, 123, 125, 131, 137, 139, 140, 142, 143, 145-148) and 60 are represented by Republicans.

Of the 24 seats that Republicans picked up last November (I’m also counting the 2 turn coats), 8 districts (40, 45, 47, 52, 78, 93, 96, 117) will need to lose population and 16 districts (1, 3, 12, 21, 33-35, 57, 69, 85, 101, 102, 106, 107, 133, 134) will need to add people.

Texas Split

For those who don’t know “a clause in the document annexing Texas to the United States allowed for Texas to be divided into five different states.”

For more info on that topic, you can visit: http://www.snopes.com/history/…

Long story short, it’s kind of unnecessary since Article IV, Sec. 3 of the U.S. Constitution already allows for states to be split apart.

Since Texas can’t succeed (sorry Gov. Perry) I thought why not for fun split it into five states.

Texas being so big it’s hard to classify the state. East Texas in general is more like the old South. West Texas is more like the plains states. South Texas is more like a border state in the Southwest. In addition:

…El Paso, in the western corner of the state, is closer to San Diego, California than to Beaumont, near the Louisiana state line; Beaumont, in turn, is closer to Jacksonville, Florida than it is to El Paso. Texarkana, in the northeastern corner of the state, is about the same distance from Chicago, Illinois as it is to El Paso, and Dalhart, in the northwestern corner of the state, is closer to the state capitals of Kansas, Colorado, New Mexico, Oklahoma and Wyoming than it is to Austin, its own state capital.

http://en.wikipedia.org/wiki/G…

Here goes…

After racking my brain to come up with some clever names for these 5 new states I finally came up with North Texas, South Texas, East Texas, West Texas, Central Texas. I also tried to estimate how the 36 congressional districts might get split between the 5 new states.

Starting with the smallest and working our way up.

West Texas

Green

Pop. 1.8 million

66% White/26% Hispanic/6% Black/2% Asian

75% McCain/25% Obama

Major cities: Midland, Odessa, Abilene, Amarillo, Lubbock, San Angelo, and Wichita Falls.

Now Gov. Perry can go back to West Texas and be governor.

Think of this as the Texas of the movies, i.e. Giant.

In terms of population it’s in between West Virginia and New Mexico, which would give it 3 congressional districts. No matter what, this would be a state that Republicans would dominate.

Central Texas

Purple

Pop. 3.3 million

65% White/21% Hispanic/10% Black/4% Asian

54% McCain/46% Obama

Major cities: Austin, Round Rock, Killeen, Temple, Fort Hood, Waco, Bryan, College Station

Although it has a Republican lean, I could easily see this state having a Governor Chet Edwards. A moderate-conservative Democrat could win statewide here.

In terms of population, it would be between Iowa and Connecticut with probably 4 congressional districts with maybe a 3-1 Republican majority or even at 2-2.

South Texas

Blue

Pop. 5 million

68% Hispanic/26% White/4% Black/2% Aisan

56% Obama/44% McCain

Major cities: San Antonio, El Paso, Laredo, Corpus Christi, Brownsville, McAllen

A state with a solid Hispanic majority, it’s a state that Democrats would definitely be the governing majority.

In terms of population, it would be just ahead of Colorado, so it would likely have 7 congressional districts, possibly all Democrats or a 6-1 Democratic majority.

East Texas

Yellow

Pop. 7.1 million

53% White/25% Hispanic/17% Black/5% Asian

56% McCain/44% Obama

Houston would be the dominate city in this state, followed by the smaller ones like Beaumont and Galveston

This state would definitely a Republican majority, but the right Democrat could probably win it.  If the minority population continues to increase, so could the Democratic influence. The right Democrat could probably have a chance here.

In terms of population, it would be in between Washington and Virginia so probably 10 congressional districts with a 6-4 Republican split or 7-3 Republican tilt.

North Texas

Pink

Pop. 7.7 million

64% White/18% Hispanic/13% Black/5% Asian

58% McCain/42% Obama

Major cities would of course be DFW, followed by the bedroom communities around them plus Tyler.

An even stronger Republican tilt, but again like East Texas, with increasing minority strength, it should be contested by Democrats.

In terms of population, again like East Texas, in between Washington and Virginia, so again, 10 congressional districts with a 6-4 or 7-3 Republican tilt.

For the two left over congressional districts, I’d lean to towards giving one to Central Texas and one to South Texas.  Both lean closer than the others to getting the extra seats.

In terms of the Electoral College, Democrats would come out ahead. The new division means the Senate and the Electoral College have to grow.

West Texas: 5 EV

Central Texas: 7 EV

South Texas: 10 EV

East Texas: 12 EV

North Texas: 12 EV

Republicans would conceivably win 36 EV, while Democrats would win 10 EV. The new reapportionment mean Texas gets 38 EV votes likely to go Republican.

36-0 Texas

The hardest thing for me to remember when making GOP friendly gerrymanders is that a 50% John MctCain district isn’t a toss-up but a likely R district, similar in theory to a 60% Obama District. 5 points more friendly to the gop then the nation as an average implies that, but it is somewhat tricky for me, at least, to wrap my mind around it. However, that was my goal when I started North Carolina: create as many districts that went GOP in 08 as possible. After getting an 11-2 in a state that went for Obama, i figured a 36-0 in Texas was possible. and it was. One district voted for Obama by less than 1000 votes, so I’m going to count it. A 59% Obama district would be okay for most of us here… Without further ado, MAPS!

As always, ask me and i will provide a zoomed in map of whatever area you wish if it isn’t clear from the big one.

http://img.photobucket.com/alb…

http://img.photobucket.com/alb…

El Paso: http://img.photobucket.com/alb…

District 1 (Blue):  Mccain 56%, 56% Hispanic

El Paso and Odessa

District 2 (Green): M 53%, 63% H

Rest of El Paso and some nearby counties

San Antonio and Austin: http://img.photobucket.com/alb…

District 3 (Purple): M 50%, 60% H

South San Antonio

District 4 (Red): M 51%, 50% H

North and West Antonio

District 5 (Yellow):  M 51%, 40% H, 10% Black, 3% Asian

East and North San Antonio

District 6 (Teal): M 50%, 72% H

Laredo and some Border counties, then up to West Texas

District 7 (Gray): M 50%, 66% H

McAllen and Border areas all the way up to Bastrop and Fayette Counties

District 8(Violet) M 51%, 62% H

Brownsville, Mcallen and then up.

District 9(Sky Blue): M 51%, 59%  H

Brownsville, Harlingen, up to Williamson and Milam counties.

District 10 (Pink):  M 50%, 35% H, 16% B, 3% A

Corpus Christi and up

Houston:  http://img.photobucket.com/alb…

District 11 (Lemon-Lime Green): M 55%,  55% White

South of  Houston

District 12 (Blue-Line Green) :  M 56%, 22% H, 20% H, 11% A

Some of the south-west of Houston and then surroundin areas.

District 13(Light Brown): M 53%, W 52%

Houston and some areas north

District 14(Gold):  M 57%,  W 61%

Houston and some areas north

District 15 (Orange): M 52%, 32% H, 19% B, 4% A

South of Houston, with a bit of the city

District 16(Lime Green):  M 52%, 39% H, 12% B, 4% A

Houston and Areas East

District 17(Navy blue): M 52%, 41% H,  16% B

Houston and Areas North East

District 18 (Golden Yellow):  M 56%, 56% W

North of Houston

District 19 (Puke Green): M 56%, 65% W

Wraps around 11-17

District 20 (Light Pink): M 52%, 59% W

Wraps around Austin and takes part of the city then to Abilene

District 21 (Blood Red): M 54%, 66% W

Parts  of Austin then  going to sparsely populated Northern Texas

District 22 (Poo Brown):  M 51%, 79% W

Austin and North Texas

Dallas-FW: http://img.photobucket.com/alb…

District 23 (Robin’s Egg Blue): M 54%, 57% W

Dallas and some northern suburbs

District 24 (Dark Purple):  M 56%, 59% W

Dallas and Some Eastern areas

District 25 (Rose): M 54%,  59% W

Dallas then to some less populated eastern areas

District 26 (Silver) M 58%,   54% W

Dallas, FW, then to North Texas

District 27 (Sea Green) M 49%, 54% W

Dallas, FW, then to North Texas

District 28 (Pinkish Purple) M 60%, 57% W

Irving, then up to North Texas

District 29 (Gray Green): M 53%, 60% W

Waco and Forth Worth

District 30 (slightly lighter shade of rose then

the one touching it): M 55%, 60% W

Parts of Arlington, Dallas and Fort Worth

District 31 (Tan): M 61%, 71% W

North Fort Worth and Dallas then North

District 32 (Red Orange): M 64%, 79% W

North FW and then northern areas surrounding it

District 33 (I can’t name that many different shades of blue): M 63%, 80% W

North of Dallas

District 34 (Somewhat dark-green): M 69%, 75% W

Wraps around a lot of other districts, filling in a lot of gaps

District 35 (Royal Purple): M 62%, 64% W

Everything Else Part 1

District 36 (Not Flyers Orange, but I’m using it anyways): M 68%, 69% W

Everything Else, Part 2

This is not a perfect 36-0 Map. The last 5-6 districts could bleed some republican voters to some of the more borderline districts. However, in an ok to good year, the republicans win all 36 seats barring an exceptional democratic candidate.

Dave’s seems to have deleted my other maps. I’ll redo them later and either edit this diary or do a new one, depending on what you guys thing.

BREAKING TX-HOUSE; Democrat switches Parties, Joins GOP

The Texas House is supposed to be one of our top priorities in 2010, however as of this morning it just got that much harder. Long time state representative Chuck Hopson announced he would be seeking re-election as a Republican.

Now, re-election for Hopson was going to be difficult. He barely scraped by in 2008 with 26, 042 votes (49.3%) over his republican opponent who got 25,928 votes (49.1%). At the same time Obama got clobbered in Hopson’s district 11 collecting only 27.5% of the vote to McCain’s 71.9%.

Hopson’s statement on switching parties is short, sweet, and shallow.

President Obama and the Democrats in Congress just don’t reflect the values of this district.”

Texas Democratic Party Chairman Boyd Richie released the following statement.

It takes strength and integrity to stand against the special interests – and while some members have that strength, others like Chuck Hopson, apparently do not. In the Democratic Party, there is room for members who are conservative and progressive – the only reason anyone would leave is for crass political reasons and a refusal to stand up to special interests.

Democrats lost three seats they previously controlled in 2008, one of them being an open seat with similar demographics to district 11, located in the area between San Antonio and Houston. Going into 2010, Democrats have another rural open seat near Withita Falls that is currently held by David Farabee. With Farabee and Hopson gone, the number of rural, white democrats in Texas are dropping precariously. I’m not sure how many are left now besides Mark Homer, Joe Heflin, and Stephen Frost.

Republicans now control the Texas House 77-73.

Resources:

Hopson’s district map – http://www.house.state.tx.us/m…

Source – http://www.texastribune.org/st…