Robert Ehlrich (R), the former Governor of Maryland is running against Martin O’ Malley (D) the incumbent Governor of Maryland. This is like a repeat of 2010 because the two same candidates are running for the same seat, except O’Malley is the Governor this time. Yes, Maryland is a Democratic state where Obama won 62% but a recent Rasmussen poll showed O’ Malley ahead by only three points. http://www.rasmussenreports.co…
Rasmussen usually leans to the right in their polling but still, Maryland should have a competitive race. O’Malley should win though. Obama had a boost from high African American turnout but most political people believe it will be lower. For your knowledge and enjoyment, I have created the baseline for Maryland counties which are the expected percentages for each candidate by county if the race is tied. I factored in the 2006 Gubernatorial election because Ehlrich and O’Malley were the candidates in it. I also factored in the 2008 Presidential election because the results are more recent and should reflect Republican and Democratic trends. The two elections combined should offer a clear picture of Maryland’s county baselines.
A bit about Ehlrich and O’ Malley’s past elections: Ehlrich won in 2002 by running far ahead of Republican percentages in the Baltimore County suburbs of Anne Arundel and Baltimore County (which does not include Balitmore City.) Ehlrich used to represent a congressional district in Republican Baltimore suburbs. In 2006, he was unable to pull big margins from them because O’Malley is the former mayor of Baltimore City and he was popular with the working class Baltimore suburban voters Ehlrich won in 2002. For example, he won Baltimore County with 61% in 2002 but lost by 300 votes in 2006. For Ehlrich to win, he needs to do very well with the working class voters. He did not so he lost with 53%-46%. Enough talk about elections, here are the baselines for 2010 if Ehlrich and O’Malley tied:
Wait, here are some helpful links:
For 2006 election: http://www.cnn.com/ELECTION/20…
For 2008 election:
http://www.cnn.com/ELECTION/20…
(I know the percentages do not line up correctly but I cannot fix it.) Now finally the baselines:
County Name O’Malley Ehlrich Other
Alleghany 32% 67% 1%
Anne Arundel 38% 61% 1%
Baltimore County 44% 55% 1%
Baltimore City 73% 26% 1%
Calvert 36% 63% 1%
Caroline 27% 72% 1%
Carrol 23% 76% 1%
Cecil 34% 65% 1%
Charles 49% 50% 1%
Dorcester 30% 69% 1%
Frederick 36% 63% 1%
Garrett 22% 77% 1%
Harford 30% 69% 1%
Howard 48% 51% 1%
Kent 39% 60% 1%
Montgomery 60% 39% 1%
Prince George’s 76% 23% 1%
Queen Anne’s 26% 73% 1%
Somerset 36% 63% 1%
St. Mary’s 33% 66% 1%
Talbot 32% 67% 1%
Washington 32% 67% 1%
Wicomico 34% 65% 1%
Worcester 30% 69% 1%
This is a map for those who like visual aides like myself. The map itself comes from census quick facts but I colored it in.
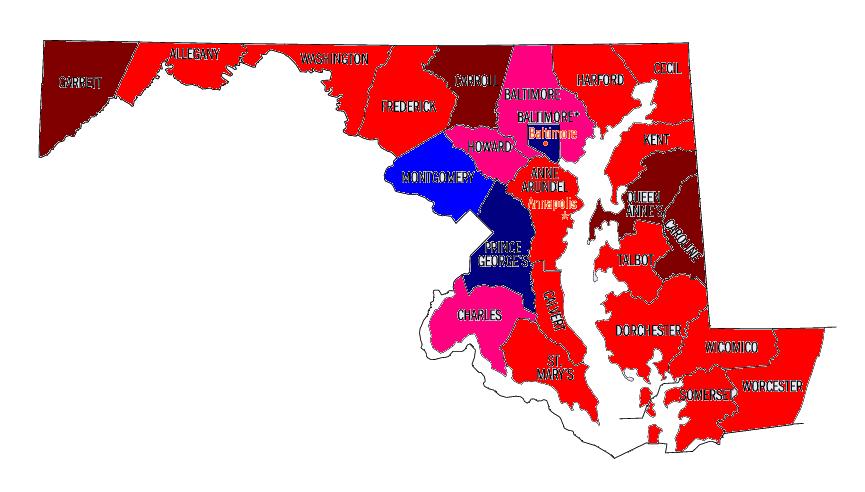
Dark Red=Ehlrich 70%+
Red=Ehlrich 60%-69%
Light Red=Ehlrich 50%-69%
Blue=O’Malley 60%-69%
Dark Blue= O’Malley 70%+
As seen in the baselines, O’Malley only wins the big three (Baltimore City, Montgomery and Prince George’s Counties.) I think he should barely win Charles County which is trending Democratic quickly. Overall, the baselines should fluctuate a bit but I wanted to stay with election results, not my personal opinion on each county. Any thoughts?
Update: Thank you to everyone who voted in the poll. I will be doing Nevada Senate next. You should see the post either tomorrow or in the next few days. After that, I will do Florida Governor.