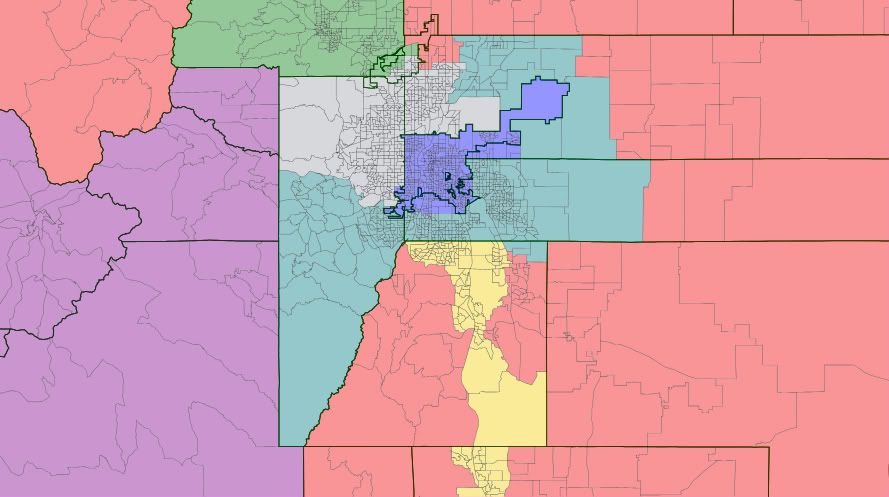
5-2 Colorado Dem map

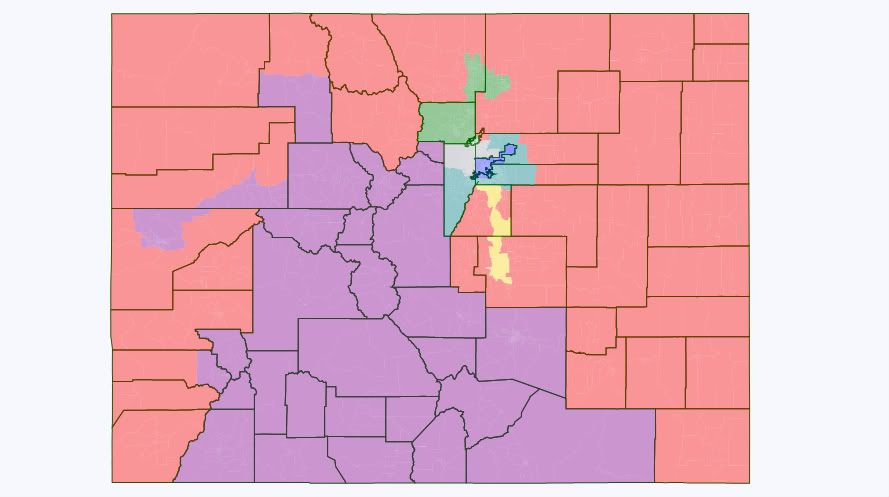
There have been many fantastic maps drawn that highlight the potential extremes of gerrymandering, from both political parties.  I humbly submit my attempt at making a safe 5-2 map in Colorado that will endure even in bad years for us.  Now, I know that either a compromise map or a court-picked one is likely due to the split control in the Colorado legislature, this is purely a what-if scenario if Democrats ran the process and were very aggressive.

Also, this is my first time using Dave’s redistricting app and I would appreciate comments and helpful criticism.

My goals were difficult.  Colorado is historically a Republican-leaning state and though our statewide ticket did great in 2010, we lost two of our five incumbent representatives.  The red counties simply got redder, but there is reason for optimism at the way some other areas of Colorado have trended, in particular the Denver area and suburbs, Boulder, and Fort Collins.

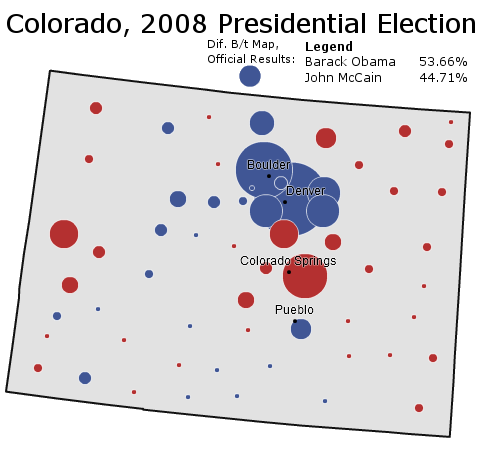
I started with this map as a baseline for what to expect in a tough election, that of the 2004 presidential race where Kerry lost Colorado by 5%, and compared that to Obama’s easy win in 2008.

Massive swings across the state, with the most impressive being those in the corridor from Colorado Springs, up to the top of the state.  Several counties flipped to blue in a big way…Larimer, Jefferson, and Arapahoe being the most significant I think for long-term Democratic strength in Colorado.

So it was my goal to build on the emerging Democratic strength in those areas, make two GOP vote sinks by combining Mike Coffman’s and Doug Lamborn’s districts, as well as Cory Gardner’s and Scott Tipton’s districts, and leave the rest reasonably safe for us.  Here goes:

In short, I looked to the maps being proposed by Colorado legislature Democrats for inspiration (primarily in what I did with CO-05, CO-06, and CO-07), and then read a number of good ideas in the comments that I tried to incorporate.

The maps proposed by Democrats in the legislature are good, and more or less ensure a 4-3 split for us by turning CO-06 into a Democratic district.  But they don’t budge the needle much in CO-03 or CO-04, leaving both as winnable, but still Republican-favored.  Such is the nature of compromise and preparing to win should they go to court.  I am free from such concerns.

1st-Dark Blue: (DeGette).  Tradition seems to favor keeping the oddly shaped Denver county as whole as possible in this district, but I clipped the northern parts, and moved this district more to the south, eating up a portion of Arapahoe County and even getting into the northern-most parts of GOP stronghold Douglas county.  It certainly drops at least 10 points worth of Democratic performance, but this doesn’t come close to being competitive.  The bulk of the district is in precincts Obama was hitting 70% in.  There’s simply no reason to waste so many Democratic votes in CO-01.  Stats: 67% White, 6% Black, 21% Hispanic, 4% Asian (old: 52% W, 9% B, 33% H, 4% A).

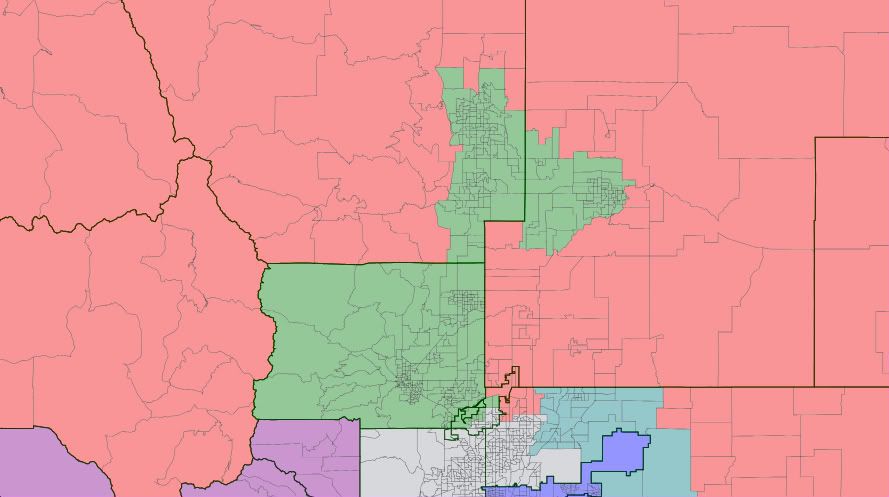
2nd-Green: (Polis).  State Democrats were already looking to expand this Boulder-based district out to grab more physical area than it has now.  Instead of sending him out to Grand Junction, I had him go north to take Larimer County (home of Fort Collins) which Obama won by 10%.  This is still a very safe Democratic district, and by depriving CO-04 of it’s biggest current county, I am able to do other fun things.  Stats: 81% W, 1% B, 13% H, 3% A (old: 79% W, 1% B, 15% H, 3% A).

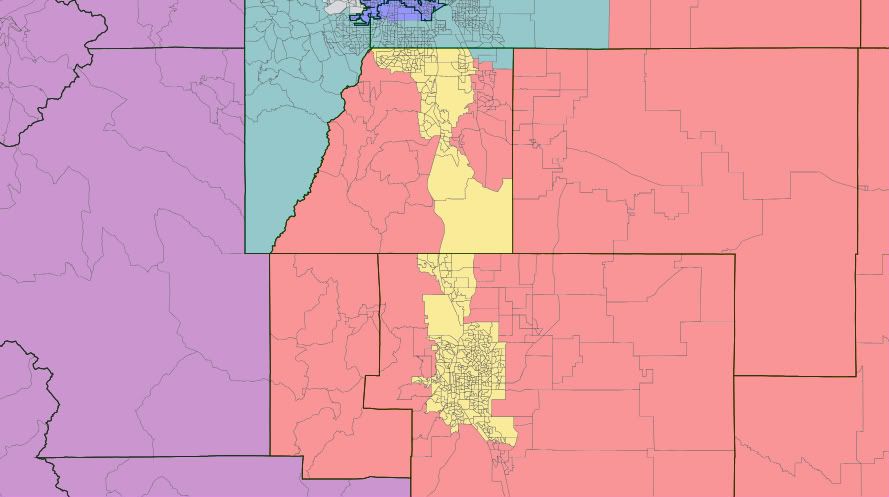
3rd-Light Blue: (no incumbent).  There’s Dem-leaning Pueblo, all by itself down there in the current CO-03, and the proposed Dem maps take GOP-stronghold Grand Junction out but put in a bunch of red counties currently in CO-04 and CO-05 that still makes it hard for us.  I simply chose to have it go for the ski counties instead, and turned this into a district I’m sure Obama won by a good margin.  Since the Dem maps already attempt to split El Paso county this time, I figured I might as well follow suit, and sent a finger up to grab a bunch of majority-minority precincts in southern Colorado Springs.  Even if that is not politically likely, just by removing all the ultra-red counties along the western border, and substituting them for central ski counties, we should be able to make a Democratic seat.  Stats: 69% W, 3% B, 24% H, 1% A (old: 75% W, 1% B, 22% H).

4th-Red: (Gardner and Tipton).  Now the fun begins.  By removing Fort Collins from CO-04, it must seek additional population, so I simply had it run around the perimeter of the state and go up through the conservative counties of the current CO-03, in effect combining both districts to make an ultra-GOP vote sink, based in Greeley and Grand Junction.  Yeah it looks bad, but hey the Republicans are always complaining that the rural counties don’t get a voice…here’s your dream district!  Stats: 75% W, 1% B, 20% H (old: 79% W, 1% B, 17% H).

5th-Yellow: (Lamborn and possibly Coffman).  An idea I borrowed from the legislature Democrats.  Why have two solid GOP districts along the I-25 when the districts can be narrowed and combined into an ultra-GOP vote sink?  Coffman doesn’t live in this district but unfortunately for him most of the current CO-06 is here, including his best performing areas in Douglas County.  He could try to run in the new Aurora-based 7th but he would get destroyed.  My guess is he would seek other office or retire.  He wouldn’t be the first guy to see his district evaporate.  Stats: 79% W, 3% B, 11% H, 3% A (old: 77% W, 6% B, 11% H, 2% A).

6th-Purple: (no incumbent).  Also basically copied from the proposed maps.  Changes from an exurban GOP stronghold south of Denver into an east suburban Aurora district.  Contains swingy areas in the south, but the northern half of this district contains some of the most heavily minority precincts in the state…Coffman has no chance in this district, no Republican does.  It skips across a few county lines, but it’s fairly compact compared to the oddly-shaped current CO-07 that contains a lot of this area right now.  Stats: 51% W, 12% B, 29% H, 5% A (old: 88% W, 2% B, 6% H, 3% A).

7th-Orange: (Perlmutter).  Drops most of the eastern Aurora-based earmuff and settles into a nice compact Jefferson County based district.  The location plays to Perlmutter’s strength in Jefferson but even if he leaves, the pieces in Denver and Adams county ensure it will stay blue.  Stats: 68% W, 1% B, 25% H, 3% A (old: 69% W, 6% B, 20% H, 3% A).
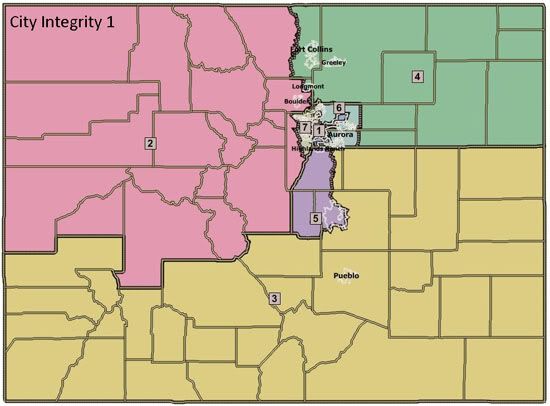
Colorado Redistricting: Maps from the “Kumbaya Committee”

Yesterday afternoon the 12 maps were released by the Joint Committee on Redistricting.  The committee has also been tagged as the “Kumbaya Committee” for it’s attempt to bring bipartisanshippyness to the most partisan issue possible.

Of the 12 maps, 6 were brought forward by the Democrats on the Committee and 6 from the Republicans.  All 6 Democratic maps followed a similar pattern of keeping whole cities intact as well as entire rural counties and were appropriately named “city integrity”.  The Republican maps all stayed close to the current map, probably realizing that’s the best deal they could get at this point.  

Several of the changes from both maps incorporated the wishes of different constituencies in the hearings the committee held all over the state.  The biggest wish “Keep us separate from Boulder.”  Other major wishes included putting Grand and Chaffee counties in the 3rd (or at least not in their current 2nd and 5th CDs) and keeping the city and county of Denver whole (which is a shame).  

I’ve only included 1 map from each side as the other 5 on both sides are similar to them and change only a county or city here and there.  

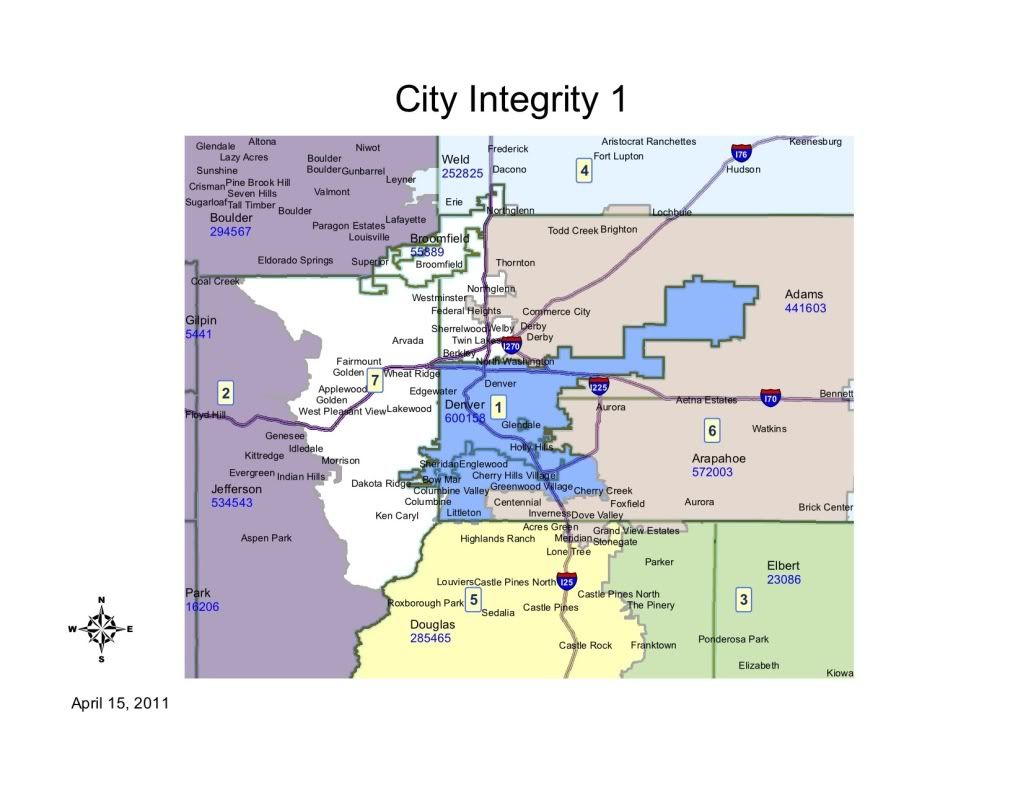
City Integrity 1

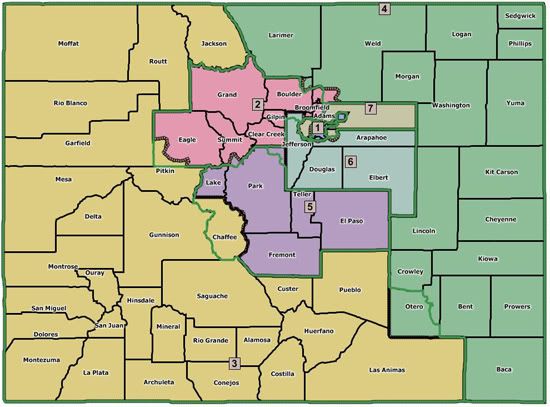
First, the Democrats map, known as “City Integrity 1.”  This is my personal favorite of all the Democratic maps and it’s also the “cleanest map” according to Sen. Rollie Heath (D-Boulder), co-chair of the committee.  All of the “City Integrity” maps strived to follow transportation corridors as well as striving for competitiveness.  The 1st, 2nd and 7th CDs are consistent throughout all the Democratic maps.

Photobucket

Photobucket

1st CD:  The 1st CD probably has the fewest changes.  It contains all of Denver County, Englewood, Cherry Hills Village, and Sheridan as before.  It adds Littleton, Greenwood Village, Bowmar, Cherry Creek Reservoir and some surrounding unincorporated areas of Arapahoe County.  The additions to the district are more Republican than the district as a whole, but the changes should be minimal, just making the district somewhat whiter than before.

2nd CD: The 2nd CD has some radical changes, going from it’s base in Boulder County (minus Longmont and Erie) west to take in all the north-west corner of the state.  The biggest new addition is Mesa County, one of the most Republican counties in the state and now the 2nd largest county in the district.  Chaffee, Lake and Park were taken from the 5th (as requested by the residents of Lake and Chaffee.  The district now includes all the major ski towns, Aspen, the oil and gas counties and the foothills towns in western Jefferson County.  If nothing else the district is now much more diverse in it’s interests and much more Republican.  The party break down is now 31 D, 31 R and 26 U, much more similar to the 7th CD when it was drawn a decade ago to be the most competitive.  We should be thankful Polis has more money than God and can probably hold this district in a non-2010 year.

3rd CD: The biggest disappointment of this map (especially to House Minority Leader Sal Pace of Pueblo) is the new 3rd CD.  It does a great job of keeping together the communities of interest in southern Colorado (despite what Republicans say, the south has more in common than the western slope and eastern plains as a whole).  It still contains all of Pueblo, but also adds Fremont, the rest of Otero, all the rural plains counties south of I-70 and the non-Colorado Springs portions of El Paso county, as well Parker and rural parts of Douglas county.  Overall this makes for a much more Republican district, probably out of reach for Democrats, but if you had to cut one loose, this was probably the district to do it with as several of the blue areas are shifting more and more R every year (San Luis Valley, Pueblo, Las Animas, Huerfano).  It still keeps Rep. Tipton’s home in Montrose so he can’t be too disappointed.

4th CD: The 4th CD needed to lose population and it did it with the most Republican parts of the district, now ending at Arapahoe/Washington/Yuma rather than taking in all the eastern plains down to the New Mexico Border.  It also loses the western half of Larimer County to the 2nd.  Most of the population lives in eastern Larimer so not much change other than shedding many republican precincts.  It then adds Erie and the eastern portions of Adams and Arapahoe counties, which are republican but not nearly as much as the counties given up.  These changes probably produce a district Obama and McCain were even in, if not a slight Obama win.  It becomes more winnable for Democrats, but still very competitive.  Sen. President Brandon Shaffer (D-Longmont) has to be pleased with this map as it keeps him in the district for a potential run.  Rep. Cory Gardner would not be happy at all with this district, but definitely still won it in it’s new configuration and the district keeps his home in Yuma.

5th CD:  Officially the southern I-25 corridor district, the 5th probably becomes even more Republican, adding most of Douglas, while shedding the swingier Chaffee and the blue Lake County.  Maintaining the home of Rep. Lamborn and also maintaing the districts center of gravity in Colorado Springs, the district will be to his liking (except for the absence of Fort Carson, which is now in the 3rd).  This is the beginning of the screwing-over of Rep. Coffman by taking out his best area in Douglas.  

6th CD:  The best change this map makes is the changing of the 6th from a suburban-Republican stronghold to a swingy eastern-suburban district.  While it keeps Coffman’s home in Aurora, he’s basically screwed in this district.  The extent to which this district takes in parts of Douglas and/or Weld changes between maps, but the heart of the district is the Arapahoe suburbs not in the 1st and most of the Adams Co. suburbs, including all the most hispanic areas.  Obama certainly won this district and in any normal year it would elect a solid Dem candidate.  This is probably the biggest reason this map will never be acceptable to the Republican House (while they have no love for Coffman I can’t see them being this willing to give up a safe seat).

7th CD: Another great change is in the 7th CD.  Keeping it’s base in Jefferson County, it sheds most of it’s Adams Co. areas and all of Aurora.  It then adds all of Arvada, Westminster, Northglenn and Broomfield (formerly in the 2nd).  It also takes in the Ken Caryl and unincorporated Jeffco (sometimes referred to as part of Littleton).  The district probably doesn’t change much in it’s tilt (maybe a very slight shift to the right), but it does remove the possibility of a Ryan Frasier challenge as he lives in Aurora.  This district makes more sense, while also maintaining it’s competitiveness.

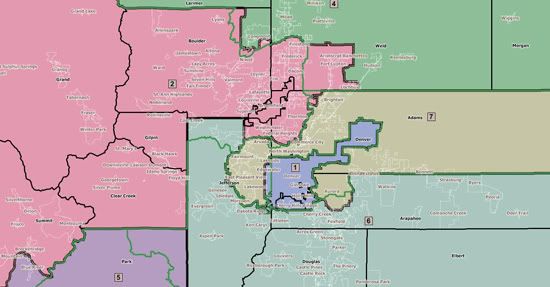
Balmer Map 1

The first Republican Map, known as “Balmer Map 1” for it’s author Rep. Balmer (R-Foxfield).  It is typical of all the Republican maps, keeping to the current boundaries as much as possible.  The biggest changes are the removal of Chaffee county from the 5th, the rest of Otero county in the 4th and more of Weld into the 2nd and southern Aurora into the 7th.  

The map below has helpful green lines where the current districts are so you can track the changes.

Photobucket

Photobucket

1st CD: Few changes here, but to add population the lines were moved from the county line between Denver to Jefferson (Sheridan Blvd.) to Wadsworth Blvd., all the precincts in between include parts Wheat Ridge and Lakewood and are probably some of the most Democratic precincts in Jefferson county.  The district remains as Democratic as before.

2nd CD: Biggest changes here were putting south-west Eagle County into the 3rd, a sliver of summit into the 5th to balance population there and the addition of Fort Lupton in Weld County.  The meter will be moved very little here either.  

3rd CD: The addition of Chaffee county is the biggest change along with the removal of the rest of Otero.  Little change here, but maybe a smidge in the Democratic direction.  

4th CD: Only the addition of the rest of Otero and the removal of Fort Lupton, doubtful to have much impact on the partisan make up.

5th CD: Removal of Chaffee county and the addition of the rest of Park and the Summit County Sliver, making it just a point or 2 more Republican.

6th CD: While appearing to have little change, the 6th actually has the most radical change in that it removed Rep. Coffman’s home in southern Aurora and puts it in the 7th!  Coffman has already reacted to the maps, lashing out at the Democratic maps for not including his home in his current district, when in fact they do…  But he plans to move to Greenwood Village, so he is actually angry at his future home being removed from the district and isn’t mad at the Republicans at all for screwing out of a district in their maps.  Gotta love that!

7th CD: Almost no change, except now being the home to Rep. Coffman!  

Likely result

Unless the “Kumbaya Committee” suddenly has a desire to actually work together, looks like neither of these maps or any of the other 10 maps will make it.  The rural Republicans are already screaming about the dividing of the eastern plains and western slope, which they consider to be “communities of interest.”  So we’re more likely than not to have the issue before the courts.  Lucky for Dems the Colorado Supreme Court is packed with Democratic-appointed Justices and in 2000 they chose the current map, which was proposed by Democrats.  

Democratic Gerrymander of Colorado

I had several goals here:

1. Knock out either Gardner or Tipton

2. Keep a district that Perlmutter can continue to hold relatively easily.

3. Make Coffman have to actually campaign, at the very least.

4. Create a district that Salazar or another moderate Dem can win and continue to hold.

Photobucket

District 3 (Purple): This is currently represented by Scott Tipton, but he lives in the new 4th, and would probably much rather try to primary Gardner than hold this marginal seat. The seat is now Pueblo-based and adds all the liberal ski towns from the 2nd district.  It does add conservative Park and Fremont counties from the 5th, but its loss of all the heavily GOP counties on the Western Slope more than offsets that.  It has a little arm reaching back to nab Grand Junction in order to meet population equality.  My best guess is this goes from its current R+5 rating to around R+1 or R+2. Salazar probably would have won re-election if he had this in 2010 and could easily win in any other year.  Other possible candidates include State House Minority Leader Sal Pace of Pueblo.

Likely D if Salazar runs; tossup otherwise

District 4 (Red): This GOP vote sink manages to combine both Cory Gardner, who lives in Yuma in northeast Colorado, and Scott Tipton, who lives in Cortez in southwest Colorado.  It contains all of the heavily GOP counties on both the Eastern Plains and Western Slope.  In addition, it loses both Fort Collins and Greeley, resulting in perhaps the most Republican district in the state.  It could be anywhere from R+15 to R+20.

Safe R

Metro Denver:

Photobucket

District 1 (blue): This is Diana DeGette’s Denver-based district.  Other than adding a few Arapahoe County precincts for population equality, not much of a change here. It’s currently D+21

Safe D

District 6 (teal): This is Mike Coffman’s suburban district, currently R+8.  However, it sheds extremely wealthy and conservative Douglas Country, as well as rural Elbert County, and the rural eastern part of Arapahoe County.  It adds a bunch of suburban areas in slightly D-leaning Jefferson and Adams Counties.  Although Coffman could probably still be able hold it, this would become a toss-up if he vacates the seat.  This is probably between R+3 and even PVI.

Lean R for Coffman, Tossup if open

District 7 (gray): This is the other suburban Denver district, currently held by Ed Perlmutter.  It basically just trades parts of Adams County for Jefferson County, which is pretty much a wash, and is probably still around the current D+4, but after dismantling Fraiser by 11% in 2010, he’s definitely safe.

Likely D for Perlmutter, Lean D if open

Northern Colorado:

Photobucket

District 2 (green): Jared Polis’ Boulder-based district sheds the ski towns, but adds liberal Fort Collins and Greeley to remain safe.  Probably unchanged much from the current D+11.

Safe D

Colorado Springs:

Photobucket

District 5 (yellow): This incredible GOP vote sink, held by Doug Lamborn, takes in Colorado Springs and a bunch of extremely wealthy parts of Douglas County: Castle Pines, Castle Rock, Lone Tree, etc.  It sheds liberal Lake County and swingy Chaffee County to the 3rd, as well as conservative, prison-filled Park and Fremont Counties.  It is probably even more Republican than its current R+14, and could be approaching R+20.

Safe R

So, here’s a recap:

District 1: Diana DeGette, Safe D

District 2: Jared Polis, Safe D

District 3: likely D for John Salazar, tossup otherwise

District 4: Cory Gardner/Scott Tipton, Safe R

District 5: Doug Lamborn, Safe R

District 6: Mike Coffman, Lean R for Coffman, tossup otherwise

District 7: Ed Perlmutter, Likely D for Perlmutter, lean D otherwise

CO, OR, and WA: Population by CD

(Bumped – promoted by DavidNYC)

We’ve got three more states’ worth of Census data dump to look at today, and instead of a random collection today, it’s thematically consistent: the three medium-size light-blue states of the west. First off the bat is Colorado, which stays at seven seats; its target population is 718,457, up from an average of about 615K in 2000. (Remember, the “deviation” is how many seats the district will need to gain or shed in order to conform, not a raw number reflecting loss or gain. You can calculate raw gain/loss by working off the 2000 target, if you’re curious.)


District Population Deviation
CO-01 662,039 (56,418)
CO-02 733,805 15,348
CO-03 706,186 (12,271)
CO-04 725,041 6,584
CO-05 725,902 7,445
CO-06 797,813 79,356
CO-07 678,410 (40,047)
Total: 5,029,196

The redistricting solution here seems pretty simple: CO-01 (Denver proper) and CO-07 (Denver’s northern suburbs) will need to shift southward to accommodate the large growth in CO-06 (Denver’s southern suburbs), while the rest of the state stayed pretty stable. Interestingly, despite CO-07 lagging the state growth-wise, the state’s strongest Hispanic growth was in CO-07, which since 2000 went from 20% to 28% Hispanic.

Oregon stays at five seats, having just barely missed the cut for #6. Its target population is a beefy 766,215, up from about 684K in 2000.


District Population Deviation
OR-01 802,570 36,355
OR-02 769,987 3,772
OR-03 762,155 (4,060)
OR-04 739,234 (26,981)
OR-05 757,128 (9,087)
Total: 3,831,074

Several Oregon districts are going to have to shift north, where the state’s growth was centered in Portland’s western suburbs in OR-01. The smallest gains happened in OR-04, which is Eugene and the economically-hard-hit timber country to its south. OR-05, which is sandwiched between the 1st and 4th in the mid-Valley also needs to pick up population; the 5th is the state’s most Hispanic district, going from 10% to 15% Hispanic since 2000.

Finally, here’s Washington, which barely made the cut, and got its tenth seat. Its target is 672,454, up from 655K in 2010. (Interestingly, if you divided Washington by 9, you’d wind up with a lower target than Oregon, at 747,171. There’s a lot more to the reapportionment formula than that sort of purely mechanical calculation, of course, but that ought to raise a few eyebrows in Oregon.)


District Population Deviation
WA-01 739,455 67,001
WA-02 760,041 87,587
WA-03 779,348 106,894
WA-04 774,409 101,955
WA-05 723,609 51,155
WA-06 709,570 37,116
WA-07 704,225 31,771
WA-08 810,754 138,300
WA-09 723,129 50,675
Total: 6,724,540

The two main nodes of growth in Washington are WA-08 (Seattle’s eastern suburbs) and WA-03 (Vancouver, which is really Portland’s northern suburbs). However, there was almost as much growth in WA-04, east of the Cascades, which means that any new configuration is going to have two-and-a-half districts east of the Cascades, with (unlike now) one district traversing the mountains. The 4th is also by far the most Hispanic district in the state, growing from 27% to 34% Hispanic since 2000. One other interesting tidbit: in three of the state’s nine districts (1st, 7th, and 8th, all in the Seattle area) the largest non-white group isn’t African-Americans or Hispanics, but rather Asians.

More over the flip…

Finally, did you know that Census 2010 data, via American FactFinder, is available not only at the congressional district level, but also the legislative district level? Because a) I’m a Washingtonian, and b) I’m a nerd (and c), it’s not that big a project, since Washington doesn’t have separate Senate and House districts), I thought I’d also include Washington broken down by LD, in case you want a finer-grained sort on the state’s population gain. The number of districts will stay at 49, so the new target is 137,236.


District Population Deviation
LD-01 147,265 10,029
LD-02 163,707 26,471
LD-03 120,601 (16,635)
LD-04 141,254 4,018
LD-05 161,403 24,167
LD-06 141,123 3,887
LD-07 130,475 (6,761)
LD-08 149,474 12,238
LD-09 136,166 (1,070)
LD-10 134,117 (3,119)
LD-11 134,027 (3,209)
LD-12 132,531 (4,705)
LD-13 143,750 6,514
LD-14 130,478 (6,758)
LD-15 132,788 (4,448)
LD-16 154,830 17,594
LD-17 150,727 13,491
LD-18 160,083 22,847
LD-19 126,904 (10,332)
LD-20 141,029 3,793
LD-21 133,156 (4,080)
LD-22 141,695 4,459
LD-23 130,119 (7,117)
LD-24 132,679 (4,557)
LD-25 145,035 7,799
LD-26 133,755 (3,481)
LD-27 123,857 (13,379)
LD-28 119,494 (17,742)
LD-29 127,259 (9,977)
LD-30 129,998 (7,238)
LD-31 137,685 449
LD-32 122,038 (15,198)
LD-33 129,246 (7,990)
LD-34 125,055 (12,181)
LD-35 138,142 906
LD-36 133,901 (3,335)
LD-37 127,546 (9,690)
LD-38 129,624 (7,612)
LD-39 143,154 5,918
LD-40 138,925 1,689
LD-41 142,722 5,486
LD-42 146,619 9,383
LD-43 133,976 (3,260)
LD-44 156,499 19,263
LD-45 136,432 (804)
LD-46 127,849 (9,387)
LD-47 140,146 2,910
LD-48 130,423 (6,813)
LD-49 134,779 (2,457)
Total: 6,724,540

What’s that you say? You don’t have the Washington legislative district map committed to memory? And yet you call yourself a Swingnut? Well, here it is. The largest growth came in LDs 2 (eastern Pierce Co.) and 5 (eastern King Co.), which are the most exurban parts of WA-08, as well as 44 (eastern Snohomish Co.: exurban WA-02), and 18 (northern Clark Co.: exurban WA-03). The slowest growth was in LDs 3 (downtown Spokane), 28 (Lakewood and Fort Lewis, south of Tacoma), 32 (Shoreline and Edmonds, north of Seattle), 27 (downtown Tacoma), and 34 (West Seattle). (If you’re wondering what the lean of these districts is, we’ve got that, too.)

5D-2R in Colorado (UPDATED: Now with a VRA district as well)

The Dems came extremely close to controlling the redistricting trifecta in CO, losing the state house of reps by a single seat. If the Dems had won that house seat last year, or if they could somehow convince one of the Republicans in the house to switch parties or support a Democratic redistricting plan, here is one way the Democrats could draw a reasonably compact 5-2 map of Colorado.

Denver Area:

The two districts that are the most changed under this map are the 3rd and the 4th. The new 3rd is a C-shaped district that includes the Hispanic areas in the Southern part of the state, the liberal rocky mtn ski towns, and some swingy areas in Jefferson county. Despite the fact that the Jeff Co areas are swing regions, this district is safely Democratic as those areas only make up about one third of the district’s population. A GOP candidate could get up to 60% of the vote in the Jeff Co part of this district and still lose overall due to the heavy Democratic lean of the other areas. The one problem with this district is that rep Ed Perlmutter actually lives here. This shouldn’t be a problem in terms of losing to a Republican (he’s more vulnerable in his old district than here), but he may not want to represent a district composed of so much new territory.

The new 4th is composed of Greeley, Fort Collins-Loveland, and some mainly Hispanic areas in Weld and Adams counties. Between the white liberals in Greeley and Fort Collins and the Hispanics in Adams Co, it should be all but safe democratic. I could see this district maybe going red in a midterm year with low Hispanic turnout, but even that would probably be a stretch, and getting less likely with every passing year as this area trends more and more democratic. Still this is probably the least Democratic of the 5 D districts on this map, which is a testament to how Democratic this map is more than anything else.

The 2nd district around Boulder is almost unchanged. The 1st has shed some areas in Denver Co to the 7th and gained some suburban areas around Littleton in order to shore up the 7th. The  1st is now less Democratic but still enough for Diana DeGette to be completely safe. The 7th has lost a lot of territory in Adams and Jefferson counties, but it has gained some African-American and mixed African-American and Hispanic areas in Denver along with some areas in Weld and Morgan counties. At 59% White it is the most minority-heavy of all these districts, and should be much safer for Democrats now. Lastly, the 5th and 6th serve as GOP vote dumps in Colorado Springs and the outer areas of the state, respectively.

UPDATE

There was some discussion in the comments of the potential effects of the VRA on Colorado. It is actually possible to draw a compact plurality-hispanic district in Denver and Adams Co. My initial guess was that this would wind up hurting Democrats significantly. This turned out to be partially true, but much less than I originally thought. The basic methodology of the map remains the same; Draw a C-shaped district combining the Denver suburbs, the Hispanic areas in South CO, and the liberal ski towns, and attach Fort Collins and Greeley to something other than ruralconservativeland. It turns out looking like this:


Denver Area:


Under this map, the 1st district is 43% W, 8 %B, 44% H. It is possible to make it as much as 39-ish percent white if you want to, but once it crosses the 50% non-white line there is no legal obligation to make it more non-white so I decided to leave it 43% white in order to make the surrounding districts safer. One big change under this map is that the 4th is now drawn down to Boulder instead of Adams Co. This saves the Democrats the trouble of having to find someone to run in what was under the first map their weakest district. The other change is that the 2nd district is now mainly a Jefferson Co based district, with a bit of Arapahoe Co and the SW tip of Denver Co thrown in. This is probably the worst thing for the Democrats on this map, as I suspect the PVI of this district is something like D+2 or 3, making it only a slightly D-leaning seat. It also has no incumbent, as rep Perlmutter’s home is still in the 3rd. This area is trending Democratic very quickly, though, so if the Dems have to draw a VRA seat then I wouldn’t totally freak out about this one. The 7th, having lost a lot of nonwhite territory to the 1st, now has taken on the majority-white sections of Denver. I don’t know where Rep Diana DeGette lives in Denver, however I would guess she probably lives in one of the mainly white areas, so she probably runs in the 7th under this map, opening up the new 1st for a Hispanic representative. The 7th, like the 4th, has probably moved towards the Democrats under this map. The 3rd, OTOH, has moved to the GOP here, as it has taken on the rural areas previously in the 2nd, a tiny part of Douglas Co, and Crowley and Otero counties in the south which are GOP leaning but have significant Hispanic minorities. Overall, this new 3rd is probably Likely D at worst. So the net shift to the GOP from creating a new Hispanic-plurality district is at most one district. The biggest loser under this new VRA scenario seems to be compactness and community-of-interest contiguity (I particularly don’t like the idea of splitting Denver Co between multiple districts), not necessarily the Democratic Party.

Redistricting outlook: California-Connecticut

Now that it’s 2011, the redistricting games will soon begin in earnest, with more detailed Census data expected in February or March and some states holding spring legislative sessions to deal with drawing new maps. Long ago I planned to do state-by-state rundowns of the redistricting process as soon as 2010 election results and Census reapportionment were clear. Now that time has arrived, and it’s time to look at California, Colorado, and Connecticut.

Previous diary on Alabama, Arizona, and Arkansas

The rest below the fold…

California

Photobucket

Districts: 53

Who’s in charge? Nonpartisan commission

Is that important? Heck yes

Boy, is this the big kahuna. With California’s delegation comprising 12.2% of the entire House, and 17.6% of the whole Democratic caucus, the Golden State was already a dominant player in the nationwide redistricting wars, but with its recent switch from legislative control (which would have meant a Democratic gerrymander in 2011) to a nonpartisan commission, any semblance of certainty is out the window. The commission must preserve VRA-protected minority seats, of which there are at least 12 (Barbara Lee’s 9th, Jim Costa’s 20th, Xavier Becerra’s 31st, Judy Chu’s 32nd, Karen Bass’s 33rd, Lucille Roybal-Allard’s 34th, Maxine Waters’s 35th, Laura Richardson’s 37th, Grace Napolitano’s 38th, Linda Sanchez’s 39th, Joe Baca’s 43rd, and Loretta Sanchez’s 47th) and  several more if you interpret the law as protecting Latino-majority/plurality districts represented by non-Hispanic whites.

Republicans say the losers in California redistricting will be white Democrats representing less-than-completely-solid seats (such as Jerry McNerney and Dennis Cardoza), seats likely to be broken up and redistributed between other districts (such as Lois Capps), or seats likely to be turned into VRA-protected minority districts (such as one of the San Fernando Valley Dems: Berman, Sherman, or Schiff). Democrats say that the current map is not that gerrymandered in their favor, and is instead an incumbent protection gambit; they argue that nonpartisan redistricting will ruin as many GOP incumbents (Ken Calvert and Gary Miller, say) as Dem incumbents. In any case, few solid predictions can be made at this point, and I’d like very much to hear what those of you at SSP think will happen. If forced at gunpoint to predict something about the new map, I’d say a seat will be shifted from the Bay Area to the Inland Empire, and that Jerry McNerney is the likely “eliminee,” though it could also be a longtimer like George Miller or Pete Stark. Also, a competitive Central Coast district will be recreated à la the California 22nd in the 1990s, hurting the reelection prospects of both Lois Capps and Elton Gallegly. Demographics will also compel the commission to create a couple new Hispanic districts, at least one of which will be a reconfiguration of a seat now represented by a white L.A. Democrat.

The commission’s membership has been finalized and its work should be complete by sometime this autumn. I, for one, greatly look forward to the fireworks.

Colorado

Photobucket

Districts: 7

Who’s in charge? Split (Dem Governor and Senate, GOP House)

Is that important? Not really

The bare Republican majority in Colorado’s House should ensure a safer seat for Scott Tipton in the 3rd (represented by a Republican from 1992 to 2004 and a Democrat from 2004 to 2010), but otherwise won’t change the partisan dynamics much in Colorado. Overwhelming Democratic edges for Diana DeGette in Denver and Jared Polis in the Boulder area may be diluted a bit to create a rock-solid constituency for Ed Perlmutter, but that will be the only tangible benefit for Team Blue.

Connecticut

Photobucket

Districts: 5

Who’s in charge? Democrats

Is that important? No

An overwhelmingly Democratic legislature will draw districts for an already all-Democratic House delegation. Jim Himes and Chris Murphy should get slightly safer seats at the marginal expense of rock-solid incumbents John Larson and Rosa DeLauro, but that will be the extend of remapping drama in the Nutmeg State.

Later this week: Florida, Georgia, and Hawaii!

Maps of Colorado Elections

To follow up the series of posts on Colorado, I’ve posted a few recent presidential elections in the state (courtesy of the New York Times). Each map comes with some brief analysis.

Photobucket

Boosted by a Democratic National Convention held in Denver, Senator Barack Obama wins a thorough victory in the ultimate swing state of 2008. The Democratic candidate does especially well in the Republican-leaning suburbs of Denver – winning several outright and dampening margins in Douglas County and Colorado Springs.

More below.

Photobucket

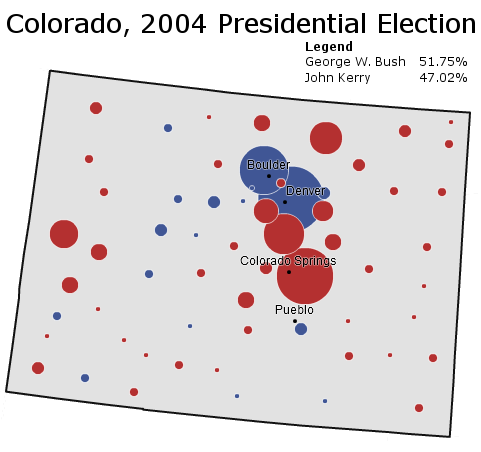
Written off early as a sure Republican victory, Colorado surprises pundits in 2004 with a surprisingly strong Democratic performance. It is one of the few states where Democrats do better than in 2000 as they pick up the 2000 Ralph Nader vote.

______________________________________________________

Photobucket

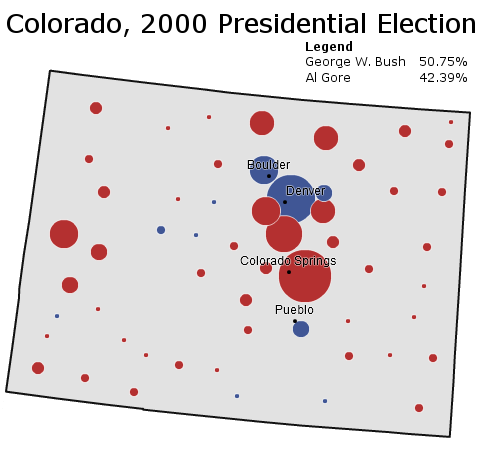
Governor George W. Bush performs well throughout the Rocky Mountains in 2000, and Colorado is no exception. With Green Party candidate Ralph Nader pulling off a substantial bloc of liberal voters, Mr. Bush even cracks the Democratic “C” that composes the Democratic base of Colorado.

______________________________________________________

Photobucket

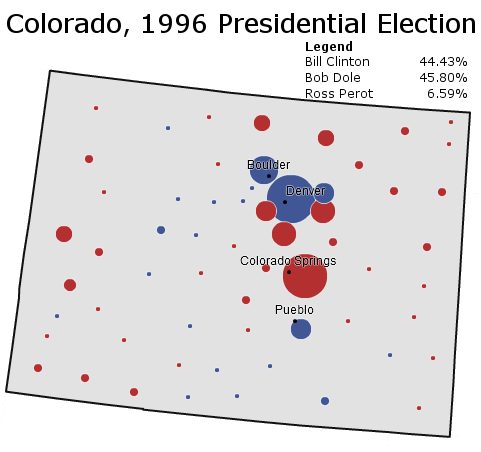
Conservative Colorado returns to form in 1996; President Bill Clinton loses the state by the barest of margins as conservative Ross Perot voters go Republican. Republican Bob Dole wins based off Republican strength in Colorado Springs and rural Colorado.

______________________________________________________

Photobucket

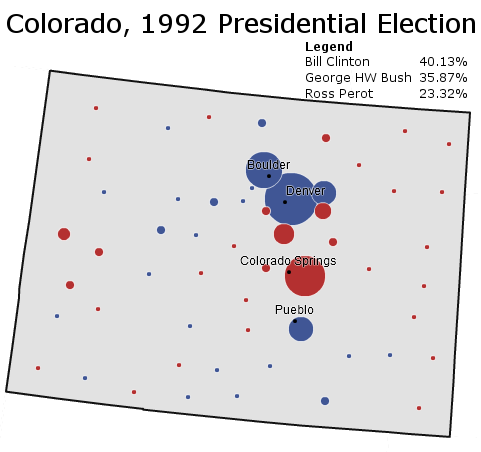
Surprise! – reliably Republican Colorado votes Democratic for the first time in a generation, and for the first time in a competitive race since the days of Harry Truman. To be fair, this map somewhat overstates Democratic strength: Republican margins are dampened by Ross Perot’s strength amongst conservatives.

–Inoljt, http://mypolitikal.com/  

Colorado Bipartisan Map (Updated!)

Cross posted on my blog http://frogandturtle.blogspot….

By winning one race by only 157 votes, Republicans control one house of the Colorado State Legislature so Democrats do not hold the trifecta in Colorado anymore. So instead of a possible Democratic gerrymander where they could retake the 3rd and 4th districts, the Democrats will probably end up with a bipartisan incumbent protection which is more favorable to the Republicans. The new Republicans may feel vulnerable because many of the new ones are in marginal districts they won in a very Republican year so the Democrats might work out a deal at protecting those Republicans in exchange for controlling congressional redistricting. That is not very likely though and I drew this map assuming it is a bipartisan deal. Ed Perlmutter (D) of Colorado’s 7th district is strengthened as well as newly elected Scott Tipton (R) of Colorado’s 3rd district and Cory Gardner (R) of Colorado’s 4th Congressional district. In 2002, Colorado was 5-2 Republican and in 2008, it shifted to 5-2 Democratic. The Republicans have the majority in the delegation now though with 4-3. Although Republicans came back a bit in 2010, I still think Colorado is trending Democratic due to Democrats moving into the Denver area from California. This movement could make districts such as the 6th competitive in the future, but for now, all incumbents will be much safer. Now, here are the maps:

link for current maps: http://www.nationalatlas.gov/p…

Photobucket

Denver area

Colorado’s 1st Congressional District: Diana DeGette (D) Blue

Obama won 70% (estimate)

Demographics: 8% African American, 37% Hispanic, 49% White

Old Demographics: 10% African American, 33% Hispanic, 52% White

Major Cities: Denver, Barr Lake

Status: Safe Democratic

DeGette’s district actually becomes a bit more Republican. I removed the Democratic suburbs around Englewood and replaced them with more moderate suburbs such as Brighton and Barr Lake. DeGette may not like having the new territory (and she even loses some Denver neighborhoods) but since the district is still mostly in Denver, she should have no problems at all facing reelection. Her district is now the only minority majority district in Colorado.

Colorado 2 Jared Polis (D) Green

Obama won 66% (estimate)

Demographics: 15% Hispanic, 80% White

Old Demographics: 18% Hispanic, 76% White

Major Cities: Boulder, Broomfield, Aspen

Status: Safe Democratic

Polis was already safe but his district becomes a Democratic vote sink to shore up the 3rd district now held by Scott Tipton (R). If Democrats had the trifecta here, they could have unpacked this district to make the 3rd district Democratic enough for John Salazar (D) to retake but as it is, the 2nd will take Democratic areas out of the 3rd. The 2nd loses all of Adams and Larmier Counties. The 2nd is more of a Rocky Mountain district now by picking up Democratic ski resort counties such as Routt (Steamboat Springs,) Pitkin (Aspen,) and Gunnison (Crested Butte.)

Photobucket

North Colorado

Photobucket

South Colorado

Colorado 3 Scott Tipton (R) Purple

McCain won 52% (estimate)

Demographics: 22% Hispanic, 73% White

Old Demographics: 22% Hispanic, 73% White

Major Cities: Pueblo, Grand Junction

Status: Likely Republican

Under a bipartisan plan, Tipton will be strengthened but due to the current demographics, strengthening Tipton is difficult without making convoluted lines or putting the 4th district Republican in jeopardy. I strengthened Tipton by removing Pitkin County (Aspen) as well as some other ski areas that I put in the 2nd. I added conservative Park County and a few conservative rural counties in southeastern Colorado. Obama also over performed the district’s usual Democratic percentage here due to high turnout in the ski areas but the district may become competitive again if Hispanics keep trending Democratic. This would be an opening for Salazar who is Hispanic and could do win enough Hispanics to beat Tipton. Salazar has an uphill battle though with the ski areas in the 2nd district though.

Colorado 4 Cory Gardner (R) Red

McCain won 52% (estimate)

Demographics: 18% Hispanic, 78% White

Old Demographics: 19% Hispanic, 76% White

Major Cities: Fort Collins, Greeley, Lamar

Status: Lean Republican

Due to population purposes, strengthening this district was difficult but I still made Gardner safer. I removed some Democratic areas in Adams and Boulder Counties. The district needs to shed territory anyway due to population growth but I added Elbert County as well as the conservative rural parts of Adams and Arapahoe Counties. Betsy Markey (D) who held this district from 2008 to 2010 might be able to win in a Democratic year here but the district’s changes will make winning harder for her.

Colorado 5 Doug Lamborn (R) Yellow

McCain won 59% (estimate)

Demographics: 5% African American, 13% Hispanic, 76% White

Old Demographics: 5% African, 13% Hispanic, 75% White

Major Cities: Colorado Springs, Castle Rock

Status: Safe Republican

At a first glance, this district appears to undergo major changes but population wise, it does not. It just loses some rural counties to the west to make the 3rd district more Republican while picking up a large portion of Douglas County. Lamborn was already safe with strongly Republican Colorado Springs in his district but he is just as safe now, if not safer.

Colorado 6 Mike Coffman (R) Teal

McCain won 52% (estimate)

Demographics: 9% Hispanic, 82% White

Old Demographics: 8% Hispanic, 84% White

Major Cities: Parker, Centennial

Status: Likely Republican

Coffman’s district says pretty similar demographically but his district becomes more difficult to hold. He picks up a large portion of Lakewood which formally was in the Democratic leaning 7th district while losing part of heavily Republican Douglas County. Although Coffman may be safe now, Jefferson and Araphaoe Counties are becoming more Democratic and now that they have more people in the district, Coffman may be in trouble in the end of the decade. That should however give him enough time to become entrenched in his district so he can fend away any challenge. The Republicans probably want Coffman to have more territory but that will be hard because the 3rd and 4th districts need their Republican areas.

Colorado 7 Ed Perlmutter (D) Orange

Obama won 62% (estimate)

Demographics: 7% African American, 27% Hispanic, 60% White

Old Demographics: 6% African American, 26% Hispanic, 61% White

Major Cities: Aurora, Lakewood, Arvada

Status: Safe Democratic

Although Obama won 59% under the current lines, the district was originally drawn as a swing district so Perlmutter will probably have a safer district on his wish list. This is what the new map does by adding in a few Denver neighborhoods. It also picks up more of Democratic Aurora while losing the less Democratic parts of Lakewood. Perlmutter also gains more of Adams County by picking up more of Westminister although he loses the rural eastern part to the 4th district. Perlmutter should be much safer, although he seemed to be doing fine already.

Updated:

After looking at the suggestions, here is my new version of Colorado:

Photobucket

Colorado

Photobucket

Denver area

Colorado 1

10% African American, 39% Hispanic, 46% White

(minority majority!)

Colorado 2

13% Hispanic, 81% White

I send it to Fort Collins to help shore up the 4th but Polis should be safe since he still has Boulder, he picked up Routt County and Fort Collins went for Obama.

Colorado 3

22% Hispanic, 73% White

This district is now basically split by picking up Eagle County.

Colorado 4

19% Hispanic, 77% White

This district is now safely Republican with the loss of Fort Collins and the inclusion of Douglas County.

Colorado 5

6% African American, 13% Hispanic, 75% White

The lines are basically the same as the old district.

Colorado 6

9% Hispanic, 83% White

Colorado 7

5% African American, 25% Hispanic, 63% White

This district gets a bit whiter but picks up some white parts of Denver so this district is more Democratic than it looks.  

By what margin will Bob Shamansky win?

View Results

Loading ... Loading ...

My Last Senate Rankings: Tossups Galore

Cross posted at my blog http://frogandturtle.blogspot…. which you should visit for more election analysis.

Pundits always say that when election day is really close, some candidates start pulling away from the opponent. In West Virginia, we are seeing that. Joe Manchin (D) was in a close race with John Raese (R) but Manchin retrieved his lead when Raese made some gaffes such as looking for “hicky” people in an ad and then the controversy of his house in Florida (his wife is not even registered to vote in West Virginia.) Not all tossup races though have an incumbent pulling away in then end. In Pennsylvania, Toomey is leading by about 3 and his seems to have stopped Sestak’s surge. Sources on the ground in Philadelphia though tell me that the GOTV operation there is in full swing for Sestak and if a larger than expected turnout occurs in Philadelphia, Sestak will be much closer and maybe win. Races though that have stayed as pure tossups include Illinois, Colorado, Washington and Nevada. In Illinois, Mark Kirk (R) seems to be gaining a few points but the Obama rally may have woken up the base enough to beat him. Colorado has an interesting race where Michael Bennett (D) is winning because he is pushing a woman’s right to choose as a big issue and it seems to be working. Ken Buck (R) leads heavily among men while Bennett has a big lead with women. The race that should shock the pundits though is Nevada. All polls show a small Angle lead but what I see is a dead heat. The early voting in Nevada presents good results for the Democrats and people on the ground have mentioned how all the Democrats there are planning to vote.

There is one race though the Republicans must pick up to win the Senate. West Virginia and California both look stronger for the Democrats so if the Republicans want to win, they MUST win Washington State. Patti Murray (D) has put up a strong fight against Dino Rossi (R). Rossi has run statewide twice before and he lost both times. His 2004 run for Governor against Christine Greigoire (D) went into a recount. Washington is a high turnout state and some polls even suggest Republicans have less enthusiasm than Democrats. Also, cell phone only households are common in the heavily Democratic Seattle and many pollsters do not poll cellphone users. In Oregon’s Gubernatorial race, it made a difference when John Kitzhaber (D) lead by 8 points with all phone users but 4 points with landlines only. Anyway, these Senate rankings here are my last ones before election day. Races such as California and West Virginia shift more towards the Democrats while Illinois shifts towards the Republicans (but it is still tossup in my book.) The Republicans are looking to pick up 7-9 seats because I do not see Rossi winning. Also, the names in parentheses are the names of the candidate from the incumbent party.  Bolded races mean the race may switch parties. Anyway, here are the rankings:

Safe D (6 seats)

Delaware (Chris Coons) Has O’Donnell ever had a shot here?

Hawaii (Daniel Inoyue) He has been in Senate since 1962 and he is staying.

Maryland (Barbara Mikulski) No problem in this heavily Democratic state.

New York A(Charles Schumer) I do not think anyone can beat him.

New York B (Kristen Gillibrand) A few polls showed a tight race in September but not anymore.

Vermont (Patrick Leahy) Another easy Democratic hold.

Likely D (1 seat)

Connecticut (Richard Blumenthal) Linda McMahon (R) is spending like Meg Whitman but Blumenthal is leading in the polls.

Lean D (3 seats)

California (Barbara Boxer) Polls showed a tightening race but Boxer’s strong campaigning keeps it Democratic.

Washington (Patti Murray) She seems to have her lead back but will it stay?

West Virginia (Joe Manchin) After proving how out of touch he is with West Virginia, John Raese (R) is slipping in the polls.

Tossup (3 seats)

Colorado (Michael Bennett) PPP showed Ken Buck (R) up one point, showing how this race is a DEAD HEAT.

Illinois (Alexi Giannoulis) Polls show Kirk leading by 4 but Chicago has strong GOTV.

Nevada (Harry Reid) Polls show Angle with a small lead here but early voting looks good for Reid.

Lean Republican (5 seats)

Alaska (Joe Miller) The extremist Joe Miller (R) is slipping but write in Lisa Murkwski Murkowski (R) looks like she will win instead.

Kentucky (Rand Paul) Jack Conway (D) is a strong candidate but the Aqua Buddha ad sent him down.

New Hampshire (Kelly Ayotte) New Hampshire has been trending towards the Democrats recently but now it is shifting towards the Republicans.

Pennsylvania (Joe Sestak) Democrats were hoping for a surprise pickup here but polls show Toomey with a 5 point lead. GOTV probably cannot narrow that gap.

Wisconsin (Russ Feingold) Wisconsin always seem to come home to its Democrats but Feingold was too independent for the base.

Likely Republican (8 seats)

Arizona (John McCain) Rodney Glassman (D) is another good candidate in a bad cycle.

Arkansas (Blanche Lincoln) The South keeps trending Republican and John Boozmen (R) should be Arkansas’s next Senator.

Florida (Marco Rubio) Saying he will caucus with the Democrats if elected has not saved Charlie Crist (I) against Marco Rubio.

Indiana (Brad Ellsworth) Ellsworth could have been a strong candidate and the NRA endorsement probably will not save him against Dan Coats (R)

Louisiana (David Vitter) Charlie Melancon (D) did well with the oil spill and Vitter saw D.C Madam but family values are not a big issue this year.

Missouri (Roy Blunt) Robin Carnahan (D) is a good candidate but Obama’s unpopularity here is bringing her down.

North Carolina (Richard Burr) No Senator has held this seat for more than one term since 1976. Elaine Marshall (D) cannot continue the tradition.

Ohio (Rob Portman) At least Lee Fisher (D) knew he would not win so he gave $300,000 to Ohio Democrats.

Safe Republican: (8 seats)

Alabama (Richard Shelby) Was this race ever on your radar? It was not on mine.

Georgia (Johnny Isakson) Michael Thurmond (D) is a reasonable candidate in the wrong year.

Idaho (Mike Crapo) Not much to say here.

Kansas (Jerry Moran) Democrats can win here but definitely NOT this year.

North Dakota (John Hooeven) Democrats who are popular with constituents can win easily in North Dakota. So can Republicans.

Oklahoma (Tom Coburn) People talk about conservatives overrunning the Senate this year. This one is already in.

South Carolina (Jim DeMint) The Democrats nominated the worst candidate possible against the teabagger king.

South Dakota (John Thune) No challenge at all.

Do you agree or disagree with the rankings? Do you have any you want to share? Feel free to comment.

By what margin will Bob Shamansky win?

View Results

Loading ... Loading ...

Analyzing Swing States: Colorado, Conclusions

This is the last part of a series of posts analyzing the swing state Colorado.

Conclusions

Colorado is much like the previous state analyzed in this series: Virginia. Both states were seen until recently as Republican strongholds and rightfully so; President George W. Bush handily won both states in 2004 and 2000.

Yet in 2004, both states showed signs of shifting Democratic. Virginia barely moved Democratic even as the South swung heavily against Senator John Kerry. As for Colorado – it actually shifted 3.7% more Democratic, against the national tide. Indeed, in 2004 Mr. Kerry performed better in Colorado than he did in Florida.

More below.

This shift cumulated in the 2008 presidential election, which showed both Colorado and Virginia as influential swing states. Colorado has thus turned from a red state into a purple state. In doing so, the Democratic Party has carved out the following coalition:

Analyzing Swing States: Colorado,Conclusions

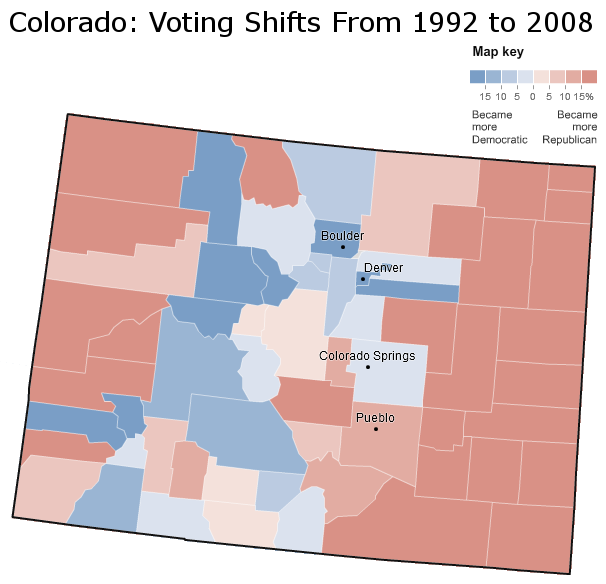
Democratic gains since 1992 follow the “C” pattern that was also present in the actual 2008 county results. This is a pattern that is present in other parts of the country, as previous posts have observed. Democrats have generally improved along the Front Range, and especially in the Denver metropolis. They have also gained in two Republican strongholds: Colorado Springs and neighboring Douglas County.

On the other hand, Republicans have gained in several historically Democratic-voting Hispanic counties near Pueblo. They have also improved in the thinly populated rural stretches of east and west Colorado.

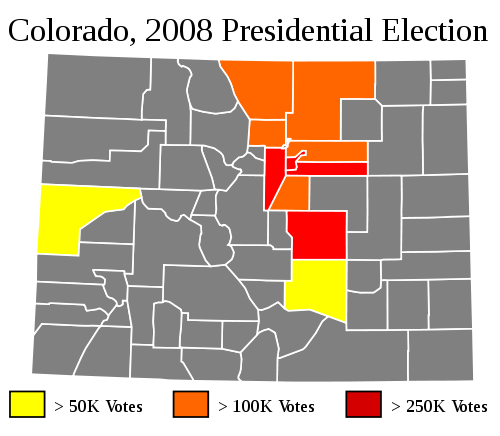
All in all, these changes have benefited Democrats more. This is because their gains have been in the more populated areas of Colorado:

Analyzing Swing States: Colorado,Conclusions

The heart of Colorado is therefore in the Denver metropolis, as the map indicates. Since 1992 Democrats have improved in all but one of the orange and red counties. In 2000 Mr. Bush won seven of the eleven highlighted counties. In 2008 Mr. Obama won seven of them. This is responsible for Colorado’s 17.3% leftward shift from 2000 to 2008.

This leftward shift has not turned Colorado into a blue state, but rather into a vitally important swing state. Say, for instance, that Mr. Obama had tied Senator John McCain in the popular vote. North Carolina and Indiana would have immediately flipped Republican. This would be followed by the traditional swing states Florida and then Ohio. Virginia would flip Republican next; Mr. Obama would lose by less than a percent. At this point Mr. McCain would have 262 electoral votes.

And there he would remain. In a tied election, Colorado would go by 1.7% to Mr. Obama, handing the senator 278 electoral votes and the presidency.

In the 2008 presidential election, therefore, Colorado was the most important state to win. It may remain thus in 2012.

–Inoljt, http://mypolitikal.com/