Arizona Redistricting: 5-4 Republican

Cross posted on my blog http://frogandturtle.blogspot…. which you should visit for more redistricting maps and election analysis.

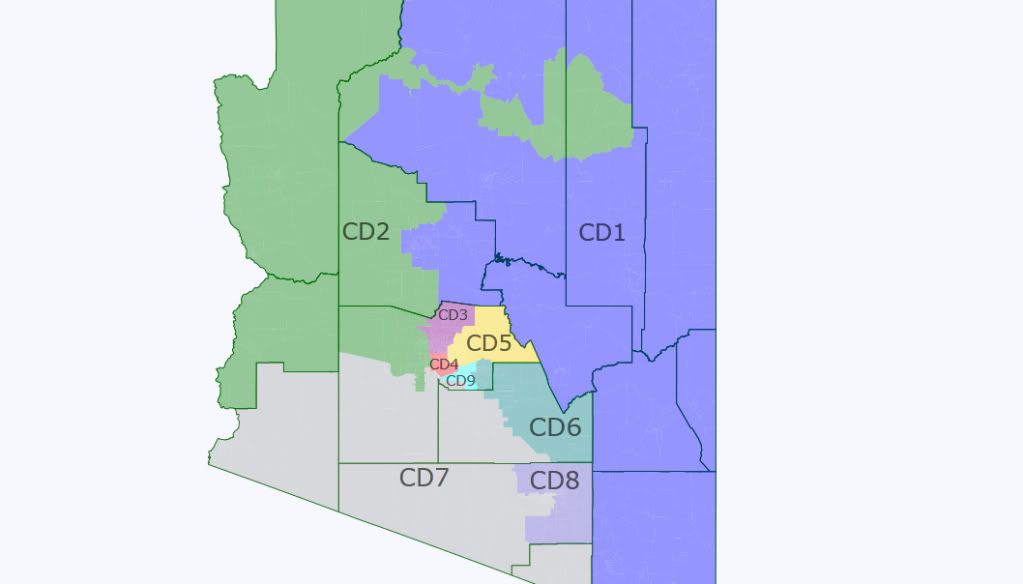
Some states such as California have districts that almost never switch parties. In 2006-2010 though, Arizona’s House seats kept switching parties with 6 party switches throughout those years. Before 2006, Arizona had a 6-2 Republican map and after the 2008 elections, it was 5-3 Democratic. After 2010 though, the Republican tide hit here and the delegation shifted to 5-3 Republican. Arizona’s 7th and 8th Congressional District in 2010 also were close to switching parties although Raul Griljava (D) and Gabrielle Giffords (D) held their respective seats. Why was Arizona filled with competitive districts? They had an independent commission that drew the maps. Although Republicans hold the trifecta by holding the State Legislature and the Governorship, they have no power over redistricting because the commission draws the lines. I drew this map predicting what the commission will draw. Although a few of the districts such as the 5th and the 1st are competitive, I assume that this map will be a 5-4 Republican map. This is fair for Arizona because 5-4 Republican is similar to the partisan makeup of Arizona which leans Republican in most elections. I also strengthened many of the incumbents in this map such as Raul Griljava (D) and Gabrielle Giffords (D). My map has 1 Safe Democratic, 2 Likely Democratic, 1 Lean Democratic, 2 Lean Republican, and 3 Safe Republican seats. Anyway, here are the maps:

Here is a link to Arizona’s current map: http://www.nationalatlas.gov/p…

Also, click the maps if you want the full image

Photobucket

North Arizona

Photobucket

South Arizona

Arizona’s 1st Congressional District Paul Gosar (R) Blue

Partisan Data: McCain (estimated) 55%

Demographics: 19.2% Native American, 17.1% Hispanic, 59.5% White

Demographics 18+: 16.7% Native American, 14.6% Hispanic, 64.7% White

Old Demographics: 22.4% Native American, 16.4% Hispanic, 58.4% White

Communities: Flagstaff, Prescott, Sierra Vista

Status: Lean Republican

The 1st district does not undergo major changes as it loses Florence and Coolridge in Pinal County. The 1st district picks up all of Cochise County from the 8th district. Cochise County voted 59% for McCain and has large numbers of military members. It also helps make the district more Republican. The 1st district also loses part of Republican Gila County.  Although these changes probably make Gosar’s district a point more Republican, he can still face a tough race. Ann Kirkpatrick (D), the former representative of the 1st district may run. She was one of the few Democrats in a district McCain won to vote against both the Stupak Amendment and the Affordable Care Act. She lost by 6 points which is not a nail biter but narrower than expected. A possibility though is that a Native American candidate may challenge her in the primary.  A possible candidate is openly gay Navajo State Senator Jack Jackson (D) who almost ran for the 1st congressional district in 2006. On the other hand, Kirkpatrick has support with the Navajo Community because she received endorsements in 2010 from many Navajo leaders including Dr. Peterson Zeh, the Navajo Nation President in 2010. This may encourage Navajos, the largest Native American tribe in the 1st district to support Kirkpatrick instead of supporting a Navajo politician for the seat.

Arizona’s 2nd Congressional District Trent Franks (R) Green

Partisan Data: McCain (estimated) 62%

Demographics: 17.6% Hispanic, 72.6% White

Demographics 18+: 14.1% Hispanic, 77.3% White

Old Demographics: 14.2% Hispanic, 78.4% White

Communities: Lake Havasu City, Surprise, Peoria

Status: Safe Republican

The 2nd district undergoes a few changes. It gains conservative La Paz County from the 7th district and keeps the string to the Hopi Reservation intact. The lines there may look convoluted but the Hopi do not want to be represented in the same district as the Navajo so the 2nd district represents them. The 2nd district also retains western Maricopa County which is one of the fastest growing areas in the state. Surprise had 39,000 people in 2000 but has 117,000 today. Most of these newcomers are Republicans and the 2nd becomes more Republican as it loses some Hispanic precincts in Glendale. Franks should have no problems winning reelection in this conservative district.
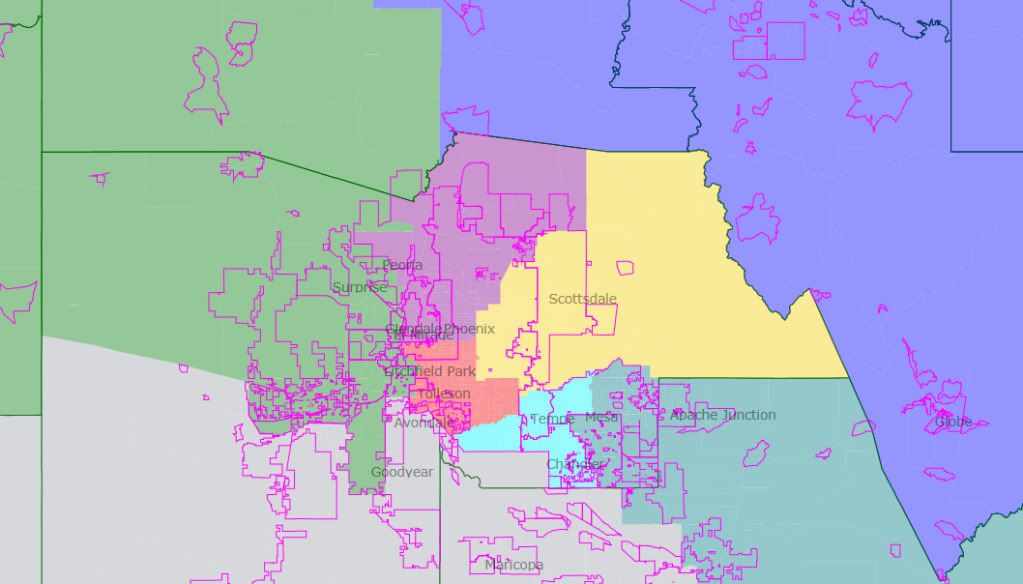
Photobucket

Phoenix Area

Arizona’s 3rd Congressional District Ben Quayle (R) Purple

Partisan Data: McCain (estimated) 55%

Demographics: 19.2% Hispanic, 70.4% White

Demographics 18+: 15.8% Hispanic, 74.6% White

Old Demographics: 14.1% Hispanic, 78.5% White

Communities: Phoenix, Glendale, Paradise

Status: Lean Republican

The 3rd district becomes a point more Democratic as it loses Republican areas in northern Maricopa County such as Cave Creek and Carefree. The 3rd district gains a few Hispanic precincts in Glendale but retains its center in northern Phoenix. Although Quayle won by 11 points in 2010, it was a Republican year and his district is growing more Democratic. Also, Quayle is very conservative and ran an ad saying “Obama was the worst president ever” so his far right views could hurt him against a moderate Democrat in a Democratic year. Jon Hulburd (D) who challenged Quayle last year could run again in 2012 when Obama will probably contest Arizona.

Arizona’s 4th Congressional District Ed Pastor (D) Red

Partisan Data: Obama (estimated) 65%

Demographics: 8.1% African American, 59.8% Hispanic, 26.0% White

Demographics 18+: 8.3% African American, 53.2% Hispanic, 32.2% White

Old Demographics: 7.5% African American, 58.0% Hispanic, 29.3% White

Communities: Phoenix

Status: Safe Democratic

The 4th district’s lines stay extremely similar to the current ones but there are a couple of changes. The 4th district picks up a few Hispanic precincts from the 3rd district near the intersection of Northern Ave. and Route 17. The 4th also gives a few heavily Hispanic precincts on the eastern Phoenix border to the 5th district in order to make the 5th district more winnable for a Democrat. Besides these minor changes, the 4th district’s lines stay extremely similar to their current form. The district remains heavily Hispanic and Democratic.

Arizona’s 5th Congressional District Dave Schweikert (R) Yellow

Partisan Data: Obama (estimated) 52%

Demographics: 5.1% African American, 4.5% Asian, 30.2% Hispanic, 55.2% White

Demographics 18+: 4.9% African American, 4.7% Asian, 25.2% Hispanic, 61.2% White

Old Demographics: 2.7% African American, 3.3% Asian, 13.3% Hispanic, 76.8% White

Communities : Scottsdale, Tempe, Mesa

Status: Lean Democratic

This district undergoes major changes and becomes more Democratic as it loses conservative northern Scottsdale. To compensate for losing northern Scottsdale, the 5th district gains Hispanic neighborhoods in Mesa, Chandler and Phoenix. The less Hispanic parts of Mesa and Chandler are in the conservative 6th district. These changes bring the district’s Hispanic population up to 29% and the 18+ population to 24%. With the addition of the Hispanic areas, the district becomes more Democratic so Democrats have a stronger shot at winning here. Harry Mitchell (D), the district’s representative in 2010 will be 72 at the time of the 2012 election but he may run. If he does not, possible candidates include his son Mark Mitchell (D), the Vice Mayor of Tempe. Arizona Senate Minority Leader Dave Schapira (D) also from Tempe could run here too.

Arizona’s 6th Congressional District Jeff Flake (R) Teal

Partisan Data: McCain (estimated) 64%

Demographics: 14.7% Hispanic, 75.1% White

Demographics 18+: 12.1% Hispanic, 78.8% White

Old Demographics: 17.2% Hispanic, 76.6% White

Communities: Apache Junction, Gilbert, Mesa

Status: Safe Republican

The area around Mesa and Apache Junction is one of the fastest growing areas in the nation so the 6th district had to shed population. It grew more Republican as well because it lost western Chandler and western Mesa, both swing areas with a growing Hispanic population. The 6th district also gained the Gila River Indian Reservation which is Democratic but should not alter the political leanings of the 6th district much. Although this district is too conservative to elect a Democrat, the Republicans could face a bruising primary if Jeff Flake (R) retires to run for Senate. The Republican bench is large here and potential candidates include State Senator Thayer Veschoor (R), State Senator Chuck Grey (R), Mesa Mayor Scott Smith (R) or Superintendent of Public Instruction John Huppenthal (R). If Huppenthal ran, he would probably win the primary due to his power as the former Senate Majority Leader but he may want to remain the Superintendent of Public Instruction. Anyway, unless a powerful candidate such as Huppenthal ran who can clear the field, the 6th district will face a large primary.

Photobucket

Tucson Area

Arizona’s 7th Congressional District Raul Griljava (D) Gray

Obama (estimated) 59%

Demographics: 58.0% Hispanic, 4.0% African American, 31.7% White

Demographics 18+: 52.6% Hispanic, 4.0% African American, 37.5% White

Old Demographics: 2.8% African American, 50.6% Hispanic, 38.6% White

Communities: Phoenix, Yuma, Tucson

Status: Likely Democratic

Griljava won by 6 points in a closer than expected race against teabagger Ruth McClung (R) despite his district’s high Hispanic population. I made some changes to his district in order to strengthen him. Also, his district’s current Hispanic 18+ population is below 50% so making Griljava’s district more Hispanic helps boost the Hispanic 18+ population above 50%. It is important to keep the Hispanic 18+ population above 50% because the VRA requires that some districts be not only minority majority but have an 18+ population above 50% too.

Arizona’s 8th Congressional District Gabrielle Giffords (D) slate blue

Partisan Data: Obama (estimated) 50%

Demographics: 29.2% Hispanic, 60.8% White

Demographics 18+: 24.7% Hispanic, 65.9% White

Old Demographics: 18.2% Hispanic, 73.9% White

Communities: Tucson, Oro Valley, Catalina

Status: Likely Democratic if Giffords runs, lean Democratic if not

First, I wish Giffords a full recovery from the Tucson shooting last January. If she recovers fully but decides not to return to politics, it is possible her husband Mark Kelly (D), one of the astronauts on the Endeavor will run in her place. Spouses of representatives often replace the representative when the representative is unable to run. Lois Capps (D) in Santa Barbara, Ca replaced Walter Capps (D), Mary Bono (R) replaced Sonny Bono (R) in Riverside County, Ca. Spouses are not always successful though as Stephanie Moore (D) learned when she unsuccessfully ran for her husband’s seat in Kansas. Anyway, if Giffords wants to return to politics, she can run for her House seat or Jon Kyls’ (R) open U.S Senate seat. Even if she does not run for the 8th district, the Democrat here will have a more favorable district. Giffords won last year by 4,000 votes and I removed all of Cochise County which she lost by 4,000 votes. I also removed all her district’s territory in Pinal County which she lost by 1,200 votes. If the election were held under her district’s current lines excluding Cochise and Pinal Counties, Giffords would win by 9,200 votes. Her district becomes even safer and more Tucson centered as it gains part of heavily Hispanic South Tucson from the 7th district and loses conservative areas near Picture Rocks. Although this is not a safely Democratic district, Tucson’s increased clout here will make it easier for Giffords or her replacement to win.

Arizona’s 9th Congressional District Vacant Cyan

Partisan Data: McCain (estimated) 58%

Demographics: 21.0% Hispanic, 69.1% White

Demographics 18+: 17.9% Hispanic, 72.9% White

Old Demographics: N/A

Communities: Scottsdale, Casa Grande, Marana

Status: Safe Republican

The lines on this map remove Republican areas from the 1st, 5th, 6th, 7th and 8th district and I combined those areas in the new 9th district. Those areas include northern Scottsdale in Maricopa County, all of Pinal County except for the Gila River reservation and Apache Junction, part of Gila County and Marana in Pima County. This district is too conservative for a Democrat to win but there could be a competitive Republican primary. Possible candidates could be State Senator Steve Smith (R) from Pinal County or State Senator Michelle Reagan (R) from Scottsdale.  

By what margin will Bob Shamansky win?

View Results

Loading ... Loading ...

Redistricting Arizona U.S. House Districts

AZ-01 (Gosar): 57% White, 21% Native American, 18% Hispanic, 1% Black, 1% Asian – leans Republican but is winnable for Democrats

Photobucket

AZ-02 (Franks): 65% White, 28% Hispanic, 2% Black, 2% Asian, 1% Native American (connects Prescott with Yuma) – Safe Republican

Photobucket

AZ-03 (Quayle): 75% White, 16% Hispanic, 4% Asian, 3% Black, 1% Native American – Safe Republican

Photobucket

AZ-04 (Pastor): 56% Hispanic, 31% White, 6% Black, 3% Asian, 2% Native American (Hispanic VRA district) – Safe Democratic

Photobucket

AZ-05 (Schweikert): 49% White, 35% Hispanic, 6% Black, 4% Asian, 3% Native American (Tempe; connects a small Indian reservation with liberal whites) – Lean to Likely Democratic I think

Photobucket

AZ-06 (Flake): 81% White, 12% Hispanic, 3% Asian, 2% Black, 1% Native American – Safe Republican

Photobucket

AZ-07 (Grijalva): 53% Hispanic, 33% White, 5% Black, 5% Native American, 2% Asian (VRA District) – probably safe Democratic

Photobucket

AZ-08 (Giffords): 66% White, 25% Hispanic, 3% Black, 3% Asian, 1% Native American  – Safe for Giffords if she runs again; if she doesn’t the Republicans have a good chance of picking this seat up

Photobucket

AZ-09 (New Seat): 69% White, 20% Hispanic, 3.5% Black 2.5% Asian, 1% Native American – Safe Republican

Photobucket

Phoenix close-up (AZ-01 – Gray, AZ-02 – Light Pink, AZ-03 – Purple, AZ-04 – Light Gray, AZ-05 – Yellow, AZ-06 – Green, AZ-07 – Blue, AZ-08 – Neon Green, AZ-09 – Rose)

Photobucket

Tucson close-up

Photobucket

Redistricting Arizona

Now that I’ve been working on redistricting Nevada for some time, I figured it was time to branch out and see how Congressional maps might change next door. So I’m heading to Arizona today to explore how their map might change.

Unlike Nevada, Arizona’s redistricting isn’t done by the state legislature. Rather, an independent commission draws the lines. However that commission isn’t free of controversy, and speculation is already heating over where the new district will go.

Here’s my attempt at guessing what happens.

Share photos on twitter with Twitpic

AZ-01 (Royal Blue)

Population: 710,180

63.6% White (68.7% VAP), 20.5% Native American (17.8% VAP)

This district stretches across most of Northern Arizona, including The Grand Canyon, Flagstaff, Sedona, and Navajo Territory. AZ-01 is currently represented by “tea party” Republican Paul Gosar, but from 2009 to 2010 Democrat Ann Kirkpatrick represented this district.

In redoing AZ-01, I was presented with a bit of challenge. How do I preserve the integrity of Northern Arizona while finding enough voters to meet the population requirement? And keep it at least relatively competitive?

So I added most of Mohave County (just Lake Havasu City was left out) to AZ-01, and shifted Pinal, Graham, and Greenlee Counties into the new AZ-09 district. (More on that later.) And thankfully, I was able to keep the Native American population above 20% here.

Sorry, but I just didn’t have the time to pore over the Arizona Secretary of State’s archaic precinct archives. Over the weekend, I just eyeballed county level election results and voter registration stats to estimate PVI and voting trends. And here, I’d peg the new AZ-01 at close to R+10, with Obama getting about 42-44% of the vote here in 2008. But remember, Arizona PVI figures are deceiving, as John McCain overperformed in his home state (compared to the other Southwestern states) in 2008. And since Ann Kirkpatrick won with similar partisan hurdles in 2008, it probably isn’t impossible for a Democrat to win this district again.

Early Race Rating: Likely Republican

Share photos on twitter with Twitpic

AZ-02 (Army Green)

Population: 710,023

68.4% White (73.8% VAP)

AZ-02 now starts in Lake Havasu City in Southern Mohave County, then takes in heavily Republican La Paz County, then jumps into Maricopa County to take in the Western Phoenix Suburbs mostly covered by Legislative Districts (LDs) 4, 9, and 12. LD 4 is heavily Republican, and the GOP has just over an 11% registration edge in LD 9. In LD 12, however, Republicans only have a 5% registration edge, and Independents outnumber both parties.

Still, Trent Franks probably has nothing to worry about here… At least for now, as older white Republicans continue to flock to the retirement communities here.

Early Race Rating: Safe Republican

AZ-03 (Magenta)

Population: 709,789

78.6% White (81.6% VAP)

At first glance, this should be a district Ben Quayle will be quite happy with. The new AZ-03 overlaps with most of LDs 6, 7, 8, 10, and some of LD 11, with all but LD 10 sporting huge GOP registration advantages.

However, there’s a little kink here. While North Scottsdale and Fountain Hills are heavily Republican, they’re currently represented by Republican David Schweikert in AZ-05. With Schweikert moved to AZ-03 under this map, will Arizona Republicans prefer him representing this district over the more controversial Quayle, who only scored 52% as other Arizona Republicans romped to easy victories last year? Will David Schweikert, a more seasoned Phoenix area pol viewed as more mainstream, be seen as a safer bet in a seat that the GOP really shouldn’t lose? Or will North Phoenix be happy enough with Ben Quayle to keep him in place?

Early Race Rating: Safe Republican (but safe for whom?)

Share photos on twitter with Twitpic

AZ-04 (Deep Red)

Population: 710,184

64.3% Latino (57.8% VAP), 21.7% White (27.7% VAP)

Not much changes here, as the mostly Latino urban heart of Phoenix is kept intact, along with the more Latino heavy neighborhoods of Glendale. This seat is most likely Ed Pastor‘s for as long as he wants it.

Early Race Rating: Safe Democratic

AZ-05 (Bright Yellow)

Population: 710,453

63.1% White (68.1% VAP)

This district overlaps with most of LDs 11, 17, and 20, along with parts of LDs 8, 15, 16, and 18. It combines rich, Republican heavy Paradise Valley with brainy, Democratic leaning Tempe, along with some diverse Central Phoenix neighborhoods and increasingly Latino heavy West Mesa precincts.

Basically, this is your quintessential swing district. Most likely this district will have about even PVI come 2013. Even “Native Son” John McCain couldn’t muster any more than 51% in its current incarnation, which includes more GOP dominant North Scottsdale and Fountain Hills.

So will David Schweikert decide to move here to continue representing AZ-05? Or as I suggested above, will he move to AZ-03 and opt for a safer seat? I’m sure the Arizona GOP doesn’t want to cede any seats in redistricting, but The East Valley has been trending more Democratic of late, and Ben Quayle did come fairly close to losing in a banner Republican year. And not to mention, The Independent Redistricting Commission will be under intense pressure to draw more competitive districts.

So the Arizona GOP may not have any other choice but to accept they’ll have to fight hard to keep AZ-05.

Early Race Rating: Tossup

AZ-06 (Teal)

Population: 709,964

67.3% White (71.7% VAP)

Even though Jeff Flake is now running for US Senate, the Arizona GOP need not worry about this district falling. AZ-06 is now entirely within Maricopa County, but it mostly overlaps strongly Republican LDs 18, 19, 21, and 22.

While Chandler and Mesa are slowly diversifying as more Latino and Asian-American families seek affordable housing there, the fast growing, affluent, and heavily Mormon suburb of Gilbert will probably remain strongly Republican enough to keep AZ-06 in GOP hands in the next decade. But over time, it will be interesting to see if this area becomes more competitive as the more close-in East Valley suburbs (like Tempe in AZ-05) grow more Democratic.

Early Race Rating: Safe Republican

Share photos on twitter with Twitpic

AZ-07 (Silver)

Population: 710,696

59.3% Latino (53.5% VAP), 30.7% White (36.9% VAP)

Raul Grijalva had the political scare of his life last fall when he only mustered 50% against previously unknown teabagger darling Ruth McClung. Previously, his reelection campaigns were much easier… But then again, that was before Arizona started making political headlines in taking national immigration policy into its own hands. And perhaps as AZ-07 becomes more Latino and less rural under this map, Grijalva won’t be so vulnerable again in the future.

In this map, AZ-07 loses GOP heavy La Paz County, as well as a Republican leaning chunk of Pinal County. Instead, the district picks up more Latino and Democratic friendly precincts in urban Maricopa County, then turns south to Pima County, and now takes in all of Latino heavy and strongly Democratic Santa Cruz County. (Previously, some of Santa Cruz was in AZ-08.)

Depending on how long Arizona’s immigration controversy continues and how angry Arizonans remain at Raul Grijalva for his early support of an Arizona boycott over SB 1070, there may still be a possibility of future competitive races here. But as I said above, I suspect the possibility won’t be as high as the district becomes less white and less rural.

Early Race Rating: Likely Democratic

AZ-08 (Sky Blue)

Population: 710,510

65.6% White (70.1% VAP)

It was the bullet felt around the world. When Gabrielle Giffords was shot at a “Congress on Your Corner” event in January, discussion immediately began on the ramifications of the increasingly violent nature of American politics today.

Fortunately, Gabby Giffords survived and is now recovering from the near fatal attack that did happen to leave 20 other victims wounded and another 6 people dead. And today, there is even speculation on Giffords possibly running for higher office, such as US Senate, even as other Democratic Members of Congress recently held a fundraiser for Giffords’ AZ-08 2012 campaign.

Honestly, I have my doubts as to whether Giffords can recover in time to run for Senate. But should she be able to run for House again, she will probably have an easier time in this new AZ-08. For one, it’s now entirely within Pima County. (No more rural stretches of Pinal or Cochise Counties.) Also, it includes more urban and Democratic friendly neighborhoods in Tucson.

However AZ-08 probably still has an even or slightly Democratic PVI at best due to the number of more affluent and Republican Tucson suburbs and exurbs still in this district. Most of LDs 25, 26, and 28 are in this district, along with some of LDs 29 and 30. LDs 26 and 30 lean Republican, but LDs 25, 28, and 29 lean Democratic. So it won’t be a totally easy ride for Giffords, and it will probably be a little more difficult to hold if there’s another open seat election in the immediate future. But if the Arizona GOP shoots itself in the foot with another teabagger nominee, they can probably only do so much here.

Early Race Rating: Likely Democratic if Giffords runs again, Leans Democratic if Giffords retires or runs for another office

AZ-09

Population: 710,218

61.3% White (65.5% VAP)

So we end with the new district. With so much of Arizona’s phenomenal growth in the last decade occurring in increasingly exurban Pinal County, I decided to base AZ-09 here, add some exurban Maricopa County areas (like Queen Creek), and expand it to a small part of Gila County, and to all of Graham, Greenlee, and Cochise Counties. Now just remember, appearances can be deceiving.

This area may appear to be quite Republican, but voter registration remains close. (Republicans add up to a slight edge, but there’s a large number of Independent voters here.) John McCain carried this district by (likely mid-) double digits in 2008, but Janet Napolitano won by an even greater margin in 2006.

So I think the right Democrat can at least make this district competitive, especially as the Pinal and Maricopa portions mature and become more suburban and diverse. But until that happens, Republicans probably have the edge here.

Early Race Rating: Likely Republican

In all, I created 4 absolutely safe districts, with the other 4 at least holding the potential to become competitive races next year. Did I get it wrong? If you’re more of an Arizona expert than I, please feel free to critique me and let me know if there are items to be fixed and improved.

Arizona 4 different ways!

Despite the colossal housing bust, Arizona ended the decade with a lot more people than it started with and thus earned a 9th congressional district. Here are the stats for the 8 current congressional districts. For the ethnic shares, W is Anglo, B is black, H is Hispanic, A is Asian, and N is Native American.

AZ1 (Gosar, R): 774.3k, 57.1W–1.5B–19.5H–0.9A–19.1N

AZ2 (Franks, R): 972.8k, 69.3W–3.5B–20.8H–2.5A–1.7N

AZ3 (Quayle, R): 707.9k, 70.7W–3.1B–19.3H–3.4A–1.3N

AZ4 (Pastor, D): 698.3k, 21.5W–8.6B–63.9H–2.2A–2.1N

AZ5 (Schweikert, R): 656.8k, 70.3W–3.8B–16.5H–4.4A–2.5N

AZ6 (Flake, R): 971.7k, 69.3W–3.1B–20.7H–3.6A–1.0N

AZ7 (Grijalva, D): 855.8k, 32.6W–3.7B–56.0H–1.8A–4.3N

AZ8 (Giffords, D): 754.3k, 68.2W–3.3B–22.7H–2.7A–0.8N  

The target population is about 710k, so AZ2 and AZ6 will have to lose more than 25% of their people. AZ7 will also have to shed a lot, and the AZ1 and AZ8 will have to shed a little. AZ5 needs to add people. The big question: where does the new 9th go? Most of the growth was on the edges of the Phoenix area so it seems natural to put the new district somewhere on the fringe, but it isn’t immediately obvious where it should go. The southeast valley and the southwest valley both saw explosive growth, but these two areas are separated by a lot of still-empty desert. Here I show four different possibilities, but these are just four among many. M Riles just drew a plausible map that looks very different from any of these. Anyway…

Map 1: AZ9 takes new exurbs on east and west sides

State map:

az9 east-west

Phoenix closeup:

az9 west-east

Tucson closeup (same in all 4 maps):

tucson

Here the new district is formed almost entirely from the areas of AZ2, AZ6, and AZ7 that were mostly empty 10 years ago and as such, almost every building in the state that stood 10 years ago will remain in its old district. This helps continuity, as the current reps will not have to get accustomed to new areas. A drawback: AZ9 is nice and compact but as mentioned above it has two densely populated areas separated by a lot of empty space. New ethnic numbers and notes for the districts:

AZ1 (blue): 61.0W–1.0B–15.6H–0.9A–19.9N Drops much of Pinal but retains the mining-dominated eastern parts. Picks up Kingman in Mohave county. Probably a bit more red now but still competitive.

AZ2 (green): 72.4W–2.8B–17.7H–2.4A–2.8N Picks up La Paz in all 4 maps. It’s dominated by retirees, ultra-red, and really doesn’t fit in AZ7. AZ2 is still deep red.

AZ3 (purple): 70.1W–3.2B–19.8H–3.6A–1.3N Loses part of east Phoenix to AZ5, picks up part of east Glendale from AZ2. Probably little impact.  

AZ4 (red): 21.7W–8.6B–63.7H–2.4A–2.1N Negligible changes. Safe D.

AZ5 (yellow): 70.6W–3.7B–16.5H–4.5A–2.4N Probably still lean R.

AZ6 (teal): 68.8W–2.8B–22.0H–3.2A–1.1N Loses Queen Creek and south end of Gilbert and Chandler to AZ9 but retains Apache Junction which is really an extension of east Mesa. Still safe R.

AZ7 (gray): 34.0W–2.6B–56.9H–1.8A–3.3N Losing both La Paz and most of its Maricopa piece is about a wash. Drops much of Pinal where Grijalva did poorly in 2010, but picks up some reddish parts of the northwest Tucson area. That may also be about a wash overall. Slightly more Hispanic now, but also slightly more white. Still likely D.  

AZ8 (blue-gray): 68.3W–3.4B–22.5H–2.8A–0.8N This district is the same in all 4 maps. I don’t expect Cochise to be broken up or thrown into AZ1 when it has historically been much more tied to Tucson. It loses its Santa Cruz piece and Pima sections west of I-10 and north of AZ-86 to AZ7. Its ethnic mix doesn’t change. Of the 15 lost Pima precincts it appears that Giffords won 4 and lost 11, so it may be slightly more blue now. Still tilt R overall.

AZ9 (toothpaste blue): 53.3W–5.6B–32.4H–3.9A–2.6N Its west valley section mostly went for Grijalva and should lean D, but its east valley piece should lean R. Overall it should be competitive, maybe tilt R. On the one hand it’s much less white than the swingy AZ1, AZ5, and AZ8, but on the other it doesn’t have a large public university like they do.  

Map 2: AZ9 in the east valley

Here the new district takes most of Pinal, all of Chandler, most of Gilbert, and Queen Creek. As a result AZ6 is forced to take Ahwatukee and west Mesa from AZ5, forcing AZ5 deep into Phoenix and AZ4 out into the west valley boom areas. Unlike map 1, I think this map creates 3 clearly blue districts so it might be less likely to be adopted. It’s hard to put AZ9 entirely in the east valley without endangering AZ5 and/or AZ3.

State map not shown, as everything outside Maricopa and Pinal is the same as in map 1.

Phoenix closeup:

Photobucket

AZ1: 61.0W–1.0B–15.6H–0.9A–19.9N No change from map 1.

AZ2: 72.4W–2.8B–17.7H–2.4A–2.8N No change from map 1.

AZ3: 70.3W–3.2B–19.6H–3.5A–1.3N Negligible change from map 1.

AZ4: 26.7W–8.9B–58.5H–2.7A–2.4N Not quite as Hispanic now but still very blue.

AZ5: 56.0W–4.4B–31.9H–3.3A–2.5N The white population here is fairly liberal with north Tempe and the older parts of Phoenix. The district is basically Scottsdale and a bunch of blue areas, and Schweikert would probably lose to Kyrsten Sinema in 2012.

AZ6: 67.5W–3.4B–21.8H–3.6A–1.6N Still safe R.

AZ7: 33.7W–2.5B–56.4H–1.6A–4.4N Keeps the Gila River rez in this version.

AZ8: 68.3W–3.4B–22.5H–2.8A–0.8N No change from map 1.

AZ9: 64.4W–4.2B–23.1H–4.6A–1.5N Probably at least likely R, but look what happened to AZ5.

Not shown here, but it would be possible to keep both AZ5 and AZ3 red by having AZ5 take the eastern part of AZ3, which would then take the eastern part of AZ2 (and probably Trent Franks’ house). In this case the chain reaction would push AZ2 into Yavapai, forcing AZ1 to take Cochise by elimination and pushing AZ8 into the bluer parts of Pima. This would likely make AZ1 a bit more competitive, and AZ8 very unfavorable for Republicans. I don’t like this because I think Cochise and its military base belong with Tucson, not with Flagstaff. In practice this would give the Reeps the best chance at a 6-3 map, because the district that’s getting weakened the most (AZ8) is already held by an entrenched Dem.

Map 3: AZ9 in the west valley

The west valley boom areas by themselves are not nearly big enough to sustain a district, so the new AZ9 pushes into AZ2 and deep into AZ4. This in turn pushes AZ3 well to the east and AZ5 deep into Pinal county. AZ2 keeps Kingman and is pushed into Yavapai, and AZ1 retains much more of Pinal here. Under this map only AZ7 would be above 50% Hispanic voting age population, but AZ4 would be at 43.4% and AZ9 at 44.7%. I doubt the Dems would object to this map: they should be favored in AZ4, AZ7, and AZ9 and the swing districts AZ1, AZ5, and (to a much lesser extent) AZ8 are all more Dem-friendly than their current versions. I didn’t try to rig this map to favor Dems, but it almost has to work out that way when you plop the new district entirely in the west valley and try to keep clean lines with communities of interest.

State map:

az9 west

Phoenix closeup:

az9 west

AZ1: 57.3W–1.3B–18.5H–0.9A–20.2N Loses a good chunk of Yavapai which is the real red base in AZ1. Gosar would have trouble here.

AZ2: 76.5W–2.0B–14.5H–2.3A–2.9N R+16 now?

AZ3: 78.6W–2.1B–12.6H–3.5A–1.4N Schweikert would wax Quayle in the primary here, and hold this as long as he wants.

AZ4: 35.4W–7.4B–50.4H–2.5A–2.5N Not nearly as Hispanic now but nearly as blue, as it picks up a lot of white liberals.

AZ5: 59.7W–4.9B–24.0H–5.7A–3.2N Scottsdale’s gone, replaced with swingier parts of Chandler, west Mesa, and Pinal. You want this back, Harry?

AZ6: 73.3W–2.7B–18.0H–3.0A–0.9N This is one r-e-d district.

AZ7: 34.0W–2.6B–56.9H–1.8A–3.3N Very similar to map 1.

AZ8: 68.3W–3.4B–22.5H–2.8A–0.8N No change from map 1.

AZ9: 36.9W–7.2B–49.9H–3.0A–1.0N Probably lean D to likely D. Not sure who the new rep would be, as the Dem state legislators from this area appear to have districts more liberal than the new AZ9 as a whole.

Map 4: AZ9 in the middle

The commission might just do what they did last time, and counterintuitively put the new district in the middle instead of on the fringe. The new districts last time were effectively AZ4 and AZ5. Here AZ9 ends up looking an awful lot like AZ5 from map 2, but with parts of north Phoenix and Glendale instead of Scottsdale.

State map:

az9 center

Phoenix closeup:

az9 center

AZ1: 61.0W–1.0B–15.6H–0.9A–19.9N No change from map 1.

AZ2: 71.1W–3.1B–18.9H–2.3A–2.8N Ho hum.

AZ3: 80.7W–1.9B–10.5H–3.7A–1.3N Pushed into Scottsdale again for Schweikert.

AZ4: 20.9W–8.9B–64.5H–2.6A–1.5N Pushed west again.

AZ5: 59.6W–4.8B–24.7H–5.4A–3.1N The reddest (Scottsdale) and bluest (north Tempe) areas are both gone, and what’s left is Ahwatukee, Chandler, south Tempe, little bits of Mesa and Gilbert, and most of Pinal. Probably still lean R, but swingy. And once again, no incumbent.

AZ6: 71.3W–2.7B–20.1H–2.8A–1.1N Safe R again.

AZ7: 34.8W–2.6B–56.4H–1.7A–3.2N Keeps more of Maricopa and less of Pinal than the other maps, which suits Grijalva just fine.

AZ8: 68.3W–3.4B–22.5H–2.8A–0.8N Still no change from map 1.

AZ9: 52.8W–5.4B–33.7H–3.4A–2.5N Don’t let the numbers fool you, this thing is blue. The white population here is mostly moderate to liberal. I suspect Pastor would run in the new AZ4 even if he lives here, so Sinema would likely hold this without too much trouble.

If the commission had to pick from these four maps, I suspect they might pick the first with its somewhat disjointed 9th district because it does the least to upset the current balance. The other three were all at least marginally favorable to Dems. I think that making the new district anything but an east-west mix will lead to this if the commission lets the other districts sort out into their most “natural” configurations, but in practice they might find it politically easier to sacrifice compactness and communities of interest a bit in order to keep the current balance of power.

By what margin will Bob Shamansky win?

View Results

Loading ... Loading ...

Arizona: 4 Majority-Minority districts

In a previous diary, I showed what an Arizona redistricting plan with three majority-minority districts might look like. With the new census data for Arizona, it is actually possible to draw four majority-minority districts in the state.

1st district (blue):

46.1% W, 30.7% H, 19.0% N (18+ population only)

Because of low turnout rates among Native Americans and Hispanics, the electorate here is probably majority-white. But since Flagstaff has a lot of white Democrats, the district is probably pretty swingy. I would guess the PVI is something like R+1 or so, but I’m not sure.

2nd district (green):

82.9% W, 13.7% H

Trent Franks no longer lives in this district, so if this map were actually drawn I would expect him to run for senate. More than 60% of the district’s population now lives outside of Maricopa county, meaning that the state would have two districts not based in Phoenix or Tuscon.

3rd district (purple):

76.7% W, 14.5% H

Ben Quayle and Trent Franks both may or may not live here, but this is probably where both of them would run (assuming Franks doesn’t run for senate). I don’t think Quayle could make it through the primary here, but regardless it’s a safely red district.

4th district (red):

32.5% W, 8.3% B, 52.3% H

The only majority Hispanic district in the state under this map, and also the most Democratic.

5th district (gold):

69.5% W, 16.4% H, 6.6% A

This district mixes liberal Tempe with conservative Gilbert and Chandler. It probably leans republican, but if Democrats wanted to take a majority of the state’s districts this would be their primary target.

6th district (teal):

83.2% W, 10.2% H

David Schweikert would probably be this district’s representative. Ben Quayle may live here but I doubt he beats Schweikert in a primary. Schweikert would be much safer here than in his old district.

7th district (gray):

49.2% W, 40.0% H

A majority of the district’s electorate is probably white, but Tuscon has enough liberal whites that this district would be very Democratic.

8th district (slate blue):

77.2% W, 15.2% H

The demographics of the district are similar to what they were, but the whites in Pinal/Maricopa counties are much more conservative than the whites in Pima county, so it probably gets more Republican.

9th district (light blue):

45.2% W, 6.2% B, 40.9% H

Despite being majority-minority, this district probably leans Republican. It would undoubtedly be very competitive, however.

—-

Interestingly, there are only two really Democratic districts here, just like in the current map. Having four majority-minority districts isn’t exactly a Democratic gerrymander. This plan would certainly be better for Democrats than the current districts, but if I were to approach this from a Democratic standpoint the map would probably be pretty different.  

AZ Congressional Redistricting

The 2010 census data recently came out for Arizona. I haven’t seen any maps since then, so I wanted to try to guess what the commission will do to get the ball rolling.  I don’t have much local knowledge of Arizona, so if I have butchered something, please let me know!

Photobucket

Photobucket

1st District- Paul Gosar (R)

New District VAPs

White:      64.1%

Black:      01.4%

Hispanic:   15.2%

Asian:      01.2%

Nat. Am.:   16.8%

Old District VAPs

White:       62.3%

Black:       01.6%

Hispanic:    16.9%

Asian:       01.2%

Nat. Am.:    16.6%

This district gets a bit whiter as it drops its portion of Pinal County in exchange for conservative Cochise County.  I think this change is justifiable as it allows the 8th to become a more Tucson-centric district.  The PVI probably shifts a point or two to the right, making the district R+7.  Even though Democrats held this seat until this year, I think it would be tough to recover.

2nd District- Trent Franks (R)

New District VAPs

White:      70.0%

Black:      03.5%

Hispanic:   20.1%

Asian:      02.2%

Nat. Am.:   02.8%

Old District VAPs

White:      74.1%

Black:      03.2%

Hispanic:   16.8%

Asian:      02.7%

Nat. Am.:   01.8%

This district had to shed about 150,000 people.  Because the district has to take in the Hopi reservation, all of the loss came in metro Phoenix.  The district also picks up La Paz County from the 7th.  I’m not sure that Trent Frank’s portion of Glendale is in the district, but it contains most of his old territory.  Though the district gets less white, its PVI is probably around R+9.  

3rd District- Ben Quayle (R)

New District VAPs

White:      76.8%

Black:      03.0%

Hispanic:   14.2%

Asian:      03.6%

Nat. Am.:   01.0%

Old District VAPs

White:      74.9%

Black:      03.0%

Hispanic: 15.9%

Asian:      03.6%

Nat. Am.: 01.2%

This district has shifted a bit east and includes Peoria and portions of Phoenix and Glendale.  The PVI is probably unchanged at R+9.  Even with Ben Quayle, this district would be hard to win.

4th District- Ed Pastor (D)

New District VAPs

White:      25.0%

Black:      09.2%

Hispanic:   60.0%

Asian:      02.9%

Nat. Am.:   01.7%

Old District VAPs

White:     27.3%

Black:     08.9%

Hispanic:  57.6%

Asian:     02.6%

Nat. Am.:  2.2%

The district takes in central Phoenix and southern Glendale.  It is not much changed and should be a safe Democratic district.

5th District- David Schweikert (R)

New District VAPs

White:      75.7%

Black:      02.8%

Hispanic:   15.4%

Asian:      03.0%

Nat. Am.:   01.8%

Old District VAPs

White:      73.8%

Black:      03.7%

Hispanic:   14.0%

Asian:      04.7%

Nat. Am.:   02.2%

The district loses Tempe and a portion of Phoenix to the south, becoming a Scottsdale-centric district.  I’d guess it also becomes a bit more Republican with a PVI of R+7.  This district would be hard for a Democrat to pick up.

6th District- Open

New District VAPs

White:      76.9%

Black:      02.7%

Hispanic:   14.7%

Asian:      03.0%

Nat. Am.:   01.4%

Old District VAPs

White:      73.7%

Black:      03.0%

Hispanic:   17.2%

Asian:      03.9%

Nat. Am.:   00.9%

The district loses a portion of western Mesa and all of Chandler and picks up more of eastern Pinal County.  This monstrously Republican district probably becomes even more so.  It has no incumbent due to Jeff Flake’s Senate run.

7th District- Raul Grijalva (D)

New District VAPs

White:      38.3%

Black:      03.2%

Hispanic:   51.2%

Asian:      01.7%

Nat. Am.:   04.6%

Old District VAPs

White:      38.7%

Black:      03.6%

Hispanic:   50.1%

Asian:      02.2%

Nat. Am.:   04.1%

This district loses La Paz County and a bit of Tucson while adding western Pinal County.  On balance, it becomes slightly more Hispanic.  The PVI is probably similar to the current D+6.  Since he won in 2010 after urging a boycott of the state, I have to assume he’ll be safe in this district.

8th District- Gabriele Giffords (D)

New District VAPs

White:      71.6%

Black:      03.1%

Hispanic:   19.1%

Asian:      03.3%

Nat. Am.:   00.9%

Old District VAPs

White:      72.7%

Black:      03.2%

Hispanic:   18.9%

Asian:      02.9%

Nat. Am.:   00.8%

This district drops conservative Cochise County and picks up more of the city of Tucson.  It is now contained entirely in Pima County.  I’d guess that the PVI shifts from R+4 to about even.  If Giffords runs again, she’ll probably win, though I’d consider this a toss-up district.

9th District- New District

New District VAPs

White:      64.8%

Black:      04.4%

Hispanic:   21.5%

Asian:      05.6%

Nat. Am.:   02.0%

This new district contains Chandler, Tempe, western Mesa, and the southern portion of Phoenix.  Because no incumbent lives in this district and because its PVI is probably about even, I’d expect a competitive election in 2012.

Overall, the map has 5 Republican districts, 2 Democratic districts, and 2 pure toss-up districts.  In my view, this will better than the current map, which really had two Democratic districts and six Republican ones.

Another Attempt at Arizona Redistricting

I decided to attempt redistricting Arizona, with its requirements for districts based around communities of interest. Arizona will pick up a 9th Congressional seat in 2012, though it’s tough to say which is the ‘new’ seat in my map as I moved a lot of things around in the Phoenix metro area. Changes elsewhere were less radical.

Caveats: While the district populations are all roughly equal in DRA, they have the potential to be out of whack in reality, particularly in Pinal County, I’m told. Also, I have little first hand knowledge of Arizona and am going mostly off of what I’ve read in other diaries, so cue Nico picking this apart in 3…2…1

So, here goes:

Statewide

Phoenix Metro

Tucson Metro

Arizona’s 1st Congressional District

Demos: 59% White, 1% Black, 20% Native American, 18% Hispanic, 1% Asian, 1% Otther

Description: Similar to the current 1st, though it sheds most of the non-rural Pinal stuff and picks up rural parts of Cochise and the rural portions of Maricopa instead. The district, as drawn is designed to keep as many rural interests in the state together as possible. The swaps have made this a more Republican district than the current 1st, but I’m guessing that it’s definitely winnable for the right kind of Democrat.

Arizona’s 2nd Congressional District

Demos: 74% White, 3% Black, 2% Native American, 2% Asian, 17% Hispanic, 1% Other

The 2nd stays similar to its current configuration. It does pick up all of La Paz County from the current 8th, but the western Phoenix suburbs, including most of Glendale, dominate here. So, what you have are two communities of interest: the smaller cities on the Western half of the state and the bulk of the West Valley of Phoenix. Should send a GOPer to Congress.

Arizona’s 3rd Congressional District

Demos: 79% White, 2% Black, 1% Native American, 3% Asian, 13% Hispanic, 1% Other

The 3rd remains a North Phoenix dominated district. However, it sheds Central Phoenix to the new 6th and picks up North Scottsdale and Paradise Valley from the old 5th. What I’m aiming for here is to combine the wealthier suburbs into a single district. I’m guessing that even Ben Quayle is probably safe here, and any other GOPer would have a job for life.

Arizona’s 4th Congressional District

Demos: 72% White, 3% Black, 1% Native American, 2% Asian, 20% Hispanic, 1% Other

The new 4th contains the whiter, farther out 2nd ring suburbs of Phoenix (East Mesa and Gilbert) along with the bulk of Pinal County. I’m not going to lie-this configuration is largely because aside from the Indian reservations and the rural parts, I wasn’t quite sure how to carve up Pinal, so I figured that keeping it mostly together (minus the Indian Reservations in the 8th and the rural east in the 1st) as a community of interest wasn’t the worst idea in the world. I’m guessing this is a GOP slam dunk.

Arizona’s 5th Congressional District

Demos: 22% White, 9% Black, 2% Native American, 2% Asian, 65% Hispanic, 1% Other

This is basically the current 4th CD, except that it loses the whiter portions of Central Phoenix to the new 6th and gains a little more population in the West Valley. Best Dem district in the state from a PVI perspective.

Arizona’s 6th Congressional District

Demos: 50% White, 5% Black, 3% Native American, 4% Asian, 37% Hispanic, 2% Other

Tempe plus Central Phoenix in a district that, to me anyways, makes a huge amount of sense as it brings together two ASU campuses plus the seat of government. I think of this as the Texas 25th of Arizona, a white, liberalish seat; say hello to some sort of Democrat here.

Arizona’s 7th Congressional District

Demos: 65% White, 3% Black, 4% Native American, 2% Asian, 24% Hispanic, 2% Other

The aim here was to bring together a bunch of first and second tier suburbs located to the east of downtown Phoenix together in a district. The district is comprised of West Mesa, Ahwatukee, Chandler, and Southern Scottsdale. I know that Chandler is swingy, and West Mesa is D friendly, but know nothing about Ahwatukee and the portion of Scottsdale in the district.

Arizona’s 8th Congressional District

Demos: 32% White, 3% Black, 5% Native American, 1% Asian, 58% Hispanic, 1% Other

This is a lot like the old 7th, though it sheds La Paz to the 7th, parts of central Tucson (including the University of Arizona) into the 9th. In exchange, it picks up some Hispanic heavy turf in Maricopa in the West Valley and the rest of Sierra Vista, and is in the end, several points more Hispanic than the old district (though what this translates to in VAP is unknown); should send some flavor of Dem back to Congress.

Arizona’s 9th Congressional District

Demos: 73% White, 3% Black, 1% Native American, 3% Asian, 18% Hispanic, 2% Other

Picks up white liberals in Tucson and sheds eastern Cochise and the Sierra Vista portions. The two big military installations are here as a community of interest, along with Eastern Tucson. Gabby would do very well here, but as an open seat I’d guess that it’s still definitely winnable for either party.

AZ, ID, and WI: Population by CD

Arizona is gaining one seat, from eight up to nine, and that means that its new target is 710,224, up from 641K in 2000. Interestingly, despite the fact that it’s gaining a new seat, there are still three currently-composed districts that are in a deficit and need to pick up people from elsewhere: the 3rd, 4th, and 5th. These are the three central districts in the Phoenix area that are essentially built out and can’t expand in any direction (except up); meanwhile, the 2nd, 6th, and 7th can continue to expand every which way into the desert, which is precisely what they did over the decade, so look for one additional GOP-friendly seat to be carved out of Phoenix’s endless suburbia (although whether it’s centered in Phoenix’s west or east suburbs remains to be seen… between the commission’s role in deciding, and possible multiple incumbents opening up seats to run for the Senate, there really aren’t any clues what will happen).

Like the other border states, Arizona has become signficantly more Hispanic over the decade, up to 29.6% Hispanic now compared with 25.3% in 2000. The Hispanic growth wasn’t concentrated any one particular place: that 4% increase was closely mirrored in all the districts. The 2nd had the biggest Hispanic shift, at 7% (from 14% to 21%), while the 1st had the smallest shift, at 3% (from 16% to 19%). That dissipation of the Hispanic vote means that it’s not terribly likely that a third VRA seat will be carved out, despite the fact that Hispanics are close to 1/3 of the state’s population.


District Population Deviation
AZ-01 774,310 64,086
AZ-02 972,839 262,615
AZ-03 707,919 (2,305)
AZ-04 698,314 (11,910)
AZ-05 656,833 (53,391)
AZ-06 971,733 261,509
AZ-07 855,769 145,545
AZ-08 754,300 44,076
Total: 6,392,017

I’m not the first one to observe that Idaho redistricting is pretty much drama-free. Nevertheless, there’s at least something interesting going on here in this small but fast-growing state: growth is very heavily concentrated in suburbs and exurbs west of Boise. For instance, the state’s 2nd and 3rd biggest cities used to be Pocatello and Idaho Falls; now they’re Meridian (a large suburb west of Boise) and Nampa (in Canyon County, the next county to the west). That means that the districts are kind of lopsided, and it looks like much of Boise proper, currently split down the middle, will wind up being given to ID-02. While Boise is certainly the most urbane part of the state, and it should tip the balance a bit in the blue direction (as for the past decade, the two districts have had almost identical PVIs), the 2nd should still be a long way away from somewhere the Dems can compete. (Idaho’s target is 783,791, up from 646K in 2000. Look for it to get a 3rd seat in 2020.)


District Population Deviation
ID-01 841,930 58,139
ID-02 725,652 (58,139)
Total: 1,567,582

Wisconsin held steady at eight seats this year, and even its districts held pretty steady, too. Its target is 710,873, up from 670K in 2000. That means the only district that lost population is the Milwaukee-based 4th and even it only lost a few thousand since 2000. The main area of growth is the state’s other blue stronghold, the Madison-area 2nd (must have something to do with THE BLOATED STATE GOVERNMENT AND THOSE GREEDY PUBLIC EMPLOYEES MULTIPLYING LIKE LOCUSTS!!!!1!!), which needs to give about 40,000 people to the 4th (although they’ll have to pass through the suburban 5th, which sits smack dab between them). Also, it looks like Dairyland is gaining a little at the expense of the North Woods, as the 3rd will need to pick up 20K from GOP freshman Sean Duffy’s 7th. Although the GOP controls the redistricting process here, thanks to their House gains in 2010 and the overall uniform swinginess of the rural counties, they’re probably just going to be playing defense with their map.


District Population Deviation
WI-01 728,042 17,169
WI-02 751,169 40,296
WI-03 729,957 19,084
WI-04 669,015 (41,858)
WI-05 707,580 (3,293)
WI-06 705,102 (5,771)
WI-07 689,279 (21,594)
WI-08 706,840 (4,033)
Total: 5,686,986

3 Majority-Minority Districts in Arizona

Arizona is gaining a ninth congressional district this year, and it is certain to be based in the Phoenix suburbs where the population has exploded recently. Generally it is believed that the new district will be Republican-leaning as are most of the Phoenix burbs, but it is actually possible to draw a compact new majority-minority district in the Phoenix area.

Phoenix Metro Area:

The new 9th district (light blue) is 39% White and 50% Hispanic. It encompasses east Phoenix areas drawn mainly out of the 2nd and 3rd districts with a little taken out of the 4th and 7th as well. To make up for that population loss in other districts, the 4th has taken on Tempe, which increases the white percentage in the district to 29% but those are mostly liberal white voters so it should be okay. The 3rd takes on some areas that had previously been in the 5th, and the 5th grabs Chandler from the 6th, evening out the population in the Phoenix area. Some other minor changes have taken place across the state to even out population changes, but nothing major that would change the partisan balance of power in these districts.

This new plan actually includes some things that conservatives could like. After losing Tempe and gaining Chandler, the previously swingy 5th district is now probably solidly conservative. The 2nd and 3rd have lost a considerable portion of their Hispanic populations, making them much safer for the GOP (this should help scandal-tainted rep Ben Quayle). And the new 9th is probably competitive for the GOP in a good year. I would consider it slightly leaning D, but with the gap in turnout between white and hispanic voters and the fact that SB 1070 may have changed the racial demographics slightly here since the census was taken mean that in a low-turnout midterm election this district may be close to a tossup. The only reason that the GOP would have reason to fight this district is that there is a possibility Rep Trent Franks has been redistricted into the 9th district under this map. He lives in Glendale, most of which is in this new 9th district. I highly doubt he would want to run in a majority-minority district, so he would probably fight this plan heavily. If this was a VRA-obligation, however, that might not matter.

As to whether the VRA requires this district, it may be open to interpretation. Important to note is that Arizona is one of the states that requires section 5 preclearance by the DOJ, so the Obama admin has a good chance to argue for the creation of a new majority-minority district if they wanted to. This district is pretty compact, but I think that Arizona could still make the case that you have to go out of your way to draw something like this. Overall I’m not sure if the Obama admin wants to challenge this in court, and I’m not sure if the Roberts court would be receptive to arguments for a new VRA district in Arizona, but I hope that the Obama admin at least tries here, because there is a chance they could succeed.  

Updated!! Arizona, take 2

Speak of the devil! After all my grumbling about the inadequacy of the county-level population estimates, it turned out that our friend Dave was about to produce new tract-level estimates from the American Community Survey. So here is a new district map of Arizona, with exactly the same concept (new exurban AZ9 drawn mostly from the overpopulated AZ2, AZ6, and AZ7) but actual district boundaries as opposed to rough guesses.

With the ACS estimates, the aggregate population was very close to the Census 2010 figure so the “phantom” problem disappeared. It also turned out that Nico was exactly right about how much the old districts had grown: AZ6 was first, followed by AZ2, AZ7, and AZ8. AZ3 and AZ4 weren’t far behind, and AZ5 was actually about 9k understrength.

Here is the new state-level map:

Photobucket

The Phoenix map:

Photobucket

I drew a serious border between AZ7 and AZ8 instead of just guessing, so here is the Tucson map:

Photobucket

District notes:

AZ1: The boundaries were almost identical to the first map I drew, as it needed to take the strip and Kingman from AZ2 to hit its target. Ethnic mix: old 58 white/18 Hispanic/20 Native American, new 61W/15H/21N. Probably a bit more red now.

AZ2: Lost a bit more territory than I expected to the new AZ9. Ethnic mic: old 70W/20H, new 73W/18H.  

AZ3: Had to lose about 45k, and lost them all on its southern end to AZ4. No need to take any of AZ5, which was below its target. Ethnic mic: old 71W/20H, new 73W/18H.

AZ4: Also had to lose about 45k and AZ9 took a big bite out of its southwest corner, forcing it to move a bit north. Not as pretty as it was before, but still nice and blocky. Ethnic mic: old 22W/66H, new 24W/64H. I don’t think Ed’s worried.

AZ5: Only 9k under its target, it could basically stand pat. Swapped a few districts with AZ6 to make the lines cleaner. Ethnic mic: still 71W/17H.

AZ6: I decided to keep Apache Junction here since it’s really an extension of east Mesa and didn’t grow much in the 00s. As in the previous map, it loses the rest of its Pinal piece to AZ9 and its Chandler piece (this time mostly to AZ9 instead of all to AZ5), and retains Gilbert, Queen Creek, and almost all of Mesa. Ethnic mic: old 71W/21H, new 72W/20H.

AZ7: It had to keep a bigger than expected piece of Pinal, which resulted in AZ9 being pushed north. It had to take about 57k people from AZ8, and the current boundaries are a fairly straightforward northwest-southeast line as opposed to a strained attempt to jam as many Hispanics as possible into AZ7. I decided to stick with this and had AZ7 nibble at the edges of AZ8, although I restricted it to tracts that were at least 20% Hispanic. Ethnic mic: old 34W/55H, new 36W/54H.

AZ8: Looks much more like the current AZ8 than my previous map did, and keeps its Pinal tract now. The pieces it lost to AZ7 had the effect of reducing the Hispanic percentage in both districts. Ethnic mic: old 70W/21H, new 71W/20H.

AZ9: The previous AZ9 I drew turned out to not have enough peeps, so now it has to go deep into Chandler on the east side and well north of I-10 on the west side. Interestingly this district is majority-minority at 46% white, 41% Hispanic, and 6% black which is high for Arizona. It probably leans Dem at least in a presidential year.

(here is the original post in its entirety)

Short version: Exurban areas of Pinal and Maricopa counties that grew like a weed in the 00s are carved out of districts 2 (Franks), 6 (Flake), and 7 (Grijalva) to form a new district 9. The other 5 districts only get minor tweaks to meet population requirements for the most part.

This map is my interpretation of shamlet’s description of his own map with an exurban AZ9. My original concept was for AZ9 to stay entirely within the west valley of Maricopa county including the established cities of Glendale and Peoria along with some of the bubble areas to the south, pushing AZ2 to the west to pick up Yavapai county and forcing AZ1 (Gosar) to pick up almost all of Pinal county. I decided that I liked shamlet’s concept better, as mine would have been more disruptive to the current map and would have likely resulted in AZ1 being dominated by exurban Pinal at the expense of its far-flung, highly diverse rural communities.

Some words of warning: The boundaries between the districts are approximate, not absolute. The population estimates in the redistricting app only go down to the county level. This is fine for a state like Iowa where no county is big enough to contain as many as one district, but it causes trouble in Arizona which has just 15 counties, with nearly 80% of the population in just two of them! The distribution of population within Maricopa and Pima counties is uncertain, especially in Pima where nearly 90% of the population is either in Tucson or in unincorporated areas. I drew the lines based on my best guess. A further complication is that the 2010 census shows the state with 6.39m people, well below the 2009 estimate of 6.60m. This map is based on the 2009 estimates for cities and counties, which somewhere include 200k people who apparently aren’t really there. I suspect that a disproportionate number of these phantom people are in the bubblicious AZ9, but they could be anywhere. It will be interesting to see the 2010 census figures for cities and counties, but we don’t have those yet, so…

Here is the statewide map, with the usual color scheme.

Arizona

And here is the close-up of the Phoenix area.

Phoenix area

Now for notes on the individual districts. The target population for each is 713k.

AZ1 (blue): Paul Gosar’s district has an estimated population of 619k (less any phantoms) in its core counties of Yavapai, Coconino, Apache, Navajo, Gila, Graham, and Greenlee. That means it probably needs about 100k from somewhere else, either Mohave or the less populated eastern end of Pinal. I’m  guessing that they would get about that amount from the Kingman area and the “strip” north of the Canyon in Mohave, and from eastern Pinal which has a lot of old mining towns that fit well with the rest of the district. Changes: loses some of south-central Pinal to AZ7, picks up Kingman and strip areas from AZ2 and one Pinal precinct from AZ8 (Giffords).

AZ2 (green): Trent Franks’ district will have to shed a lot of people, but even after losing the Kingman and strip areas and the (formerly?) fast-growing areas of southwest Maricopa, it retains its west valley base with Peoria, most of Glendale, Surprise, and the Sun Cities. I moved La Paz county here from AZ7, as with 33% of its population over age 65 it fits better in AZ2. The boundary shown here between AZ2 and AZ9 is just a guess and could move north or south depending on the final counts. As always, the Hopi reservation is separated from the surrounding Navajo reservation and attached to AZ2. I intended no change in the river-connector between the Hopi rez and the rest of the district, although it does not show up on the map.

AZ3 (purple): I drew Ben Quayle’s Phoenix-dominated district to lose some of its southernmost precincts to AZ4 (Pastor) and absorb north Scottsdale and Fountain Hills from AZ5 (Schweikert), but it appears that it grew faster than AZ5 did. The increase in the House vote from 2002 to 2010 was 34% in AZ3 and just 25% in AZ5, so it’s possible that AZ5 could retain its northeast end. AZ3 could also lose some of its western end to AZ2 if it turns out that AZ2 is too small after AZ9 fills up.

AZ4 (red): Ed Pastor’s Phoenix district started the decade with by far the least undeveloped land of the 8 districts and probably had the least new construction, but its House vote increased by 39% from 2002 to 2010. Its people still vote at a rate far below the state’s other districts (just 92k total votes; the other  7 were all over 150k and 6 were over 200k), so this increase may represent increasing Hispanic participation more than population growth per se. The Census estimated that Phoenix grew just 21% between 2000 and 2009 and it seems likely to me that most of this growth was in AZ3, so I drew AZ4 to pick up some of AZ3’s southern precincts. This may be the cleanest-looking VRA district in the country, and I drew it to stay that way.  If it needs to contract, it would lose some of its southwestern precincts to the new AZ9.

AZ5 (yellow): I generally tried to keep existing districts together, but in this case I went for keeping cities together. David Schweikert’s district loses its Mesa piece to AZ6 while picking up the rest of Chandler. It now consists of Tempe (179k in 2009), Chandler (250k), Ahwatukee (85k in 2000 but probably more in 2009), and enough of Scottsdale (238k) starting from its south end to fill up to its quota of 713k.

AZ6 (teal): Jeff Flake’s district shrinks considerably and pulls entirely out of Pinal. It now consists of Mesa (467k), Gilbert (222k), and Queen Creek (26k) which put together would be big enough to make up a district if not for the phantoms. It could take Chandler-area precincts that I drew it losing to AZ5 as necessary to fill up.

AZ7 (gray): There are a total of 1.39m people (again, less any phantoms) in the four southern counties of Yuma, Pima, Santa Cruz, and Cochise, which is nearly enough to support two districts. Raul Grijalva’s district can pick up the necessary overage from the sparsely populated Gila Bend (I-8) section of Maricopa and the southwest corner of Pinal. If needed it could also retain La Paz, which as mentioned above is a poor fit for the district in my view. I don’t know where the border between AZ7 and AZ8 in Pima should go. I suspect that the AZ8 piece of Pima grew faster, as the House vote increase from 2002 to 2010 was 32% in the AZ7 section compared to 40% in the AZ8 section. I had AZ7 take the mostly-empty remaining sections of Santa Cruz and a few Pima precincts mostly west of I-10 or I-19 from AZ8.

AZ8 (blue-gray): I suspect that poor Gabrielle Giffords’ district won’t have to lose too much ground. Its House vote increased 41% from 2002 to 2010, but this may have been partly due to the 2010 race being a barnburner whereas 2002 was a snoozer. Cochise county grew 10% in the 00s and Pima 21%, and it’s likely that the AZ7 section of Pima grew at a decent clip so it seems probable that AZ8’s growth was less than its vote totals suggest. This district loses its small Pinal and Santa Cruz pieces and otherwise looks about the same as before.

AZ9 (toothpaste blue): The new district comes almost entirely from the fast-growing exurban Phoenix areas of southwestern Maricopa and western Pinal. It combines the Pinal portion of AZ6, some south-central Pinal areas of AZ1, the Phoenix-area piece of AZ7, and much of the southern end of AZ2. Its population centers include Avondale (85k), Buckeye (52k), Goodyear (64k), the city of Maricopa (45k) which oddly enough is in Pinal, most of unincorporated Pinal (161k), Casa Grande (44k), Apache Junction (34k), and probably a fair portion of unincorporated Maricopa (229k). This district may have the highest percentage of homes in foreclosure in the nation, and probably more phantoms than any of the other districts. As necessary it could take some of the eastern part of Pinal from AZ1 or the southern end of AZ2 to get up to full, which would affect the division of Mohave county between AZ1 and AZ2. Politically this district would probably start out tilt-R or lean-R but shift D as its Hispanic population starts to vote more. Flake won exactly 2/3 of the two-party vote in the AZ6 Pinal piece (30k total votes), although this was less than his districtwide margin. On the other hand, the very liberal Grijalva won 54% of the two-party vote in the AZ7 Maricopa piece (24k total). The current AZ2 is blood-red, but the piece it would lose to AZ9 is most likely younger, poorer, and more Hispanic than most of the rest of the district given that housing prices tend to be lowest in the furthest-out areas. Gosar did about as well in the Pinal section of AZ1 as he did districtwide, but the section that would be lost to AZ9 may differ from the section that would remain in AZ1.

Overall, Arizona presents a rare case where a new district can be created without fundamentally changing any of the existing districts. The state’s most explosive growth areas were nearly empty at the start of the decade and close enough together that combining them makes a compact, contiguous, sensible district that would pass muster in a commission-redistricting state. AZ2, AZ6, and AZ7 lose a lot of territory, but almost everyone who lived in one of these districts in 2002 and stayed put will still be in their old district. None of the current House members are likely to be helped or hurt much. Grijalva will be glad to be rid of La Paz but not so much his Phoenix-area precincts, and Gosar would like to pick up some of Mohave, but these are marginal changes.  

Thoughts?  

By what margin will Bob Shamansky win?

View Results

Loading ... Loading ...