Democratic control of the Virginia Senate gives Democrats the possibility of some leverage in drawing the lines for Congress. Retaining control of the Senate is very important if Republicans put off redrawing the Congressional lines until after November, but the majority is fairly narrow at 22D-18R, and the entire body is up for re-election this fall.
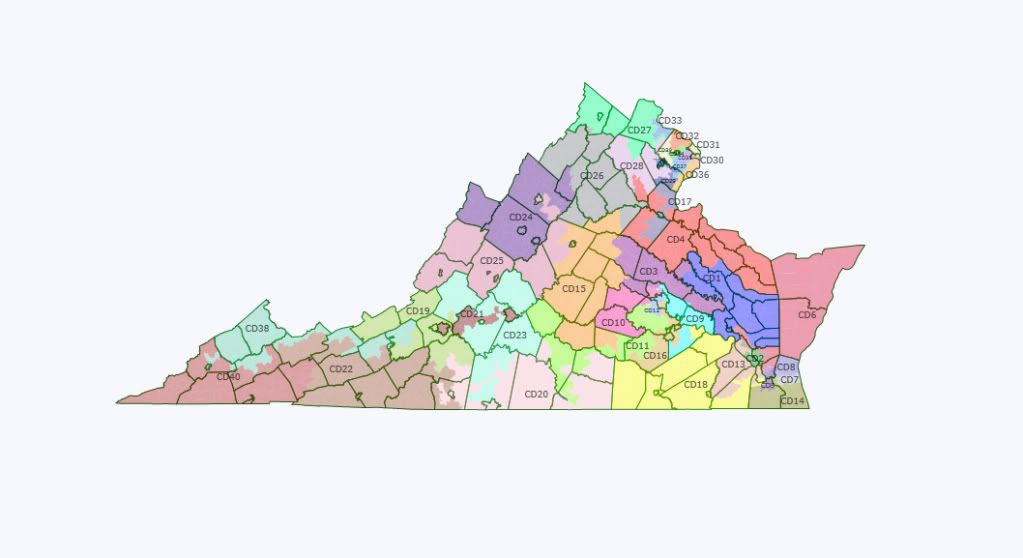
I’ve attempted to create a map that balances the interests of current senators in reelection and the national interests of the party in maintaining control by any means necessary. I think I’ve been able to sufficiently protect all incumbents while maximizing the number of Democratic districts, and the map is a large improvement over the current Republican gerrymander. Although conventional wisdom holds that each chamber will draw its own lines, I’m not sure the House of Delegates would approve something like this map.
Western Virginia:
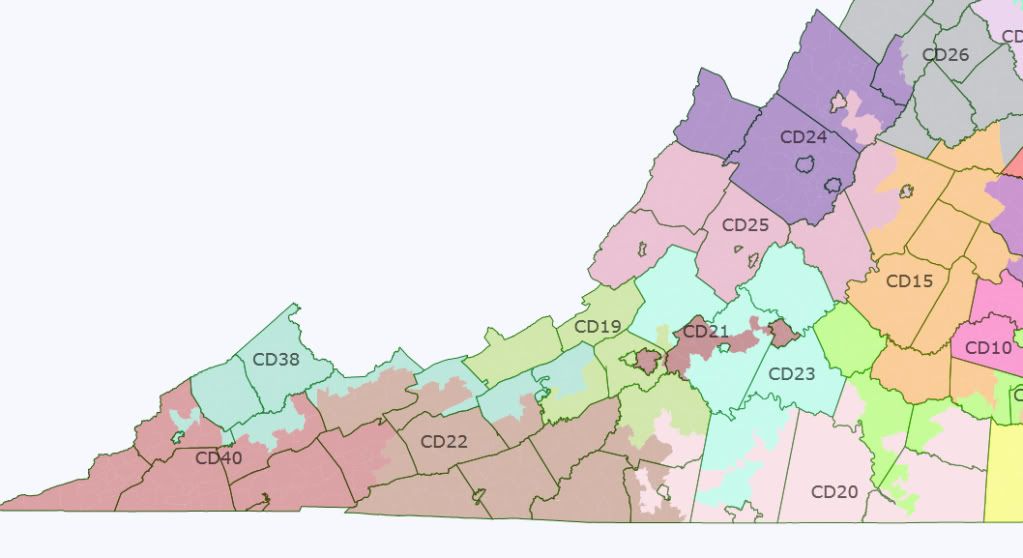
District 15: Open
Obama 53.9%
Democratic 51.1%
District 19: Ralph Smith (R)
Obama 38.3%
Democratic 40.1%
District 20: Roscoe Reynolds (D)
Obama 52.2%
Democratic 49.5%
District 21: John Edwards (D)
Obama 52.6%
Democratic 51.8%
District 22: Open
Obama 34.4%
Democratic 38.7%
District 23: Steve Neuman (R), Bill Stanley (R)
Obama 33.5%
Democratic 35.3%
Note: Making a last minute change with the 21st, I accidentally cut this district in half, but it would only require shifting one precinct to make the district contiguous.
District 24: Emmett Hanger (R)
Obama 34.7%
Democratic 33.0%
District 25 Creigh Deeds (D)
Obama 58.4%
Democratic 56.3%
District 38: Phil Puckett (D)
Obama 50.2%
Democratic 52.1%
District 40: William Wampler (R)
Obama 34.1%
Democratic 38.1%
Eastern Virginia:
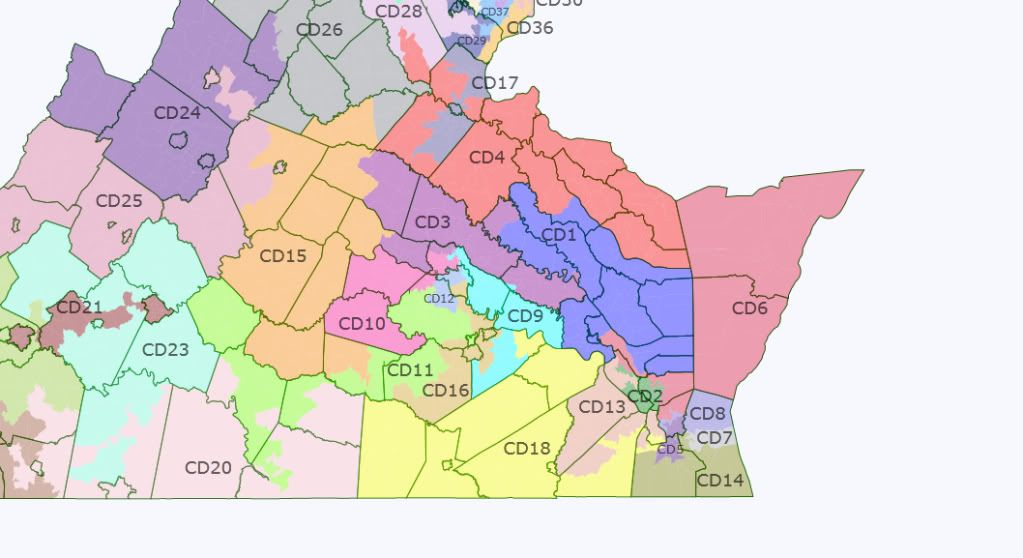
District 1: Tommy Norment (R)
Obama 41.1%
Democratic 41.2%
District 2: Mamie Locke (D), John Miller (D) (maybe)
Obama 72.3%
Democratic 66.3%
Black VAP 51.1%
District 3: Ryan McDougal (R), Walter Stosch (R)
Obama 35.8%
Democratic 35.2%
District 4: Richard Stuart (R)
Obama 45.1%
Democratic 42.5%
District 5: Yvonne Miller (D)
Obama 72.7%
Democratic 67.9%
Black VAP 51.3%
District 6: Ralph Northam (D)
Obama 56.7%
Democratic 52.5%
District 7: Frank Wagner (R)
Obama 55.1%
Democratic 49.5%
District 8: Jeff McWaters (R)
Obama 53.1%
Democratic 52.2%
District 9: Donald McEachin (D)
Obama 74.7%
Democratic 70.5%
Black VAP 56.7%
District 10: John Watkins (R)
Obama 42.2%
Democratic 39.0%
District 11: Steve Martin (R), Frank Ruff (R)
Obama 37.8%
Democratic 35.6%
District 12: Open
Obama 64.1%
Democratic 59.0%
District 13: Fred Quayle (R), John Miller (D) (maybe)
Obama 50.3%
Democratic 49.5%
District 14: Harry Blevins (R)
Obama 39.7%
Democratic 39.0%
District 16: Henry Marsh (D)
Obama 72.1%
Democratic 65.0%
Black VAP 51.0%
District 17: Edd Houck (D)
Obama 51.2%
Democratic 45.2%
District 18: Louise Lucas (D)
Obama 65.1%
Democratic 61.3%
Black VAP 52.3%
Northern Virginia:
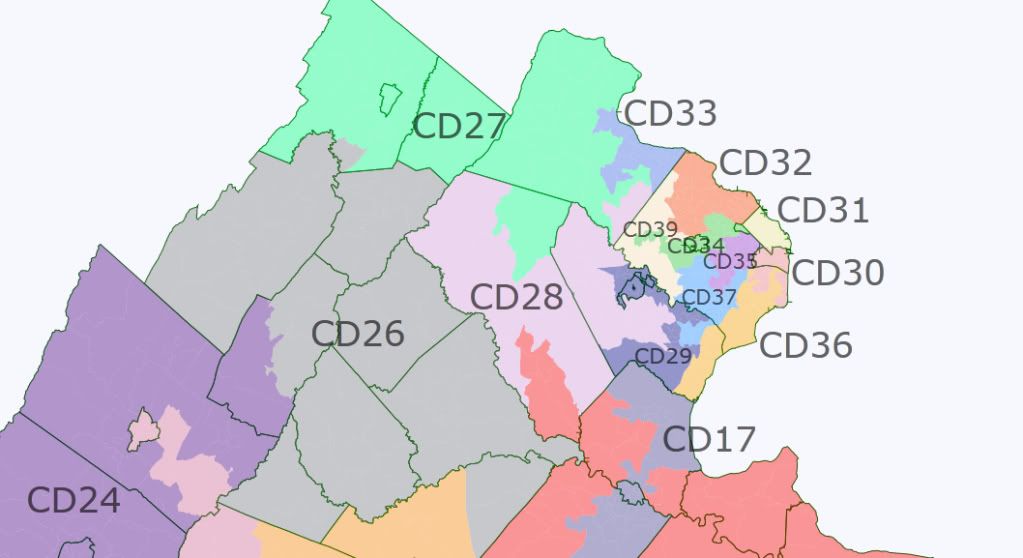
District 26: Mark Obenshain (R)
Obama 41.6%
Democratic 37.9%
District 27: Jill Vogel (R)
Obama 37.9%
Democratic 40.6%
District 28: Open
Obama 43.9%
Democratic 41.0%
District 29: Chuck Colgan (D)
Obama 58.9%
Democratic 50.0%
District 30: Patsy Ticer (D)
Obama 68.6%
Democratic 66.2%
District 31: Mary Margaret Whipple (D)
Obama 68.1%
Democratic 70.3%
District 32: Janet Howell (D)
Obama 59.0%
Democratic 57.2%
District 33: Mark Herring (D)
Obama 54.6%
Democratic 49.2%
District 34: Chap Peterson (D)
Obama 58.8%
Democratic 54.7%
District 35: Dick Saslaw (D)
Obama 61.9%
Democratic 58.9%
District 36: Toddy Puller (D)
Obama 68.4%
Democratic 61.5%
District 37: Dave Marsden (D)
Obama 59.4%
Democratic 54.6%
District 39: George Barker (D)
Obama 56.2%
Democratic 53.0%
I would rate the lean of the seats as follows:
Safe Democratic (Obama and Democratic vote percentage both above 50%): 22
Toss-up (Obama percentage or Democratic vote percentage above 50%): 5
Safe Republican (Everything else): 13
Thoughts?