So I finally registered on SSP and this map is my first posting of North Carolina. It’s intended to result in 9 safe GOP districts, all of which are 57% McCain or above, and 4 safe majority-minority Dem districts, two of which are plurality VAP black.
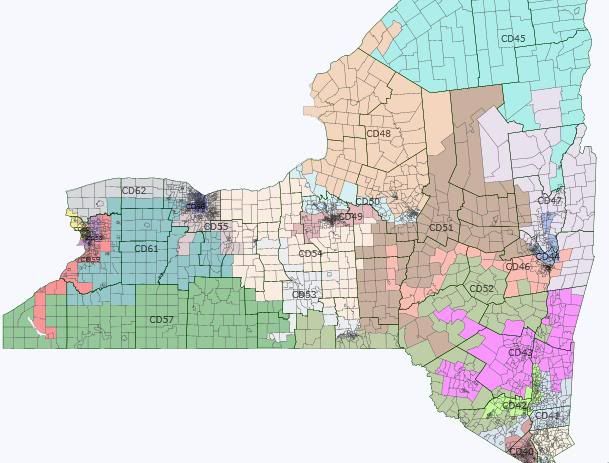
Overview:

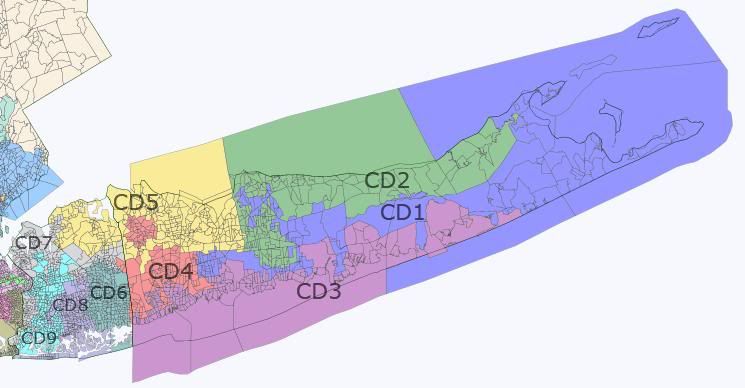
From East to West:


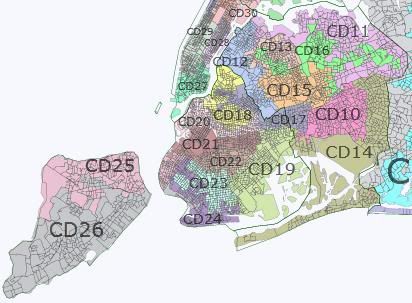
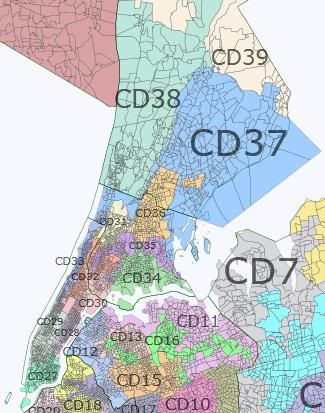
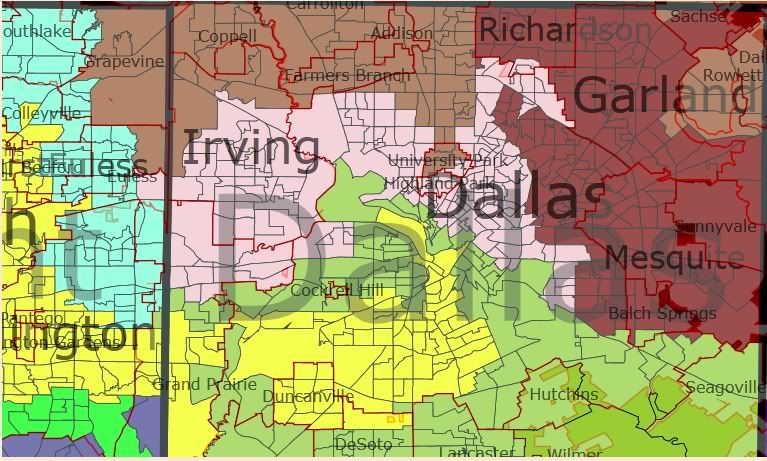
Finally, a close up of the Triangle and the Triad:


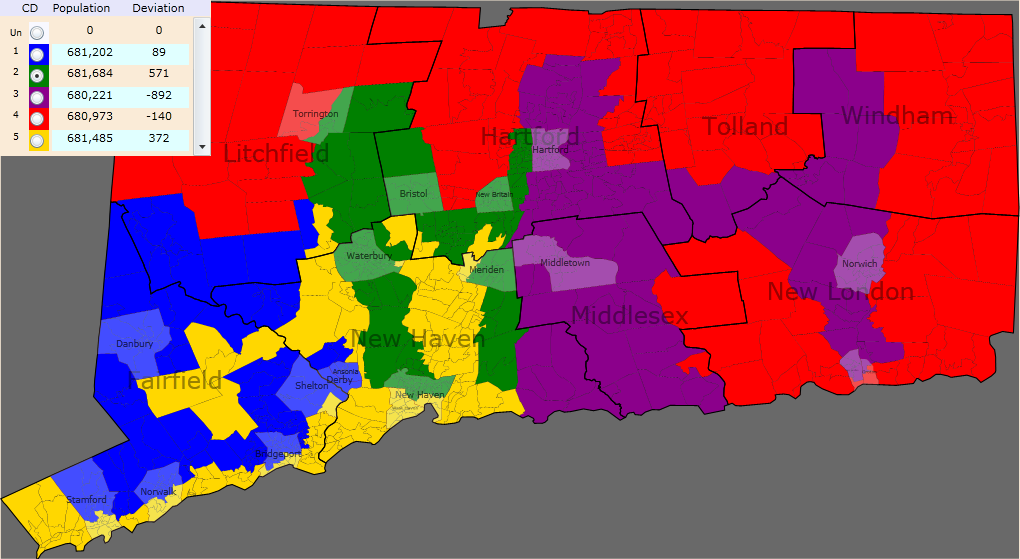
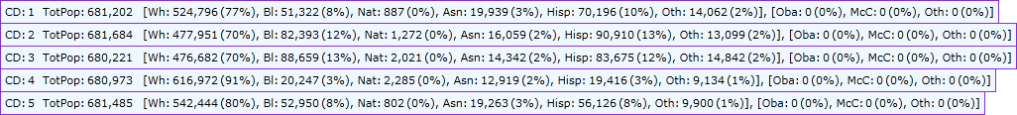
All districts are within 500 of ideal population as follows:
Obama/McCain White/Black/Hispanic/Asian/Native/other
NC-1 (Blue) G.K. Butterfield (D)
67.5-32.0 40.9/47.8/7.4/1.7/0.7/1.5
The 1st loses a bit of the coastal region but the only major change is a snaking addition into Raleigh to pick up heavily Democratic and minority voters so as to have enough population.
Safe Democratic
NC-2 (Green) Renee Ellmers (R), Larry Kissell (D)/Mike McIntyre (D)
40.7-58.4 69.3/15.2/9.5/2.5/1.6/2.0
The 2nd undergoes significant changes as it loses area in Raleigh proper and the counties to the northeast and gains heavily Republican territory to the south and west from the current 7th and 8th districts. Ellmers should be safe here barring a primary challenge from another Republican, but seeing as how she’s very conservative this shouldn’t be a huge problem for her. Incidentally, Kissell’s home in Biscoe and possibly McIntyre’s in Lumberton have both been placed into the 2nd.
Safe Republican
NC-3 (Purple) Walter Jones (R)
40.8-58.3 76.5/14.6/5.5/1.1/0.4/1.8
The 3rd loses its appendage towards Wilson and Rocky Mount and gains one snaking down the rest of the coast to include Republican friendly territory from the current 7th. Jones’ district becomes slightly more Democratic but that shouldn’t be much of a problem for him.
Safe Republican
NC-4 (Red) David Price (D)
77.4-21.8 41.6/37.9/11.9/5.9/0.4/2.2
The 4th loses all of the southern 3rd and northwestern section of Wake County and instead bisects it to pick up heavily Democratic and minority voters. The most radical change to the 4th, and what makes this configuration so devastating, is that it extends an arm across Alamance and Guilford counties, picking up very heavily minority and Democratic territory from Greensboro and High Point and in the process screwing over Brad Miller. The 4th is one of the most Democratic districts in the South and would be one of the most Democratic MMD to elect a white Democrat.
Safe Democratic
NC-5 (Yellow) Virginia Foxx (R)
41.2-57.6 80.7/9.0/7.0/1.6/0.2/1.5
The 5th loses territory around Winston Salem and the counties to the north and west while trading territory with the 11th around Marion, Lenoir, and Hickory. The district also adds territory in northern Mecklenburg. Virginia Foxx might have some difficulty here since the 5th has become a moderate amount more Democratic and undergoes a moderate to large change in territory, however this is due to her weakness as a candidate. Even Foxx should be all right here, and a generic R will have little to no trouble.
Safe Republican
NC-6 (Teal) Howard Coble (R)
41.0-57.9 75.6/12.8/7.8/1.9/0.4/1.5
The 6th keeps most of its base in Greensboro and suburban Guilford county while the only substantial changes include trading Moore for Chatham county and taking in some outer heavily Democratic precincts in Guilford so that the surrounding Republicans can be shored up. I accidentally drew Coble out of the 6th since he actually lives in Summerfield, but that shouldn’t really be a problem since he’s represented much of the district for decades and probably won’t serve that many more terms anyway. It will probably trend a little Democratic over the decade but should be safe for Coble or any other country club Republican.
Safe Republican
NC-7 (Gray) Open/Mike McIntyre (D)
63.3-36.0 41.0/37.2/9.5/1.5/8.2/2.6
And here is where the fun begins. I could have just done an 8-3-2 map leaving Shuler and McIntyre in competitive districts, or another configuration of 9-4, but after playing around with DRA a little, I realized it was possible to draw a 4th (heavily gerrymandered) majority-minority district in southeastern NC. So here goes:
The 7th loses most of the whiter parts of its current configuration and adds minority heavy areas to the north in Goldsboro and to the west in territory from the current 8th. Fayetteville is now almost entirely within the 7th. All but one voting block within Mike McIntyre’s hometown of Lumberton is included in the 7th, but that is pretty much irrelevant because McIntyre wouldn’t last two seconds in a primary here seeing as how the district is significantly more Democratic than the current 7th.
Overall, the only reason the GOP would consider allowing for this configuration is that it unambiguously removes Kissell and protects Ellmers and Myrick, but at the cost of securing a seat for a significantly more liberal Democrat than McIntyre.
Safe Democratic
NC-8 (Steel Blue) Open
40.7-58.4 68.3/18.2/9.5/1.6/0.4/1.9
The 8th here bears no resemblance to the current district and reflects just how screwed Larry Kissell would be since the surrounding districts have gobbled up the entirety of his district. The new 8th stretches from Wake to Onslow county and is composed mostly of territory from the current 2nd and 3rd. Before 2010 there would have been the chance for a Mike McIntyre clone the right type of Democrat to win here, but Dems got absolutely slaughtered here in 2010 and have a bit of a weak bench.
Safe Republican
NC-9 (Cyan) Sue Myrick (R)
40.4-58.7 75.8/11.3/8.6/2.4/0.3/1.6
Due to population gains the 9th had to shed a lot of territory and does so by losing all of its area in Gaston and northern Mecklenburg counties. Since the 9th showed quite a large shift in voting patterns between 04 and 08 I added more conservative territory from the dead carcass of Larry Kissell’s 8th district with the 9th now containing blood red territory to the east of Charlotte. This district should be safe for Myrick, but it would be interesting to see how it trends over the whole decade due to large gains in population.
Safe Republican
NC-10 (Magenta) Patrick McHenry (R)
41.9-57.1 78.1/11.4/6.2/2.3/0.3/1.6
The 11th changes significantly in order to allow Republicans to remove Shuler in the neighboring 11th. The district picks up the remnants of the old 9th in Gaston County and reaches an arm into Ashville to annex the majority of its Democratic base. To compensate for this lunge towards the left, the 10th district trades Democratic leaning Hickory, Lenoir, and Morganton to the 5th in exchange for more dyed-in-the-wool Republicans. The district becomes significantly more Democratic from extremely safe Republican to just pretty safe Republican, but McHenry now represents a lot of new territory and could be vulnerable to a primary challenge.
Safe Republican
NC-11 (Chartreuse) Heath Shuler (D)
41.7-57.0 87.6/3.9/5.0/0.7/1.4/1.6
Ah, the other beauty of this map. Since the 9th is able to shift east unhindered by Larry Kissell’s 8th, the 10th is able to also shift east, which provides ultra conservative territory for the 11th to pick up. Ashville and Marion are almost entirely removed from the 11th which deprives Shuler of Democratic base voters, however it is plausible that his appeal to conservative-leaning Dems and Indies could provide a path to victory. Generic R would be heavily favored against Shuler and all but guaranteed against a Generic D.
Likely Republican vs. Shuler
Safe Republican vs. Generic D
NC-12 (Medium Blue) Mel Watt (D)
73.2-26.1 35.3/43.1/15.3/3.9/0.3/2.1
The 12th loses all of Greensboro, High Point, and Thomasville, but picks up large parts of eastern Charlotte from the old 8th. There’s nothing else but some minor changes, such as not hugging the county line between Charlotte and Winston-Salem to free up extra Republican voters. There’s no point in crying about not splitting towns and counties when it doesn’t constitute a back door veto on a Democratic gerrymander. Republicans have stated that they won’t draw anything like the current 8th, but it still remains an effective vote sink when drawn from Charlotte to Winston-Salem.
Safe Democratic
NC-13 (Salmon) Open/Brad Miller (D)
42.0-57.0 77.8/13.0/5.9/1.6/0.3/1.4
Karma has it out for Brad Miller with this map, although pretty much any GOP effort guarantees he’s finished, which is quite a shame. The 13th loses all of its heavily democratic territory in Greensboro, Burlington, and Cary, and most of it in Raleigh in exchange for the most GOP-friendly parts of northern Wake County. Additionally, the 13th moves westward to pick up large amounts of territory from the 5th by extending across to Yadkin County. Since I didn’t know exactly where Brad Miller lives in central Raleigh, it’s possible he lives in either the 1st or the 13th, but that’s utterly irrelevant since the 13th no longer contains his urban bases in Wake and Guilford counties.
Safe Republican
Intended result:

Summary:
Republicans shore up all of their incumbents, most importantly Ellmers and Myrick, while dividing up fast growing Wake and Mecklenburg counties among various buffered districts. Brad Miller, Larry Kissell, and Mike McIntyre are dead men walking. Miller gets replaced by a conservative Republican, Kissell has no district and a conservative Republican wins the new 8th to the east. McIntyre is defeated in the primary by a much more liberal, minority Democrat if he runs in the new 7th. Heath Shuler likely loses to a Republican without the Democratic base in Ashville. Furthermore, by removing Shuler, Kissell, and McIntyre in 2012 the GOP prevents a statewide challenge from a moderate-to-conservative Democratic sitting congressman in 2016.
This configuration is made entirely possible by its four majority minority Dem vote sinks which lock in the 9-4 split, assuming that Shuler loses, for most, if not all of the decade. Additionally, the 4th is a 77%!!!1!1! Obama district yet only 54.2% VAP minority, and is an ambitious radical, socialist, atheist Marxist’s Democrat’s wet dream.
Now… obviously this map would draw myriad lawsuits after all of two seconds, and state Republicans have claimed they won’t attempt anything like the current 12th, but they were also clamoring for independent redistricting until they found themselves in the majority. It’s not sleek and pretty, and it could only care a little less about city and county lines, but if this map has any chance of surviving in court then having 9 safe seats is much smarter for the Republicans than having 8 or 10 shaky seats with the added bonus that anyone who won the 4 Dem districts would likely be too liberal to win statewide.
And as an added bonus, North Carolina with 5 majority minority districts:

All are majority minority voting age population, and the first remains majority black, but barely so.
What do you all think?


