Two years ago on daily Kos, I published a bunch of diaries on Senate races, with elaborate graphs.
They’re BAAAAACK, and this time, I’m cross posting them here!
Method:
1. I gathered polling data from Pollster.com. I only included polls in 2008.
2. I assigned the undecided in two ways: 75% to the challenger (per general practice) and 50-50. The first method is represented by solid boxes. The latter method by hollow dots.
3. I then added loess lines to all 4 series of boxes: Solid lines for the solid boxes, dotted lines for the hollow dots. Good descriptions of loess (aka local regression) are here (technical notes on local regression)
Now, pollster.com has its own charts, and there’s nothing wrong with them. I like mine better. First, they have more information. I show different outcomes with different divisions of the undecided. Second, I like my smooths better. Third, I assign the undecideds, making things a little less choppy.
On to the first two races:
Alaska:
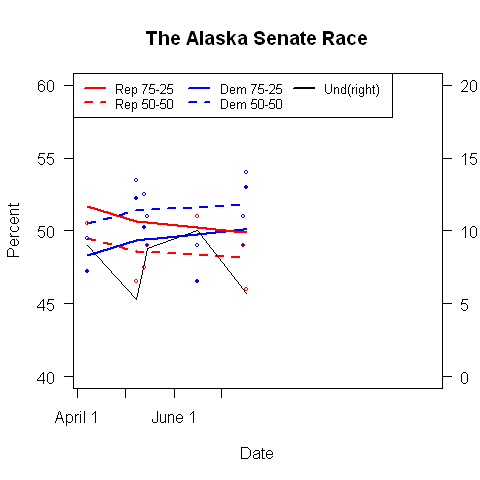
If we assume that the undecideds break evenly (dotted lines) then Begich is up by about 5. If we assume they favor the incumbent (seems unlikely in Alaska) then Stevens and Begich are tied.
Colorado:
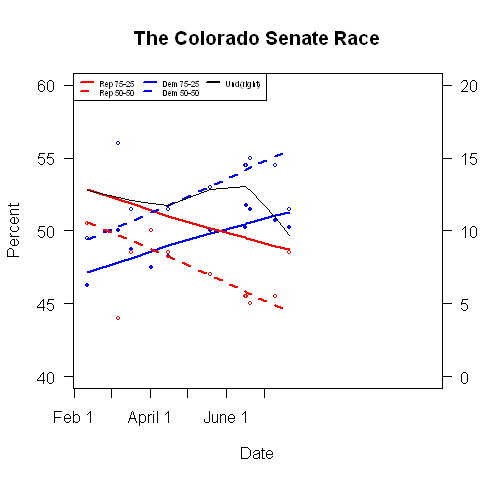
If we assume that the undecideds break evenly (dotted lines) then Udall is up by about 11; if we assume they break in favor of the Republicans (as incumbents) then Udall is up by about 5
Some notes:
1. For any poll and for either method, the percentages add to 100.
2. If the hollow box is far from the solid box, then there are a lot of undecideds.