(Cross-posted at WMR, ML, and BFM-pb)
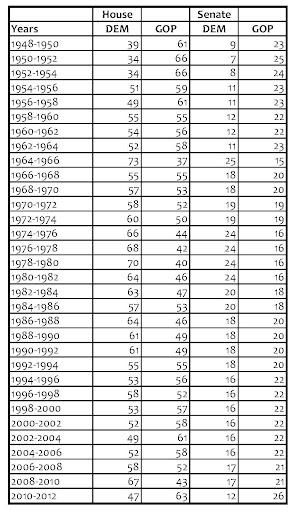
Perhaps the biggest surprise on late hours of November 2 was the enormity of the Democratic defeat in the Michigan State House. While many had predicted that the Democrats’ margin of 67 to 43 would be reduced, few predicted that they would lose control of the lower chamber (myself included) and end up with 47 seats, a humiliating 20 seat loss. Indeed, Democratic numbers in the State House and Senate have not been this low since 1954, a time when Michigan’s legislature in the legislature was malapportioned prior to the 1964 Constitution. Just for reference, Table 1 below shows partisan control of the Michigan State House and Senate from 1955 to the present.
http://lh5.ggpht.com/_IM4e5b7O…
Table 1: Michigan Legislative Control, 1948-2012
What caused this twenty seat loss for the Democrats? Commentators have noted that Democratic turnout crashed on the rocks this cycle, with turnout in key Democratic precincts lower than even in 1998 or 1994 (or even 1966 for that matter). I think that the 2010 disaster can be explained largely by region, statistics, and redistricting.
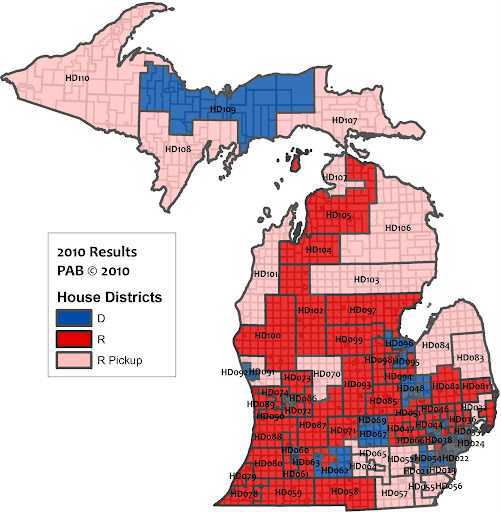
Consider regionalism first. The map below shows partisan control of State House statewide.
http://lh3.ggpht.com/_IM4e5b7O…
Map 1: Michigan State House Partisan Control
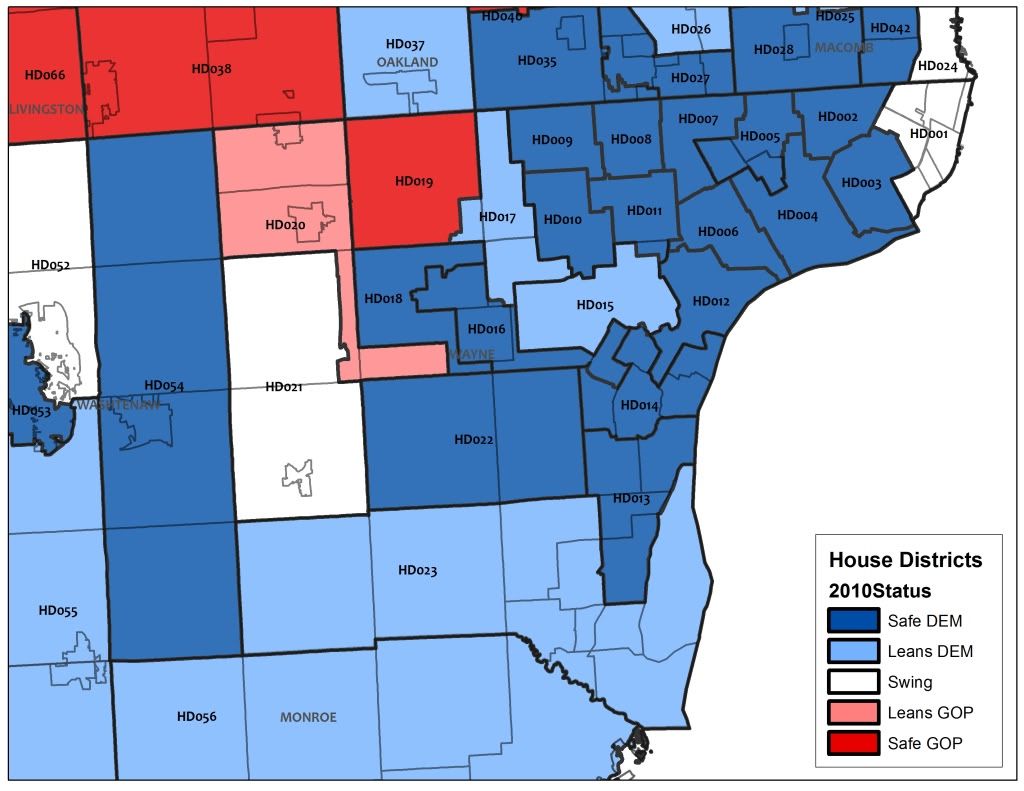
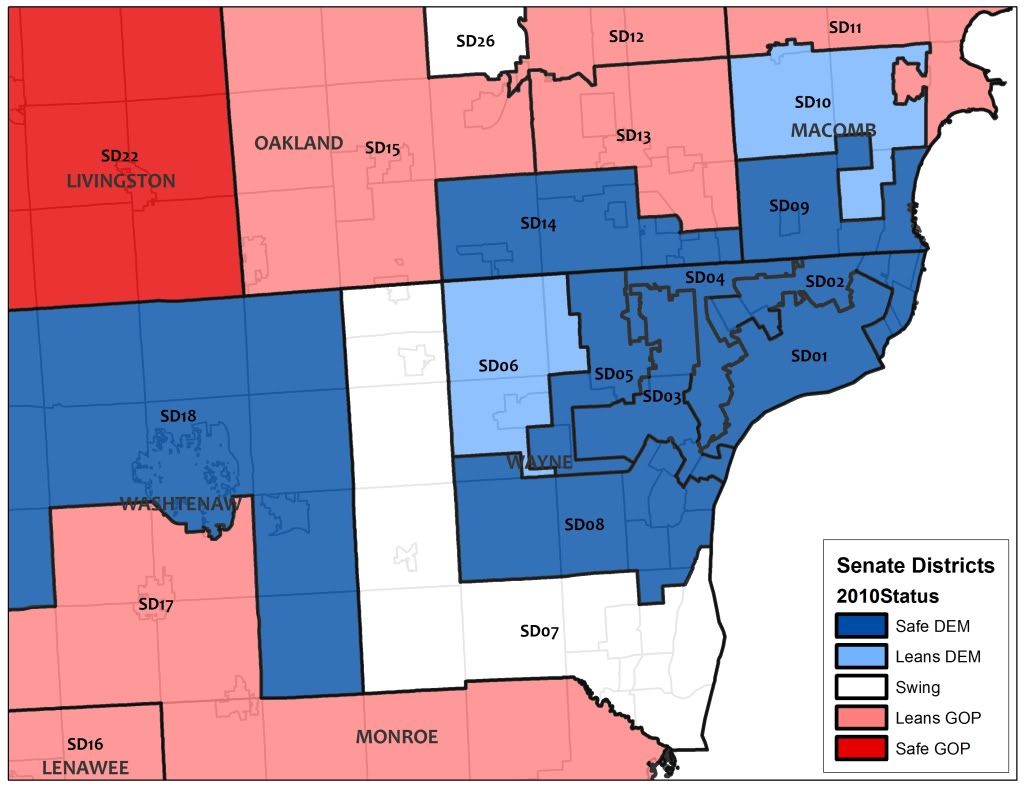
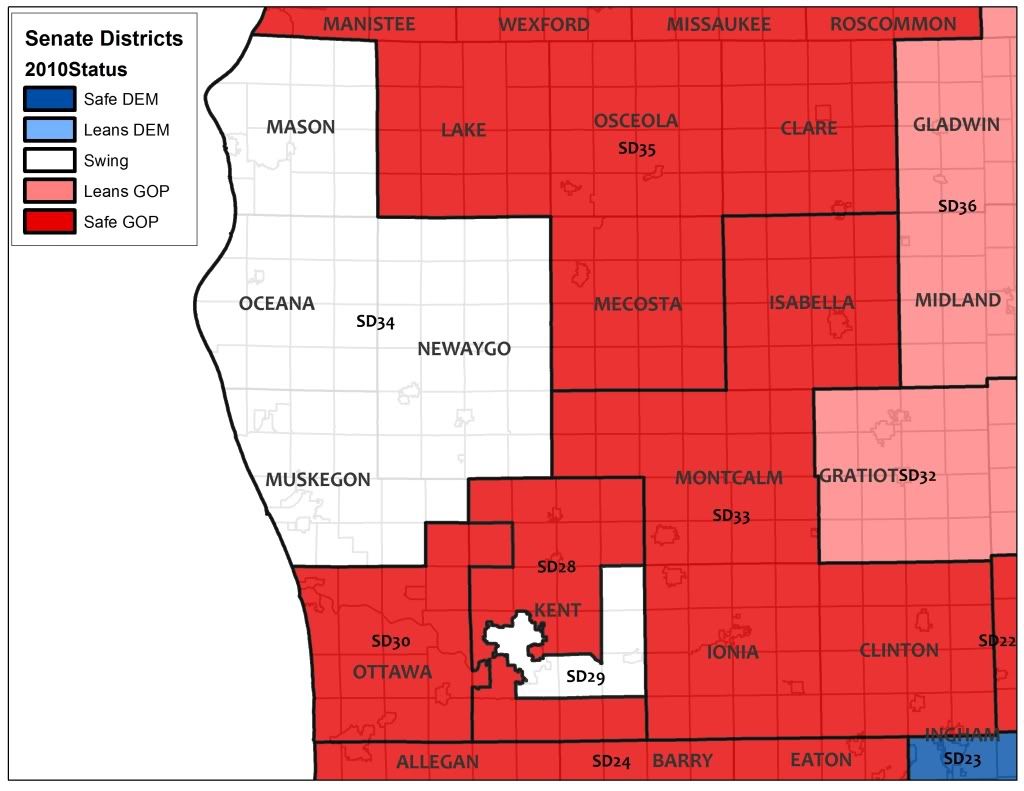
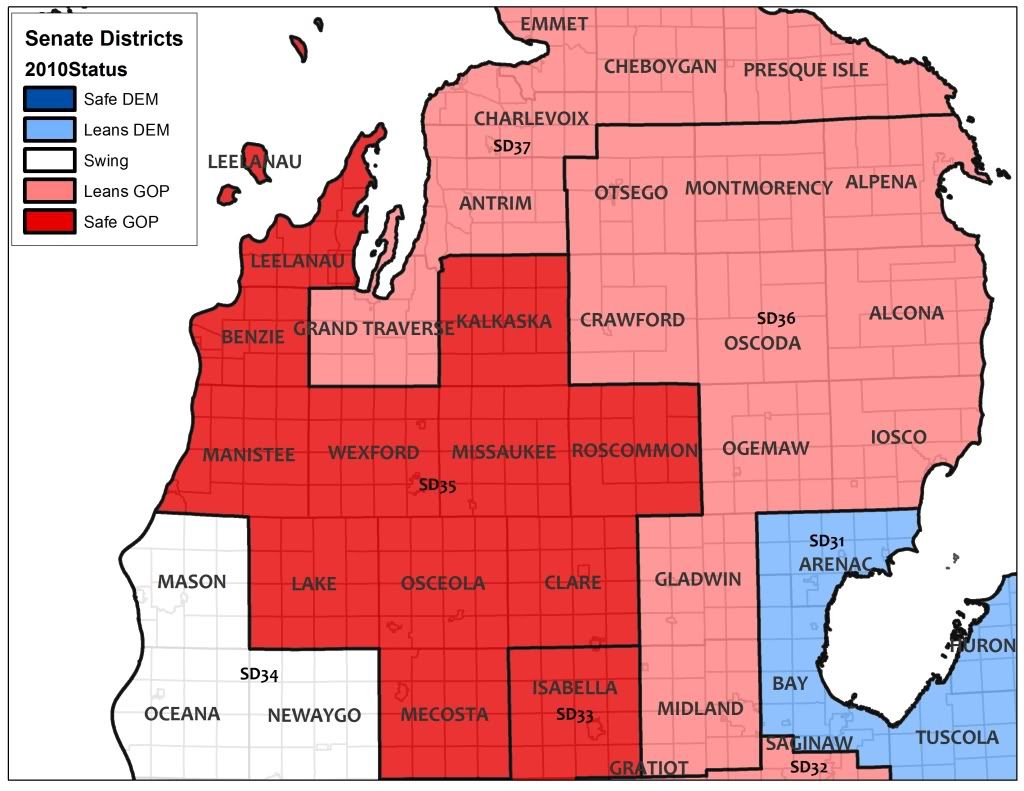
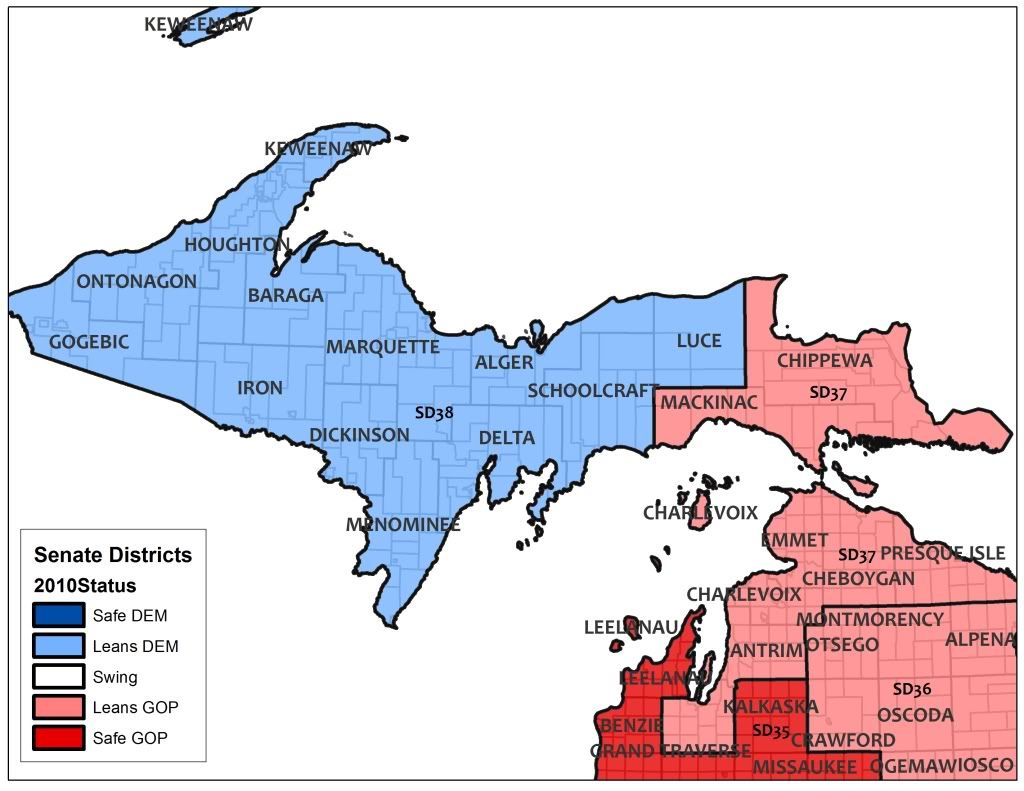
One can see the 20 seats gained by the GOP on November 2 are largely concentrated in three regions of the state: Northern Michigan, downriver/eastern Michigan, and Macomb County. Of these 20 seats, 14 were open, while 6 were lost by Democratic incumbents. Maps 2-5 shows these areas in greater detail.

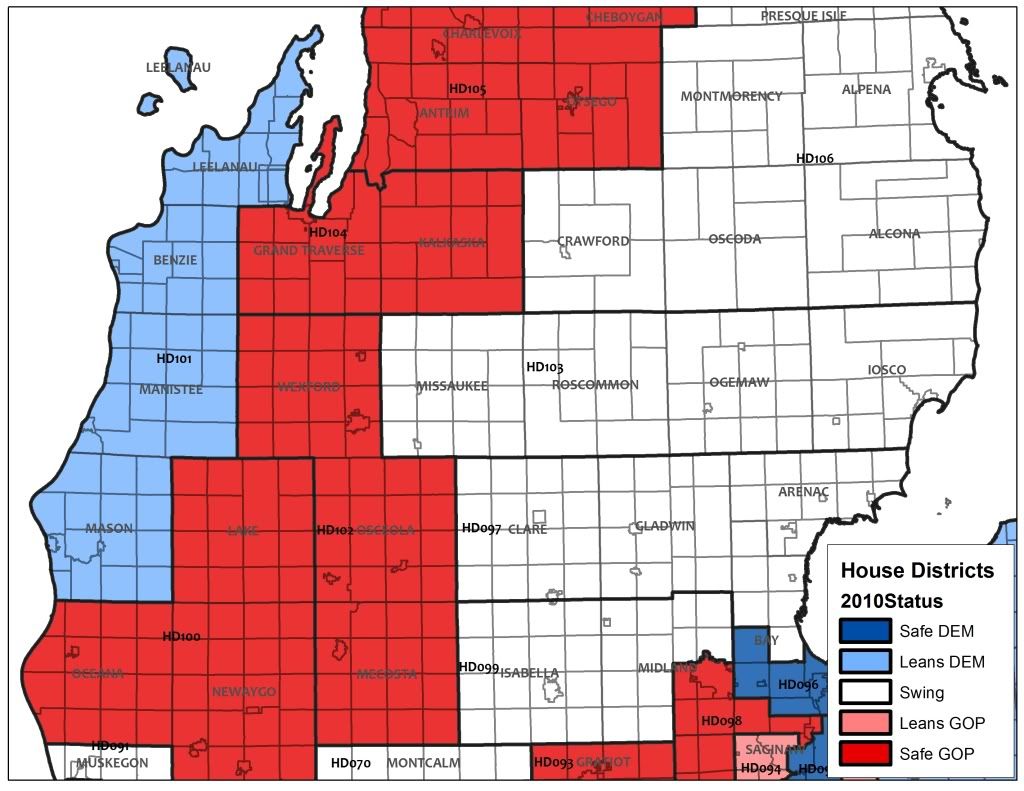
http://lh3.ggpht.com/_IM4e5b7O…
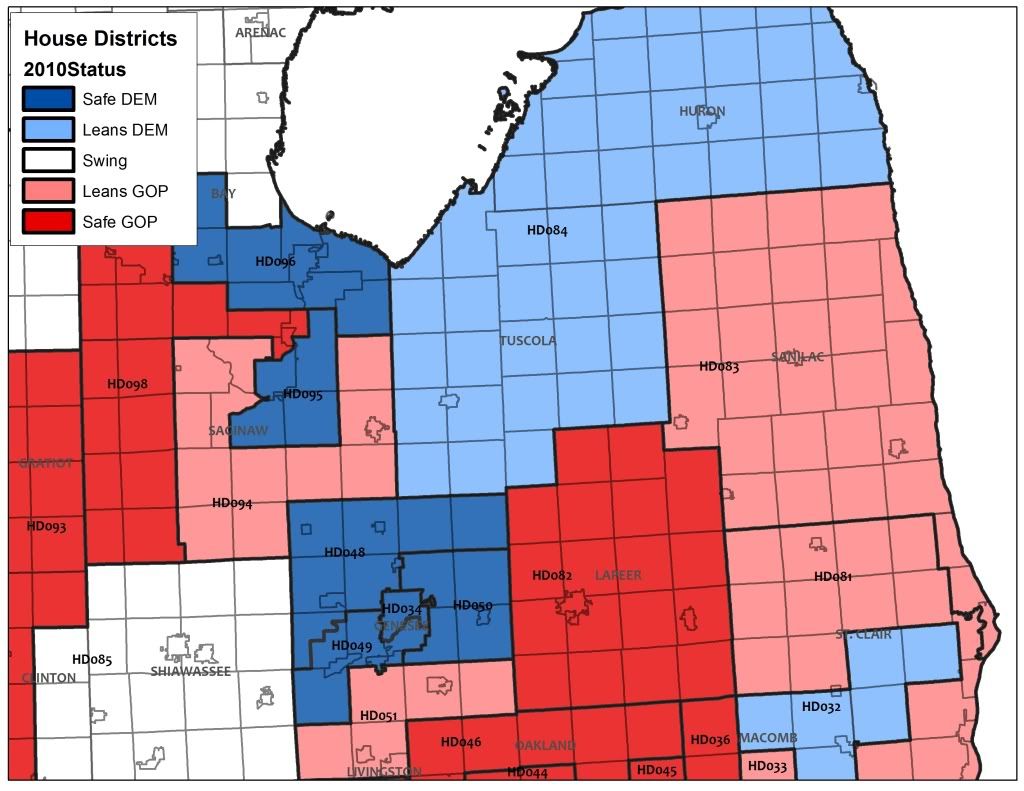
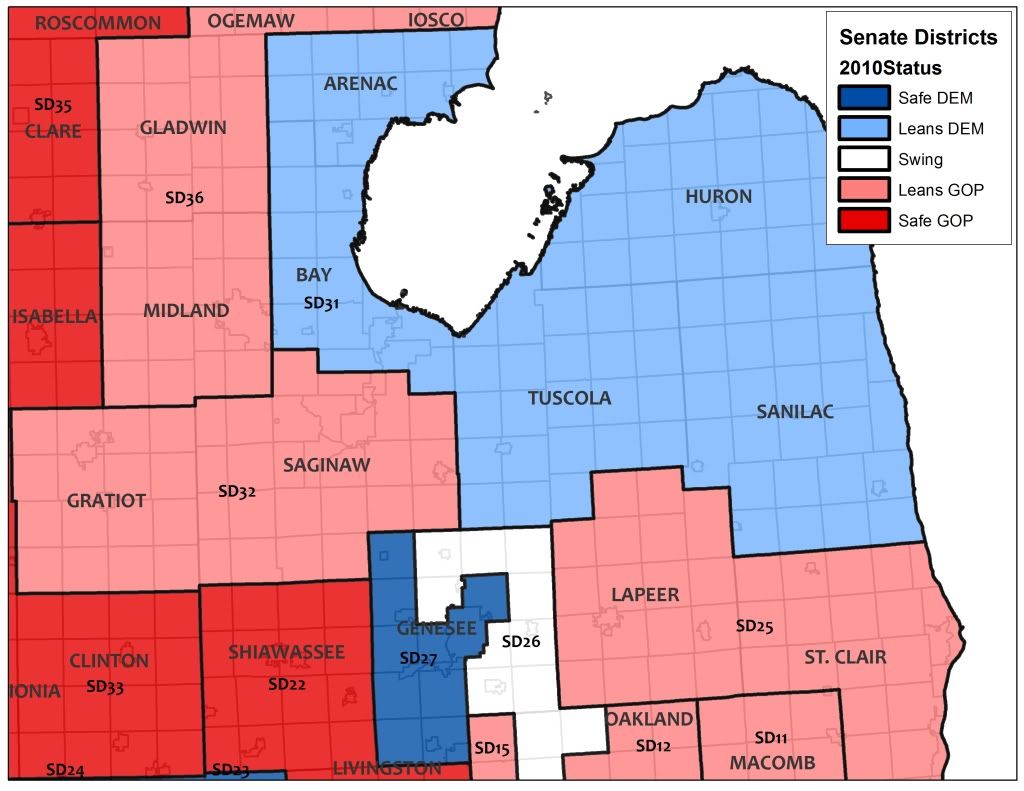
Map 2: Northern Michigan

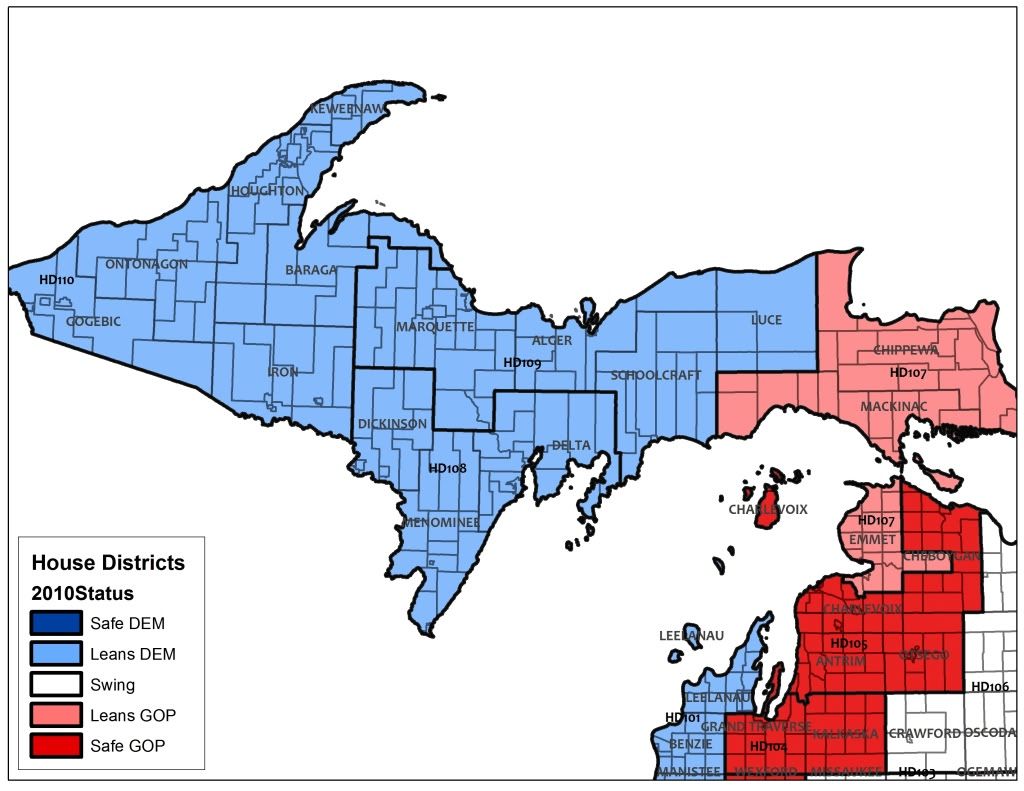
http://lh6.ggpht.com/_IM4e5b7O…
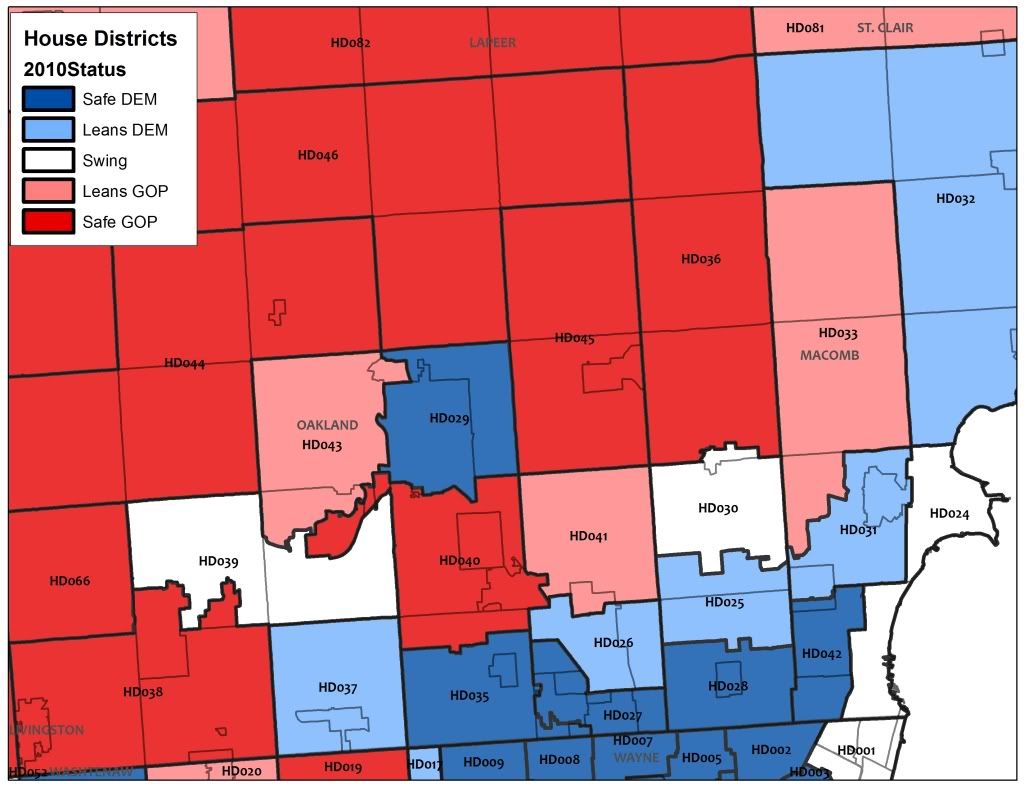
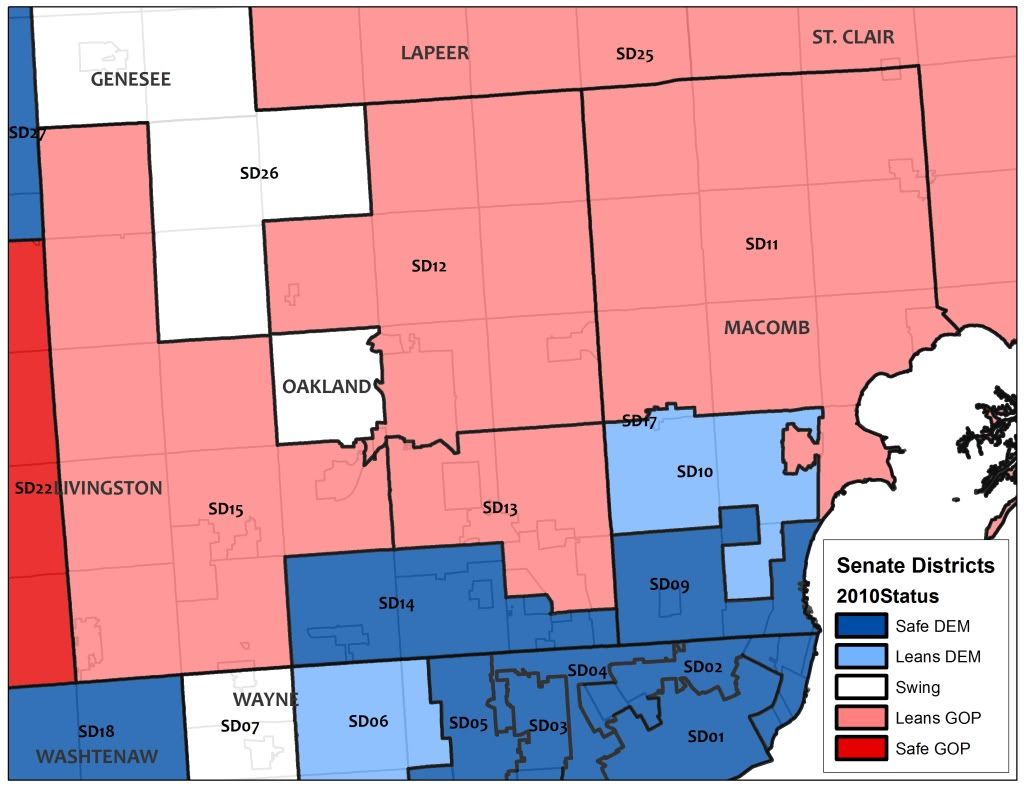
Map 3: The Thumb/Macomb County
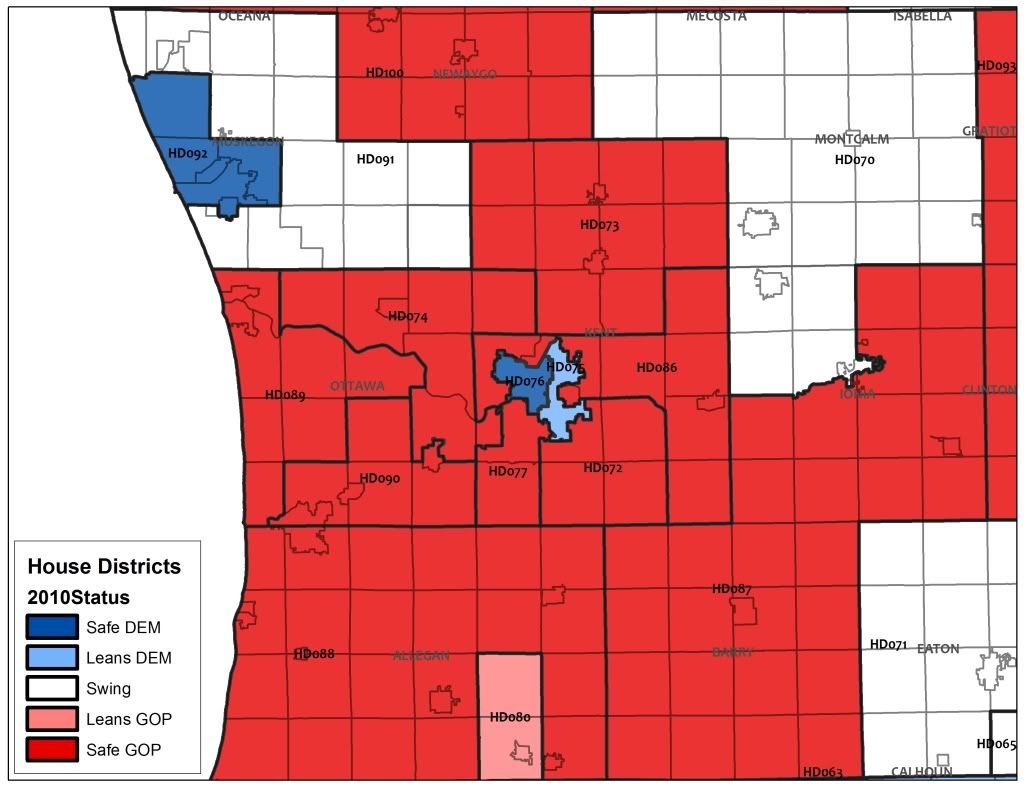
http://lh5.ggpht.com/_IM4e5b7O…
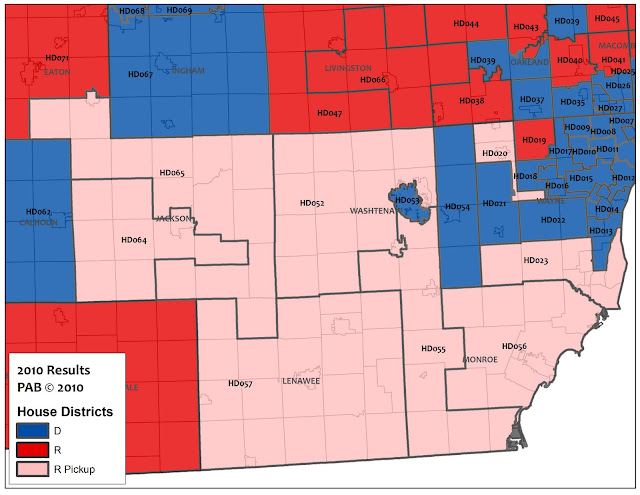
Map 4: Downriver and Eastern Michigan
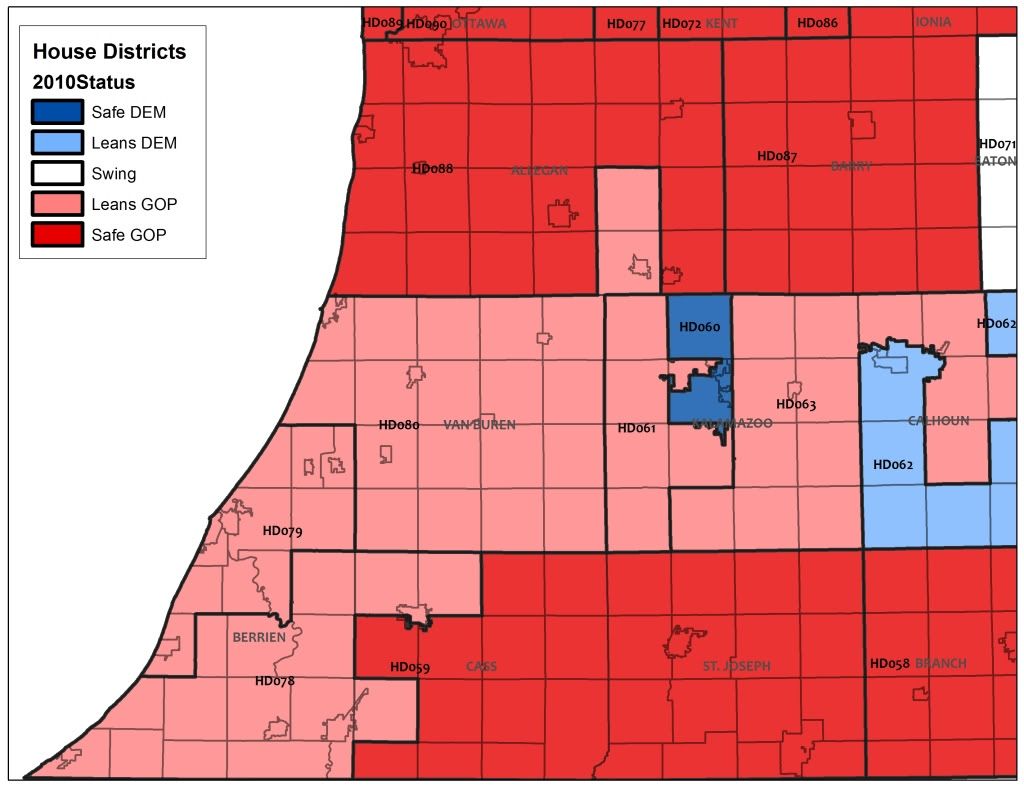
http://lh3.ggpht.com/_IM4e5b7O…
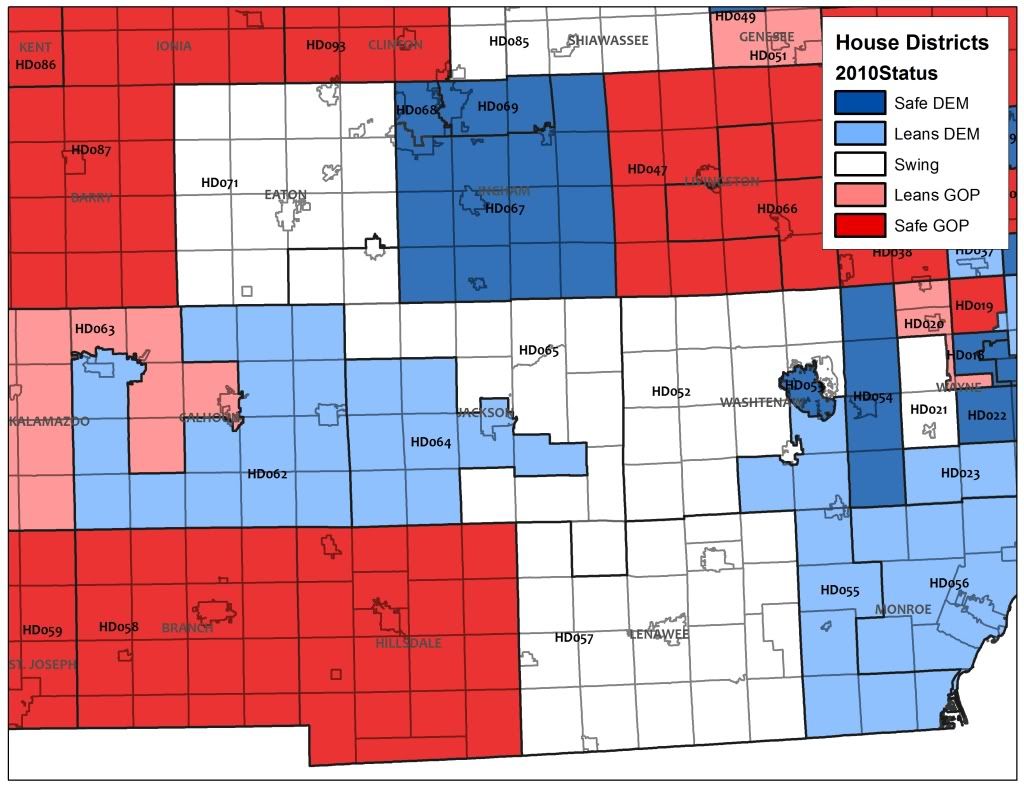
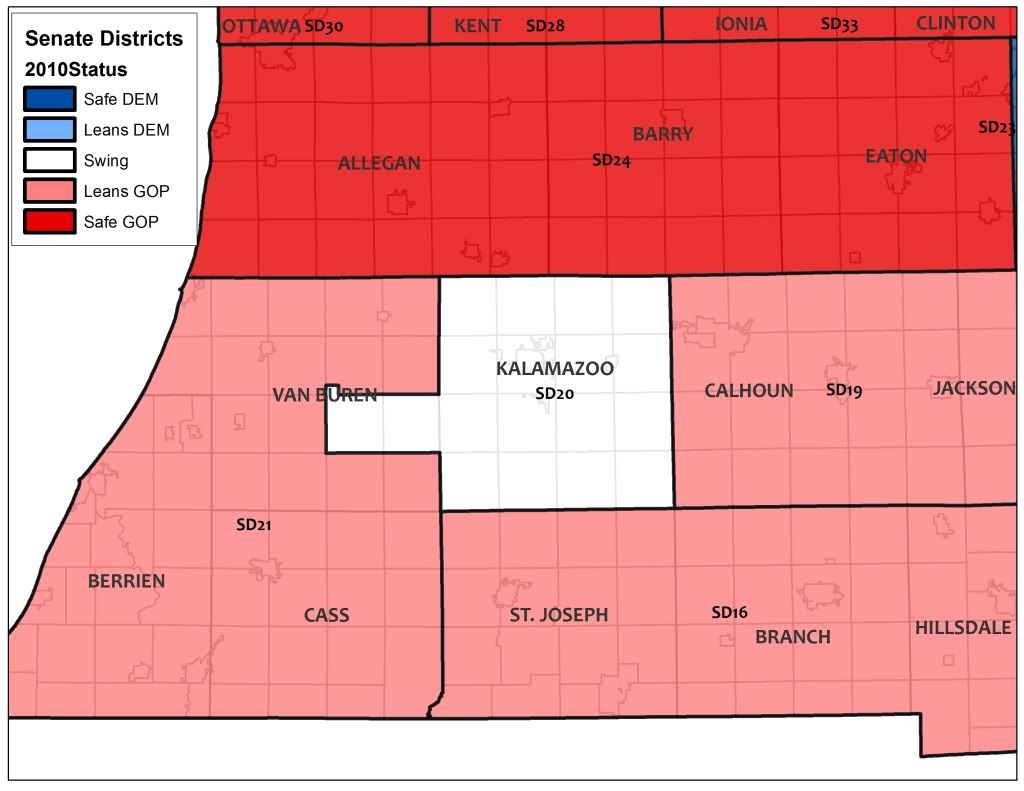
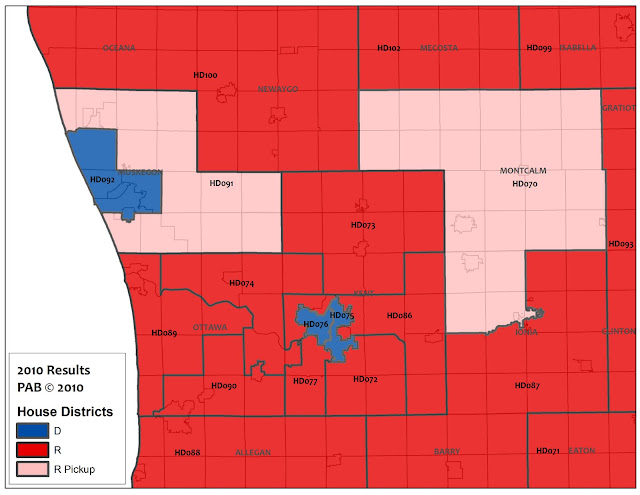
Map 5: Western Michigan
Democrats lost six districts in Northern Michigan, two in West Michigan, eight seats in the downriver/rural eastern Michigan, two seats in the Thumb, and two in Macomb County. The loss of seats on a regional basis is significant to explaining the GOP’s success in 2010. The Upper Peninsula has long been a Democratic stronghold, although the Democratic Baseline (which is the average Democratic share of the vote cast for State Board of Education races) for the districts in northern Michigan (101, 103, 106, and 107) are much more Republican-leaning. The decline of the Democratic brand over the past two years is due in part to the retirement of Bart Stupak, who had long provided a strong conservative Democratic presence on the top of the ticket for Democratic voters in the north, and also the antipathy of voters to the first two years of the Obama Administration. This suspicion of the Obama Administration has cultural and economic roots, but is also due to the steady drumbeat of the GOP noise machine that has played on the fear and malaise of many voters.
The six seats lost in West Michigan, Macomb County, and the Thumb are swing (Districts 24, 32, and 91) or Republican leaning Districts (Districts 70, 83, 84). However, the eight seats lost in Monroe, Jackson, Lenawee, Washtenaw, and Wayne Counties are in many was due to Rick Snyder being on the top of the Republican ticket. Snyder almost carried his home county (Washtenaw), a county that Democratic candidates generally carry by a two to one margin. The fact that Snyder almost carried this county doomed the Democratic State House candidates in the two Washtenaw County districts (52nd and 55th). Similarly, Jackson, Lenawee, and Monroe Counties, which have generally had a slight Democratic lean over the past four election cycles, swung decisively towards the Republican column, costing Democrats four seats. In Wayne County, Democratic incumbent Deb Kennedy was caught napping in the 23rd District, while Republicans picked up the 19th State House seat, which has historically been a Republican seat.
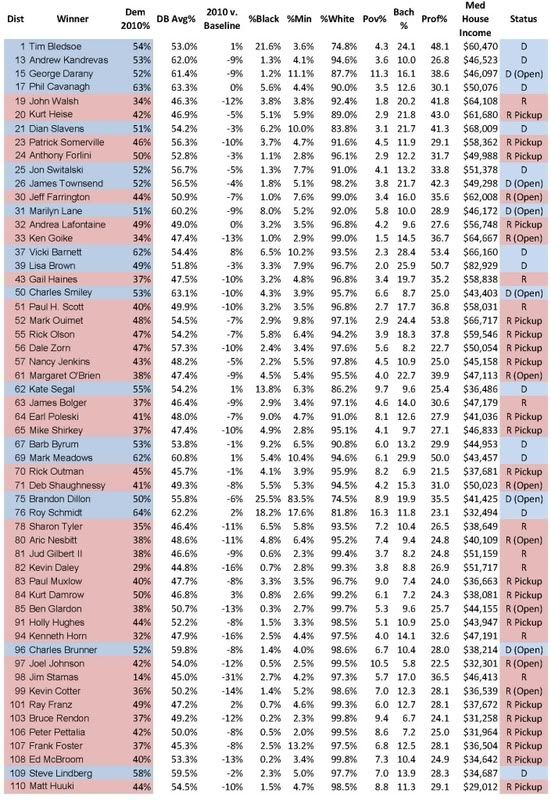
Thus regionalism partly explains the 2010 results. Table 2 below attempts to explain the results based on demographic and economic statistical data for each seat. I pulled data on any race that was 1) a Republican pickup, 2) where the winning candidate won with less than 55% of the vote, or 3) was identified as a Weak Republican, Weak Democratic or Swing seat in my previous analysis. The categories in Table 2 are pretty self-explanatory, although a few deserve further explanation. Dem 2010% is the percentage received the Democratic State House candidate in 2010, while DB Avg% is the Democratic Baseline average from the 2004, 2006, and 2008 elections. %Black, %Min, %White is based on ethnic data from the 2000 Census, as is Pov% (poverty rate), Bach% (percentage of residents who hold a Bachelor’s Degree), Prof% (percentage of residents who work in professional sector), and Med House Income (Median Household Income). While this data is ten years old, it serves as a reference point for analyzing the data. Once the 2010 Census data is released next month, I’ll try to update some of this information.
In the 55 races, Democrats won 18 seats in 2010 (or 37%). In comparison, after the 2008 election they held 38 seats (69%). Some Democratic incumbents who won in 2010 performed slightly better than the 2004-08 Democratic baseline average, and only two Democratic incumbents (Terry Brown in the 84th and Dan Scripps in the 101st) who ran better than the baseline lost. Every other Democratic candidate (incumbent or challenger) performed worse than the baseline.
http://i303.photobucket.com/al…
Table 2: District Analysis
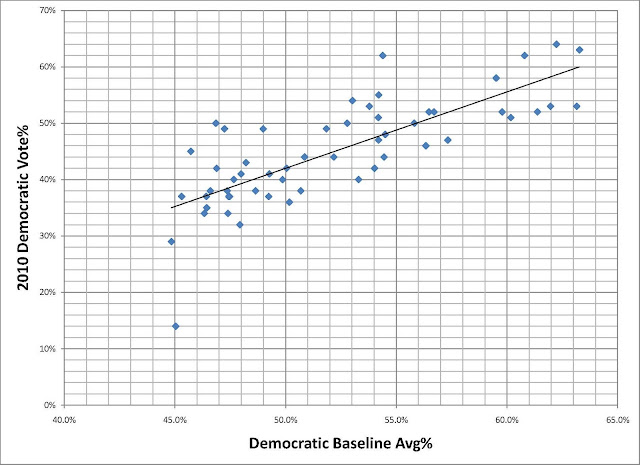
Is there a silver bullet from the data that explains the Democratic disaster in these 55 districts? Besides the fact that Republican incumbents were invulnerable, and that every open GOP seat was held, a few trends appear when you do some preliminary regression analysis. With correlation coefficient.78, the 2004-2008 Democratic baseline average is the strongest predictor of Democratic State House performance in 2010. Which, in my opinion, is not all too surprising.
http://lh6.ggpht.com/_IM4e5b7O…
Table 3: Baseline Regression
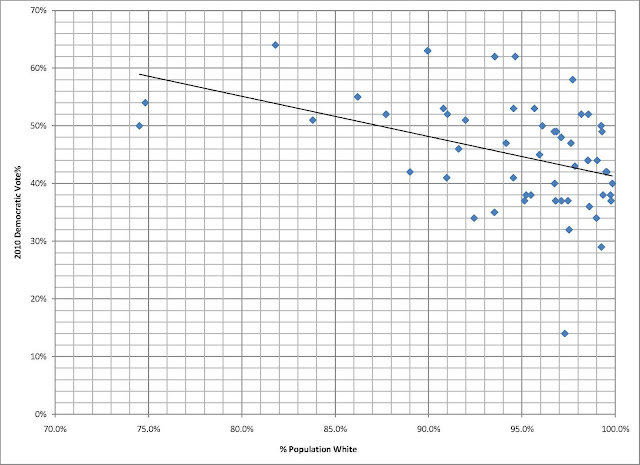
The other variables have a much weaker predictive value and are not statistically significant. The only other significant variable is race, and there is a -.42 correlation coefficient with the white population percentage, which has a t score of 3.369. Essentially, Democrats won any district where the white percentage of the population was under 90%. Personally, I think that the financial data, which should be available relatively soon from the Michigan Campaign Finance Network, will also show that a large financial edge for the winner will be statistically significant.
http://lh3.ggpht.com/_IM4e5b7O…
Table 4: White% Regression
Finally, how does redistricting explain regionalism and statistics? In 2001 the Republican Party controlled all three parties in the redistricting equation (the State House, Senate, and Michigan Supreme Court). The map drawn for the State House sought to maximize the Republican gains in the 2000 election, and as a result the number of seats controlled by the GOP increased from 58 in 2000 to 61 in 2002. However, the map cut too close to the margins, and Democratic wave years in 2006 and 2008 resulted in the GOP caucus being reduced to 52 and 43 seats, respectively. Perhaps a wiser map would treat 2010 as an aberration, and a new map would seek to draw 56 to 58 safe Republican seats. Given that there are 63 members of the Republican House caucus, I suspect that every incumbent will want a seat that protects his or her interests. For the Democrats looking for a strategy in 2012, I’d look really hard at trying to knock off the GOP in metropolitan Detroit (Districts 23, 24, 52, 55, and 56) as well as reclaiming districts 108 and 110 in the Upper Peninsula and Districts 101 and 103 in Northern Michigan. This would bring the party back to a narrow majority. However, given that a new map will be created in late 2011, closer targeting will need to wait until then.