This is the fourth in a series of diaries epicting the Democratic victory in this year’s midterm elections. Other diaries in this series can be seen here.
Already covered have been New England, NY, NJ, MD, and DE.
Today’s diary will focus on the Keystone state, the site of great hopes, and as today’s diary will demonstrate a great truth. Pennsylvania really is Philadelphia and Pittsburgh with Alabama in between. First up are the seat control charts.
2004
2006
Of 3,938,341 votes cast in 2006 US House races in Pennsylvania, 2,190,947 (55.6%) were cast for Democrats, while 1,698,641
(43.1%) were cast for Republicans.
Democrats defeated Republican incumbents in the PA-04,PA-07, PA-08, and PA-10.
The race I enjoyed the most was the PA-10 (NE Pennsylvania), where poltical newcomer (and politcal scientist) Christopher Carney defeated incumbent Republican Don Sherwood by margin of 12,538 votes (6.1%). The reason I am so excited by this race is because the Democratic party didn’t even run a candidate against Republicans anywhere can be taken down, we just need someone there to push.
In the PA-07 (SW Philadelphia suburbs), Democrat Joes Sestak defeated ethically challenged Republican incumbent Curt Weldon by a margin of 33,291 votes (12.7%) after revelations of suspicious dealings with Russian “businessmen”. Coming in at 56.4%, this was a 16 point improvement of the 2004 Democratic performance at 40.3%.
In the PA-08 (Bucks County, NE of Philadelphia), Democrat Patrick Murphy defeated Republican incumbent Michael Fitzgerald by a narrow margin of 1521 votes (0.6%). Coming in at 50.3% this was a 7 point improvement over the 2004 performace at 43.3%.
In PA-04 (NW of Pittsburgh), Democrat Jason Altmire defated Republican incument Melissa Hart by a margin of 9,280 votes (3.9%). Coming in at 51.9% this was a 16 point improvement over the 2004 performace at 35.9%.
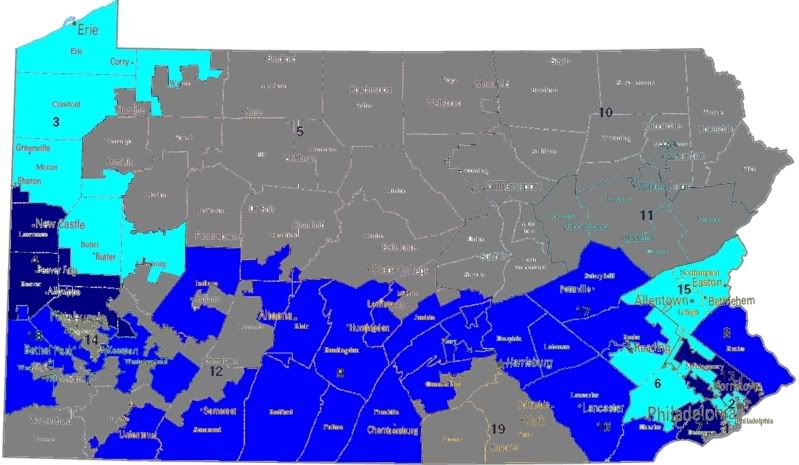
The following map shows Democratic gains over their 2004 Democratic performance in the district (in % terms), improvements of less than 5% will be displayed in light blue, under 10% in the darker blue, and over 10% in the darkest blue. Republican gains will be shown in the same manner, with the light red signifying a gain of less than 5% and so on. Races that were contested in eith of the years will be displayed in gray.
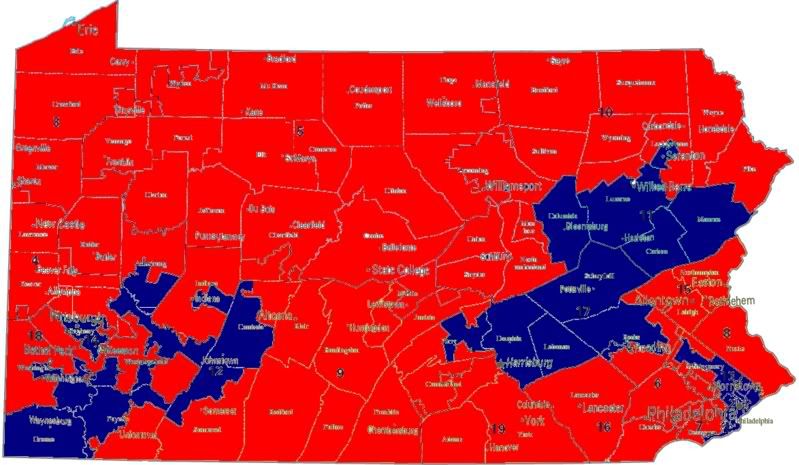
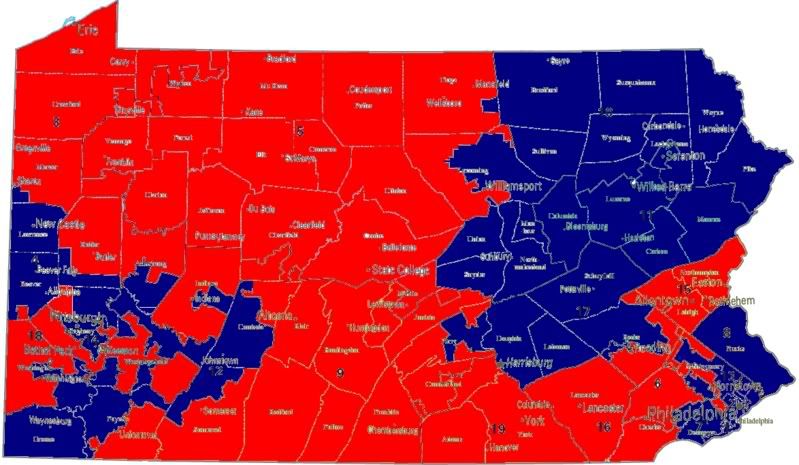
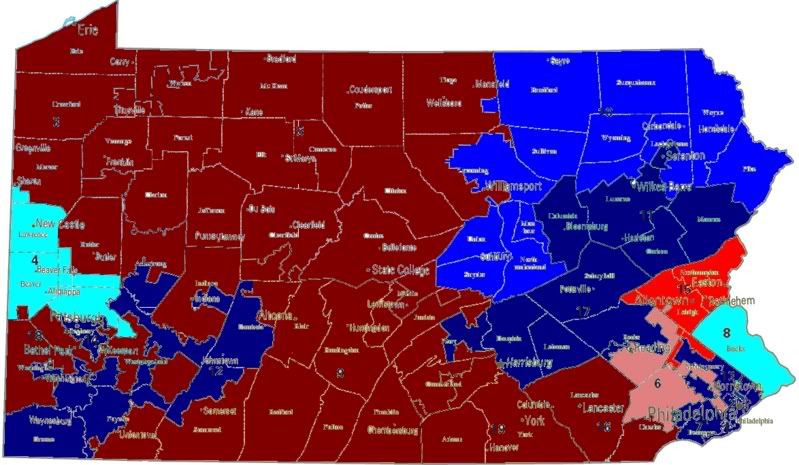
Looking more closely at the margin of victory in 2006 races, Democratic defends and pickup opportunities emerge, the following map displays the margin of victory in 2006 races. The deepest blue represents and Democratic margin of victory over 10%, the medium color represent more than 5%, while the lightest blue indicates that the Democratic candidate won by less than 5%. Corresponding measures of Republican victory margins display progressively darker shades of red at the same intervals.
Wow. Pennsylvania really is Philadephia and Pittsburgh with Alabama in between. A really interesting take on this is would be to be to compare the margins from the US House races to the Senate race where Casey crushed Santorum. Nonetheless for House Democrats the situation in the interior of the state looks hopeless, though as the race in the PA-10 shows anything is possible. I’m still puzzled by that one, I hope one of you Philly folks can explain what the hell happened there to me.
What emerges is a map to guide our 2008 strategy. In this series I have created a race tier system that is I will explain in the next few sentences.Tier 0 races are those where the Democratic candidate won by a margin of less than 5%, the presumption being that incumbency grants an advantage of 5-10% that with the fundraising advantage that comes with holding office should be sufficient for these candidates to defend their seats without funding from the party. The assumption that incumbency gives a 5-10% advantage drives the classification of the pickup categories. Tier 1 races are those where the incumbent won by less than 5% in 2006, while tier 2 races are those where Republicans won by less than 10%. It’s really quite simple.
Tier 0
Race D% R% Margin 2006 D Cand.
PA-04 51.9 48.1 3.9 Jason Altmire
PA-08 50.3 49.7 0.6 Patrick MurphyTier 1
Race D% R% Margin 2006 D Cand.
PA-06 49.4 50.6 1.3 Jim Gerlach
Tier 2
Race D% R% Margin 2006 D Cand.
PA-15 44.1 52.8 8.7 Charles Dertinger
I’ve created chart below to keep a running total of races that I’ve classifed in each tier for 2008.
Tier 0
CT-02, NY-19, NH-1
Tier 1
CT-04, NJ-07, NY-25, NY-26, NY-29, PA-06,
Tier 2
No races meet the criteria for this tier.
States Covered
CT, MA, MD,ME, NH, NJ, NY, PA, RI, VT
the Alabama bit isn’t meant as an insult to you guys.
an intelligence analyst for the CIA and the military, not a political scientist. That’s why he was such an appealing candidate. Don Sherwood lost the evangelical vote because the 50 something year own man cheated on his wife of thirty years with a twenty something year old political activist, who says he got angry in an argument and choked. He settled with her for over a million dollars. That’s what made this race impossible to win, and it’s amazing Carney didn’t win by a larger margin.
was won by Kerry. Thisjust shows the importance of contesting every district. He was unoposed until a Democrat managed to slip in through a write in primary campaign. This democrat was invisible, and raised no money, yet got 43% of vote. Imagine if a well funded state legislator has had the guts to run. This’d be our seat now.
Gerlach won becuase Murphy ran one of the most god-awful and disapointing campaigns I ever saw. I feel sorry for all the wasted democratic money here. She ran ads that were horrible beyond description, like one where’s staring at her crotch, supposedly looking at the bottom half of the screen which is flashing the issues in washington, and she says’ in oder to change things down their, we have to bring change here first.” I warned, several times, that Gerlach was a savvy campaigner, with a strong, loyal base in a huge portion of this district, which was too moderate and evenly divided for murphy to be a shoe in, (highly republican Exurban Chester County). I warned that Murphy was taking this race for granted, and couldn’t do so, even in this highly Democratic year.
Another reason she lost is that her key issue is abortion, she’s a pro-abortion nut, she worked as lawyer for Planned Parenthood, and worked her butt off to destory even the smallest restriction on abortion. As a pro-life Democrat, I may be biased on that, but my reading on her record made me see her in that light.
Why is that a problem in this district? It’s mostly pro-life strongholds that’s why. Exurbn Chester County, which is entirely in this district is Republican, and heavily pro-life. Berks County is rural/exurban, but historically Democratic leaning. It used to be the anchor of Tim Holdens district, but Republicans mauled his district in an attempt to make sure Gekas won without trouble, in an attempt to make Holden so discouraged at his possibility of winning that he would just retire. It’s a pro-life, but populist area. Murphy has lost this race both times because she lost Berks County. You see, Chester county, though it isn’t as large a portion of the district as the part of Montgomery county it contains, provides such huge margins for republicans that it cancels out the heavily Democratic, (but nowhere near as Democratic as chester county is Republican), Montgomery County. Murphy has focused all her campaigns on heavily pro-choice mongomery county, both times. She’s hasn’t given a damn about the other poritons of the district, and that’s why she lost. She didn’t grsp the geographical impossibility of winning with only montgomery behind her. Her miliantly pro-choice positions have driven off Berks county Democrats for the second election in the row. Berks county narrowly voted for Kerry over economic issues, but against her twice now. As far as pro-kerry districts go, this is one of the most pro-life districts that kerry won, and he won due to an enormous turnout and margin that Montgomery gave him, and a very narrow margin in Berks.