This is the fifth in a series of diaries depicting the Democratic victory in this year’s midterm elections.
Already covered have been New England, NY, NJ/MD/DE, and Pennsylvania.
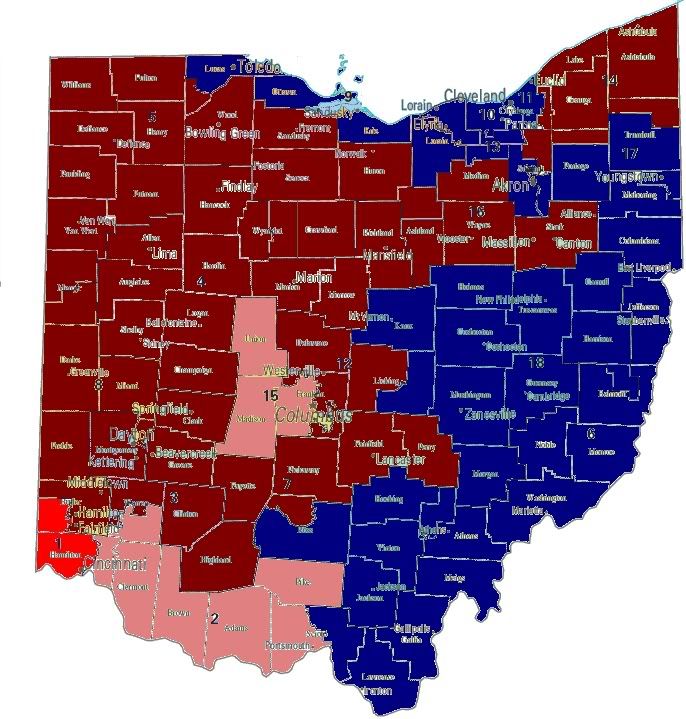
Today’s diary will focus on the Buckeye state, where we find that there must be something in the water, any water. We know that the coasts lean blue, but this is also increasingly true of Ohio River Valley.First up are the seat control charts, and yes grey means that the race is still in dispute not that some third party won.
Of 3,757,640 votes cast in 2006 US House races in Ohio, 1,970,127 (52.4%) were cast for Democrats, while 1,779,461 (47.4%) were cast for Republicans. While the only certified Democratic pickup is in the OH-18, two other races the OH-15 and OH-02 are both still in dispute, Democrats now hold 7 (38.9%) of Ohio’s 18 Congressional districts.
While it is neccessary to remember that seats are apportioned according to population not voter registration, and that differing turnouts mean that state totals weigh some districts more heavily than others because of these differences the degree of gerrymandering is apparent in the disparity between vote totals and the party control of seats. The problem is that the composition of Ohio’s House of Representatives delegation isn’t very representative of the voting intentions.
If Ohio’s House delegation were apportioned by proportional representation, Democrats would control 9 of Ohio’s 18 House seats. Dependent on the outcome of recounts in the OH-15 and OH-02, this may still come to pass. I’d like to point out something I found highly disturbing when researching this diary. On the election results page of the Ohio Secretary of State page, provisional ballot totals and percentages of provisional counted as valid are given for 2004, while the 2006 results give an aggregate figure for provisionals and absentee ballots.
I find this highly suspicous, and this technicality has the stink of bullshit upon it, because it could serve to obscure the true quantity of provisionals ballots in the two contested districts. And this could serve to obscure evidence of voter suppression in the application of Ohio’s new voter ID law. The Secretary of State’s office needs to release disaggregated figures listing the number of provisional ballots seperate from absentee ballots.
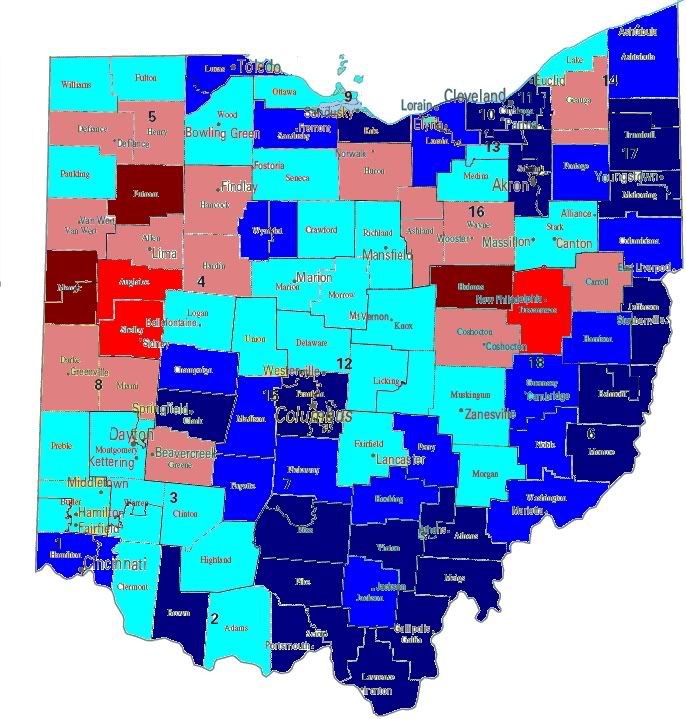
Voter Turnout by County, Ohio 2006 General
The darkest shade of red indicates a turnout of less than 40%, medium red 40-45%, pink 45-50%, light blue 50-55%, medium blue 55-60%, dark blue more than 60%.
Looking at our only confirmed victory, the OH-18, we can see a general trend, areas with the highest turnout (the Toledo area and SE Ohio) tend to be the areas where Democrats won, while lowest turnout was reported in the Cincinnati area where Republicans narrowly won. The Democratic victory in the OH-18 by Democrat Zack Space represents a real blow to Republicans. In 2006, Space took 62% of the district vote for a 23.9% margin over Republican Joy Padgett. This represents a 28.1% improvement the 33.9% 2004 Democratic vote share. This is Bob Ney’s old seat, this is what happens when the incumbent congressman is serving prison time. This is what a wave looks like. Bye-bye Republicans.
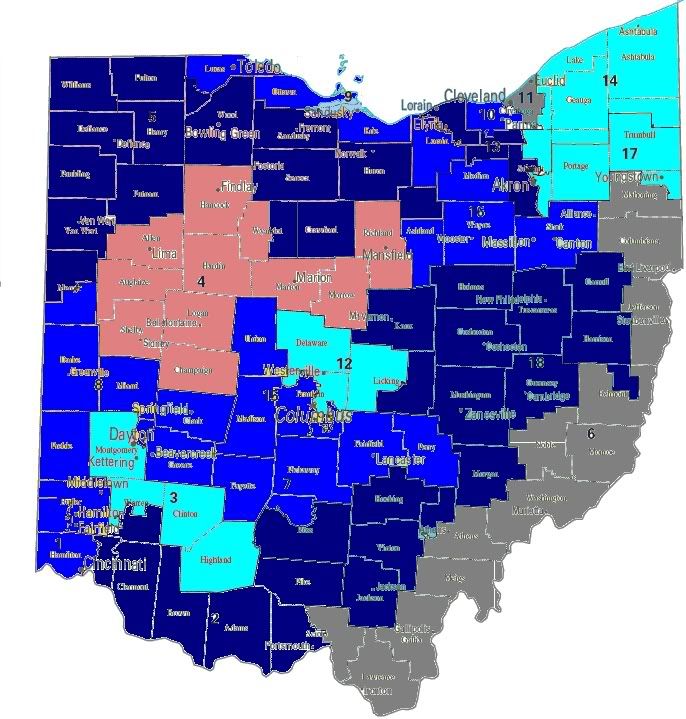
The following map shows Democratic 2006 gains over their 2004 Democratic performance in the district (in % terms), improvements of less than 5% will be displayed in light blue, under 10% in the darker blue, and over 10% in the darkest blue. Republican gains will be shown in the same manner, with the light red signifying a gain of less than 5% and so on. Races that were not contested in either of the years will be displayed in gray.
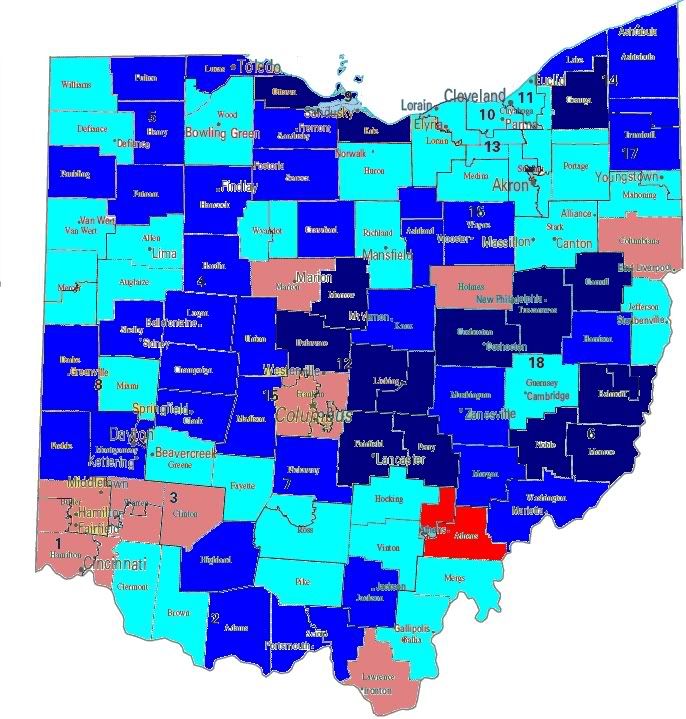
Looking more closely at the margin of victory in 2006 races, Democratic defends and pickup opportunities emerge, the following map displays the margin of victory in 2006 races. The deepest blue represents and Democratic margin of victory over 10%, the medium color represent more than 5%, while the lightest blue indicates that the Democratic candidate won by less than 5%. Corresponding measures of Republican victory margins display progressively darker shades of red at the same intervals.
What emerges is a map to guide our 2008 strategy. In this series I have created a race tier system that is I will explain in the next few sentences.Tier 0 races are those where the Democratic candidate won by a margin of less than 5%, the presumption being that incumbency grants an advantage of 5-10% that with the fundraising advantage that comes with holding office should be sufficient for these candidates to defend their seats without funding from the party. The assumption that incumbency gives a 5-10% advantage drives the classification of the pickup categories. Tier 1 races are those where the incumbent won by less than 5% in 2006, while tier 2 races are those where Republicans won by less than 10%. It’s really quite simple.
Tier 0
Race D% R% Margin 2006 D Cand.
No races meet the criteria for this tier.
Tier 1
Race D% R% Margin 2006 D Cand.
OH-2 49.4 50.6 1.3 Victoria Wulsin
OH-15 49.1 50.9 1.8 Mary Jo Kilroy
Tier 2
Race D% R% Margin 2006 D Cand.
OH-01 47.2 52.8 5.6 John Cranley
One final thing that I’d like to point out before we head to the running totals for 2008 tiers is the result of Ohio’s minimum wage ballot measure. Of 3,607,184 votes cast, 2,025,997 (56.2%) voted for the measure, while 1,581,187 (43.8%) voted against the measure. Overall, support was strongest where Democrats won in the Ohio River Valley and on the Lake Erie coast. The yes vote was the highest in Lawrence county in SE Ohio where 71.2% voted yes, and lowest in central Ohio’s Holmes county where only 31.2% voted for the minimum wage measure.
I’ve created chart below to keep a running total of races that I’ve classifed in each tier for 2008.
Tier 0
CT-02, NY-19, NH-1
Tier 1
CT-04, NJ-07, NY-25, NY-26, NY-29, OH-2, OH-15, PA-06,
Tier 2
OH-01, PA-15
States Covered
CT, MA, MD,ME, NH, NJ, NY, OH,PA, RI, VT
getting the diaries I didn’t post here but did at Kos and MYDD up. As a rule, to not be totally irritating, I’m allowing at least one diary to be posted between the ones I post up.
I don’t want to be a diary hog.
Wahlberg’s district, he almost lost to an ultra-liberal unknown, who refused to raise money for her campaign. Democratic Senate Minority would easily beat him in this moderate district, assuming who could survive a brutal primary. This would the Randy Graf of 2008. NC-08, Hayes district would also be easy if we getr a Democratic state senator to run