Continuing from yesterday’s diary here , I’m going to try to meet some of the requests
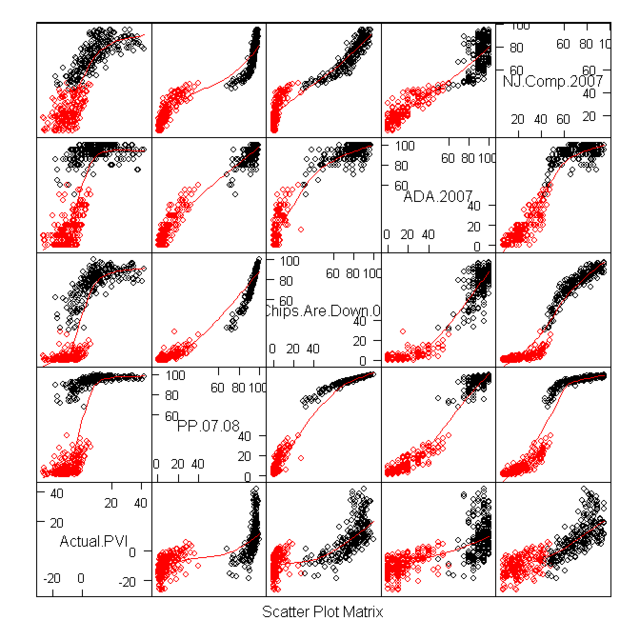
People were interested in the various measures, and how they related. Here is what’s known as a scatterplot matrix of the various measures:
Each little panel is a scatterplot, consisting of the variable listed in the row, and the column. All are highly correlated, all show that Republicans are lousy. But they are different in interesting ways: The PP Chips are down scale shows a lot of variation within the Democratic part, and little within the Republican. Let’s take a closer look:

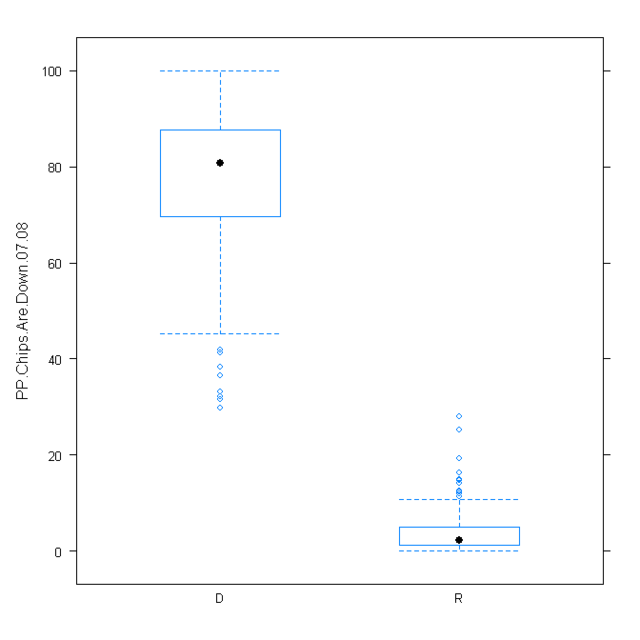
that’s a boxplot of the chips are down scores, by party, and my guess was right: There’s a lot of spread among the Democrats. Fortunately, there are no outliers at the top – that means that a lot of Democrats get 100 on this measure. But unfortunately, quite a few get fairly low scores: A quarter or so get under about 70, and more than 10 get under 50. (Note, though, that the lowest Democratic score is about where the highest Republican score is).
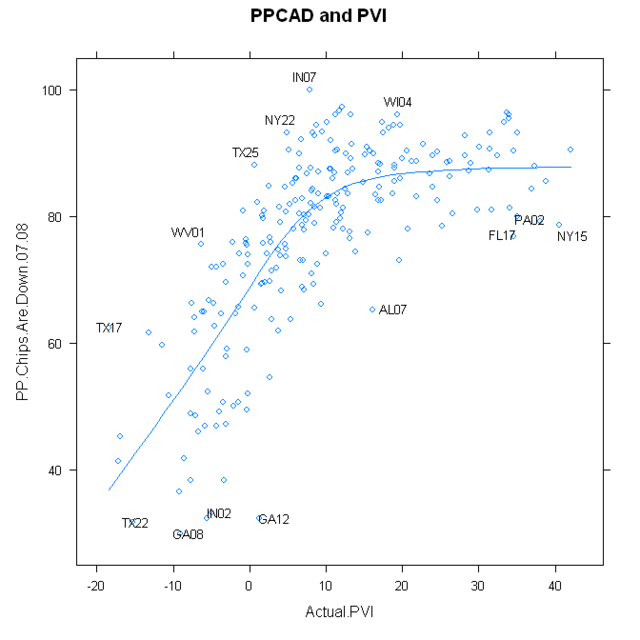
So, that PPCAD might be a good measure to use. Let’s see how it relates to Cook PVI, among Democrats:
Again, there’s a ceiling effect: You can’t have a PPCAD score over 100. But, given that, I’ve identified some of the best and worst.
Other people were interested in Republicans who were too conservative for their districts. Here, we want a measure that shows good spread among the Republicans. Two stand out: ADA rating and NJ rating. Since we’ve used NJ rating before, let’s do it again. Among Republicans, region made very little difference, so using just PVI is okay.
Here are the 17 Republicans who are 15 or more points more conservative than the model predicts
Here are the ones who are more than 12.5 points too conservative
District Actual.PVI Rep. NJ.Comp.2007
10 AZ02 -9.3076 R (Franks) 6.7
11 AZ03 -6.5867 R (Shadegg) 6.7
44 CA24 -5.3747 R (Gallegly) 14.0
77 CO04 -8.8633 R (Musgrave) 11.0
93 FL07 -4.8761 R (Mica) 8.3
98 FL12 -6.0349 R (Putnam) 12.3
110 FL24 -3.8316 R (Feeney) 12.0
161 IA05 -8.9516 R (King) 8.8
215 MN02 -3.3538 R (Kline) 9.3
219 MN06 -5.6477 R (Bachmann) 10.8
227 MO02 -9.4356 R (Akin) 10.0
248 NJ05 -5.0601 R (Garrett) 14.7
303 OH01 -1.2364 R (Chabot) 17.5
310 OH08 -13.0170 R (Boehner) 6.7
353 SC02 -9.4804 R (Wilson) 9.3
365 TN07 -12.3217 R (Blackburn) 8.0
This is fun! I get to do the analysis, and didn’t have to enter the data


Scott Garrett’s PP score of 3 and NJ score of 14.7 seems more worthy to be listed for an R+4 district than Ramstad’s 42.2 for an R+1. or Musgrave’s 11.0 for an R+9.
What’s up? (I got the Cook PVI numbers from Wikipedia using your district designations).
Garrett’s Progressive Punch score seems a lot worse than his National Journal score although part of that may be hpw much Republicans are packed in under 5 in the PP scale.
frame it and see if you can sell it.
a really fabulous analysis you guys have put together. I think the lesson that keeps getting reinforced graph after graph is that any Democrat is better than any Republican and it seems to me more Democrats will allow even those at the bottom to improve their scores as they can vote with the winners rather than with an upopular minority.