This is the first part of two posts analyzing Ukrainian elections. This first part will focus upon the 2004 presidential election, which showed a remarkable degree of regional polarization. The second part can be found here.
The 2004 Presidential Election, Version Ukraine
In the last months of 2004, Ukraine held a total of three elections. In the first round, candidates Viktor Yanukovych and Viktor Yushchenko received the greatest share of votes. The two then competed in what turned out to be a rigged run-off, with Mr. Yanukovych supposedly winning. After prolonged protests, cumulating in the Orange Revolution, another run-off was held. Pro-western candidate Viktor Yushchenko ended up as the victor of this fair run-off, beginning what would prove to be a troubled presidential term.
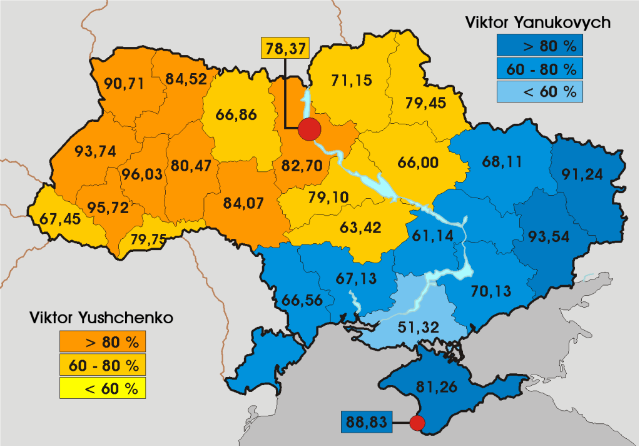
This post will analyze the third, and possibly the only unrigged, election. Here is a map of the results:
(Note: This map is taken from the site ElectoralGeography. It’s analysis of the 2004 Ukrainian election can be found here.)
More below.
In this third round, Mr. Yushchenko ended up with 51.2% of the vote, compared to the 44.2% support earned by his opponent (the rest voted “informal” or “against all”).
The first thing one notices is the overwhelming degree of polarization. It is almost as if Ukraine is two separate nations happening to inhabit the same name. In the western and central Ukraine, Mr. Yushchenko is a rock star; he wins greater than 60% of the vote in every single province. But in eastern Ukraine and the Black Sea coast, Mr. Yushchenko is deeply, deeply unpopular – winning less than 40% of the vote in all but one province.
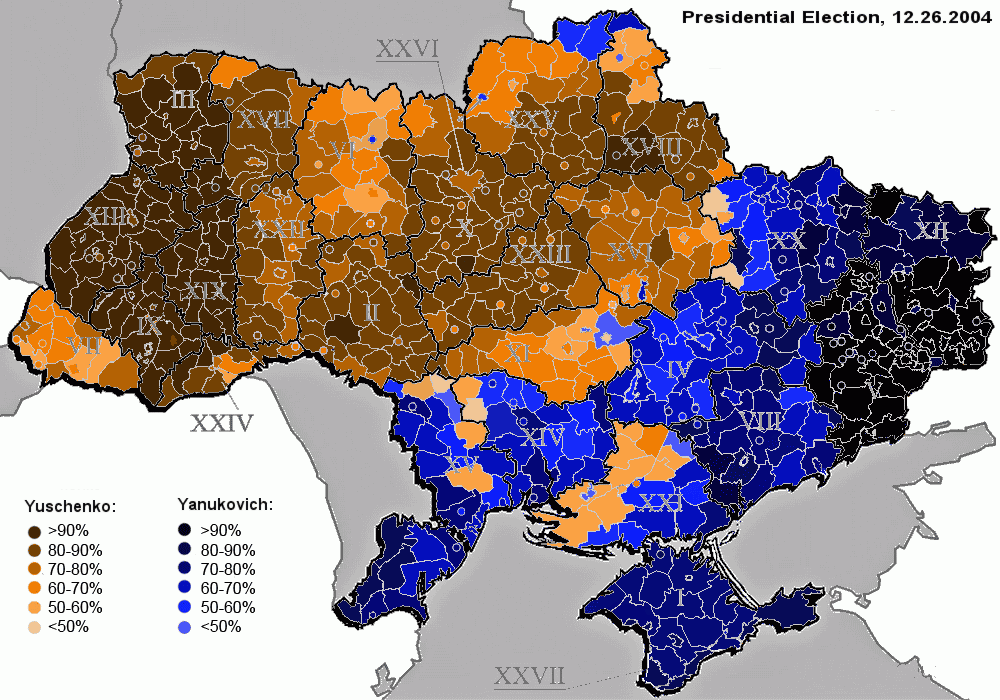
Indeed, there does not seem to be much of a middle ground. Mr. Yushchenko either wins by a landslide, or he loses by a landslide. He either gets more than 60% of the vote or less than 40%. This analysis still holds true as one looks at the results at a more detailed level:
(Image Courtesy of ElectoralGeography.)
The regional borders constitute an almost perfect dividing line between Yushchenko-land and Yanukovych-land. There is some lessening in polarization as one approaches the “border,” but not much. One often goes straight from 60+% Yushchenko support to 60+% Yanukovych support.
This phenomenon was not just unique to the 2004. In election after election, Ukraine is divided into two camps: the northwest votes pro-West; the southeast votes pro-Russian.
Here is the 2010 presidential election:
This map indicates Mr. Yanukovych’s support in the 2010 presidential election, by province. This time he won – in a fair election – claiming 49.0% of the vote to the 45.5% polled by his opponent Yulia Tymoshenko. Compared to 2004, polarization has gone slightly down; this time only four provinces gave more than 90% of the vote to one candidate, instead of six.
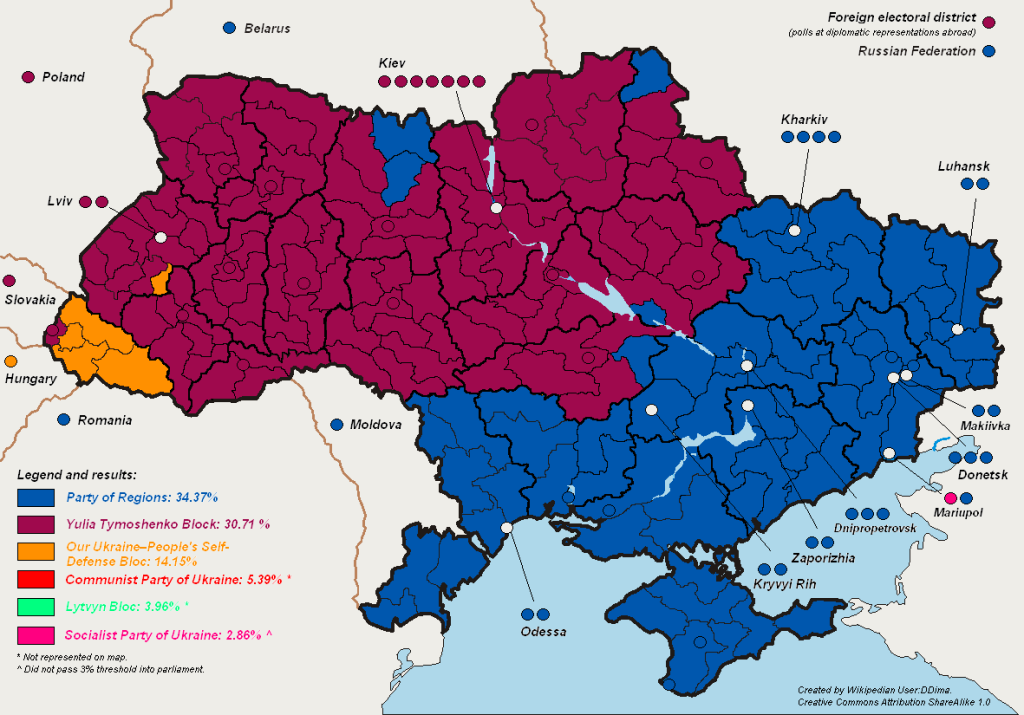
Or take the 2007 parliamentary elections:
Guess which part of Ukraine voted for Mr. Yanukovych’s party.
This type of regional polarization did not occur by chance or luck. Rather, Ukraine’s electoral divide has long-standing historical and linguistic roots. Modern Ukraine itself contains two almost separate identities, which elections simply happen to reflect. The next section will analyze how differences came into being.
–Inoljt, http://mypolitikal.com/


I do know that our site focuses on American elections, and I took that into consideration when posting this. However, I also think that we at swingstateproject can be interested in elections themselves and in other places. I know there were a few people who posted stuff on the U.K.’s election, and that was fairly well-received – so I thought something like this would be safe.
The vast majority of stuff that I do post will continue to be U.S.-centric.
If this post is somewhat not within the correct bounds, feel free to tell me.
I am all for posting of such things from time to time. Some of my academic work in undergrad focused on Canadian politics and I plan to post something if they go to the polls this fall.
In concern to Ukraine, they make us look like a big happy family politically.
It’s much more pro-Yanukovich than the rest of West Ukraine. Anyone here know why?
That was really interesting, and I love the maps.
I actually wrote a paper on this very topic for an Eastern Europe class last spring, but used a bit more statistical than what I see here, which I assume you’ll include in a later post. Interestingly, the correlation of a household that spoke Russian (e.g. the Southern and Eastern Oblasts) was .91 on a -1 to 1 scale.