The “Wyoming rule” is a proposal to make the standard congressional district size equal to the population of the smallest state’s population (currently Wyoming, with a population of 563,000). As this is lower than the current quota of 710,000, the number of seats in many states increases. A number of SSPers have posted hypothetical maps based on the Wyoming Rule.
As I promised in my previous diary, I will now proceed to turn the rule on its head. Instead, I will produce maps where the standard congressional district size is equal to that of the largest state (currently California, with a population of 37,000,000). As you will see, this results in some rather dramatic changes.
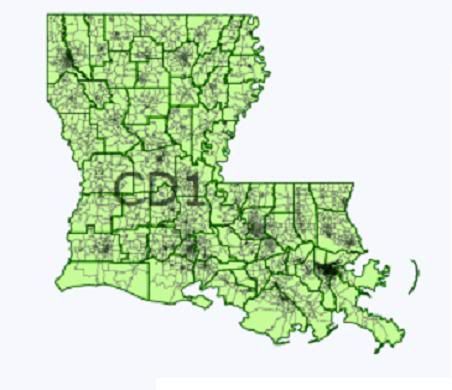
Louisiana
Population: 4,500,000
Previous Number of Districts (2010 census): 6
New Number of Districts: 1
District 1: Chartreuse
60% White, 32% Black, 4% Hispanic, 2% Asian, 1% Native American, 1% Other
Obama 40%, McCain 59%
No matter how hard I tried, I could not draw a majority black district in Louisiana. It initially looked promising when I expanded the current LA-02 to include parts of Baton Rouge. But it all fell apart when it turned out the district still wasn’t populous enough, requiring it to absorb majority white areas to the north, east, south and west. The resulting district is not even 1/3 black, so it will be a steep uphill climb for a Democrat nowadays.
Ratings:
District 1: Likely R
I’m not convinced that a New Orleans-based district can ever be completely out of reach for Democrats.
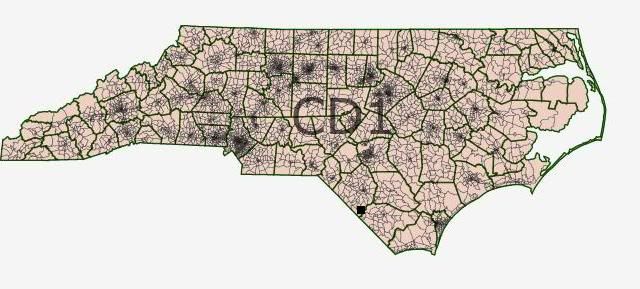
North Carolina
Population: 9,500,000
Previous Number of Districts (2010 census): 13
New Number of Districts: 1
District 1: Dark Salmon
65% White, 21% Black, 8% Hispanic, 2% Asian, 1% Native American, 2% Other
Obama 50%, McCain 49%
Republicans eager to make use of their newly established gerrymandering powers here will not be disappointed. This map does something I’ve never seen attempted before and mashes Butterfield, Price, McIntyre, Kissell, Shuler, Watt and Miller all into one district. And since the district also contains some new strongly Republican territory, it’s not even particularly likely that any one of them will win it.
The biggest downside for Republicans is that all the districts in the state are now Obama districts. Inevitably, some of you will berate this map as a “dummymander”, pointing out that “it could easily go all-Democratic in a good year”. I concede the possibility, however you should remember: North Carolina may have gone for Obama, but only barely. If we look at CPVI (in my opinion a more accurate indicator than Obama numbers) we’ll see the 1st district is a reasonably healthy R+4. Not safe by any means, yes, but not unnecessarily cautious either. Redistricting is all about trade-offs, and I think the risk/reward ratio for this map is appropriate.
Ratings:
District 1: Lean R
Shuler could win it, but I’m sceptical with so many new constituents unfamiliar with him.
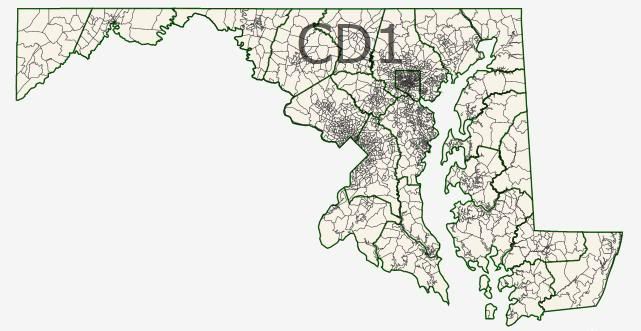
Maryland
Population: 5,700,000
Previous Number of Districts (2010 census): 8
New Number of Districts: 1
District 1: Papaya Whip
55% White, 29% Black, 8% Hispanic, 5% Asian, 0% Native American, 2% Other
Obama 62%, McCain 36%
One of the few Democratic opportunities to play offense, this map does an excellent job of eliminating both Bartlett and Harris. I have seen other maps that attempt this, but none manage to put both of them in a 62% Obama district. Unfortunately, the resulting map isn’t very compact, but that’s inevitable when you try to draw yourself an all-Democratic delegation.
For those hoping for a Frank Kratovil comeback, the map is a mixed blessing. On one hand, his district does increase to 62% Obama, up from 40% currently. On the other, the boundary changes necessary to achieve this happen to add the homes of six Democratic incumbents (including Minority Whop Steny Hoyer). Let this be a lesson to redistricters out there: just because you design a district with someone specifically in mind doesn’t mean that an ambitious young (or old) legislator won’t seize the opportunity to primary him.
Ratings:
District 1: Likely D
I know a lot of you will want to rate this “Safe D”. But consider that many rural Marylanders may resent all the districts being dominated by Baltimore, Prince George’s County and Montgomery County. That’s potential animosity that Obama numbers just won’t tell you.
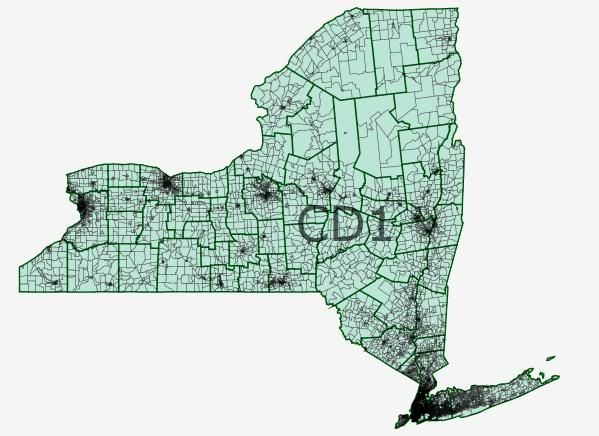
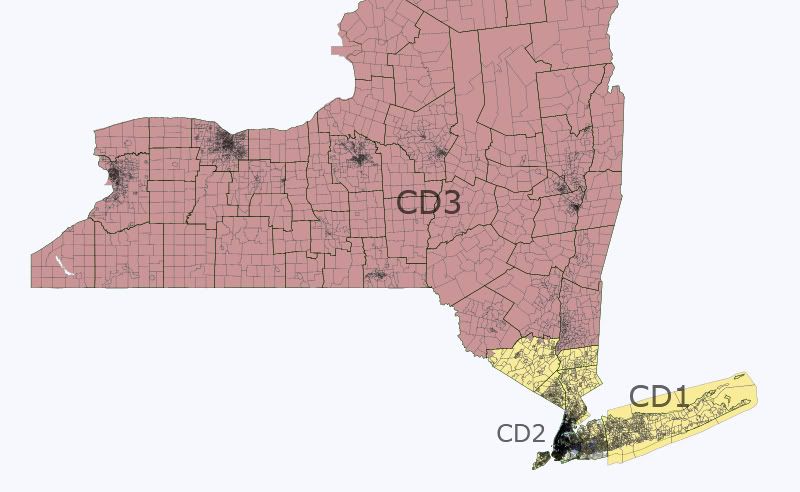
New York
Population: 19,000,000
Previous Number of Districts (2010 census): 27
New Number of Districts: 1
District 1: Medium Aquamarine
62% White, 15% Black, 15% Hispanic, 6% Asian, 0% Native American, 2% Other
Obama 63%, McCain 36%
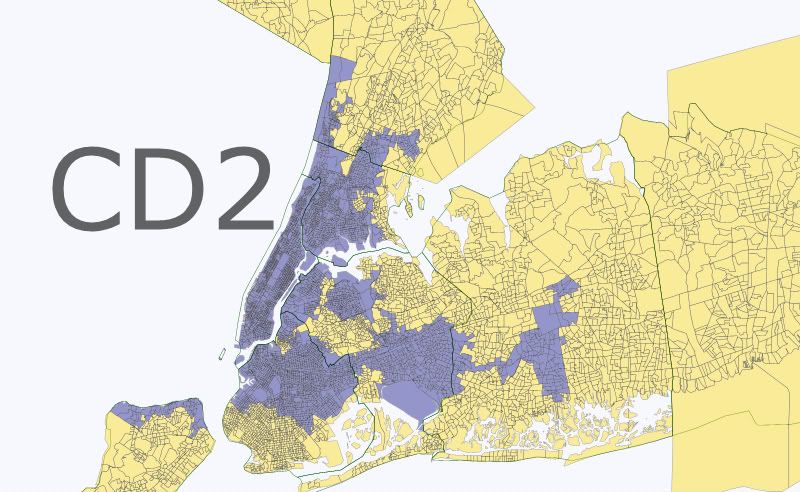
The philosophy for my map is simple: If you need to make a district more Democratic, you must go where the votes are: New York City. By attaching Republican-leaning Upstate areas to New York City through a long tendril, I was able to squeeze the most out of the city’s overpacked Democratic voters. I also think I did a pretty good job of screwing over Peter King. And as a bonus to ethics watchdogs among you, Charlie Rangel’s district has been transformed beyond recognition.
Ratings:
District 1: Safe D
If only I could have entered the redistricting contest with this map. I’m sure I would have won.
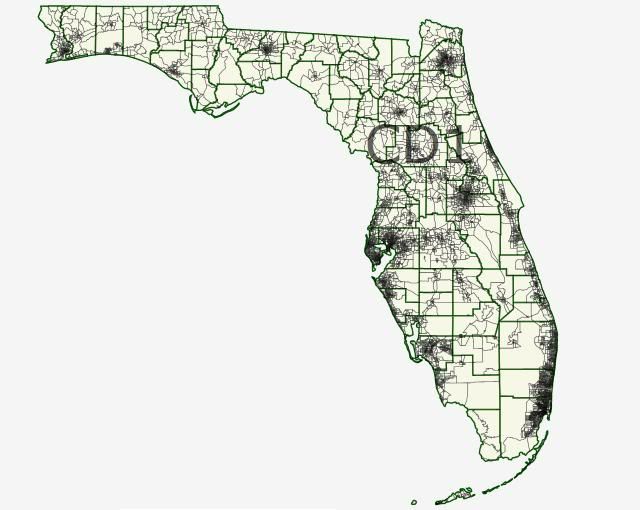
Florida
Population: 16,000,000
Previous Number of Districts (2010 census): 27
New Number of Districts: 1
District 1: Light Goldenrod Yellow
65% White, 14% Black, 17% Hispanic, 2% Asian, 0% Native American, 2% Other
Obama 51%, McCain 48%
In the wake of the new redistricting amendment, I decided to see what a “fair” map would look like under the California rule.
In my opinion, my map would pass judicial muster. There is no county-splitting, the boundaries do not clearly favour one party over the other and all areas in Florida have proportionate influence. The biggest problem is the complete disregard to communities of interest. I mean, Miami and the Panhandle together in the same district? Nonetheless, I do think this map is reasonably close to what a court would draw.
What about the political impact? Well, when you undo a gerrymander as severe as Florida’s, you’re bound to upset a lot of incumbents. Many incumbents will be forced to run in a district that consists of less than 4% of their previous territory. It is particularly bad for Republicans, as more of them than Democrats have been drawn into a fellow party member’s district. Perhaps this will motivate one or more Republican incumbents to run for the Senate instead of attempting to slog through a messy 19-way primary.
Ratings:
District 1: Tossup
Although it should be Tilt or Lean R, there is a significant risk of Allen West winning the Republican nomination with ~7% of the vote.
Conclusion
I would do more states, but these maps are awfully time consuming to make. Nonetheless, I think we can start to infer a few things about the effects of the California rule.
Firstly, it appears that all states (so far) only have enough population for one district. This surprised me – I expected the number of districts to decline, but not by this much. I only did five, so my current hypothesis is that I simply ran into some apportionment paradoxes.
Secondly, the rule allows for very effective gerrymandering. I have never before seen maps that allowed for so many incumbents to be forced into the same districts. For “good government” advocates, this is presumably a negative. But from a partisan perspective, there are plenty of opportunities for both parties to do some creative redrawing.
Thirdly, the rule results in districts that are mostly compact and aesthetically pleasing. While there are some notable exceptions, many of the current monstrosities of districts will no longer see the light of day under it.
Overall, I would tentantively advocate the adoption of the California rule. While the reduction in the number of districts has some troublesome implications, I think these are minor compared to the aesthetic benefits.
