As always, crossposted at BlueNC and DailyKos.
One of the most commonly asked questions about Brad Miller running for Senate against Elizabeth Dole is from people who dont think Brad Miller can win statewide.
How can I answer this question?
I could wax poetic about Brad’s abilities to appeal to voters statewide. Or I could tell you things about him that make me think that he can talk to rural voters and voters in a big city.
And then you could give me all the reasons you disagree. But where would that leave us?
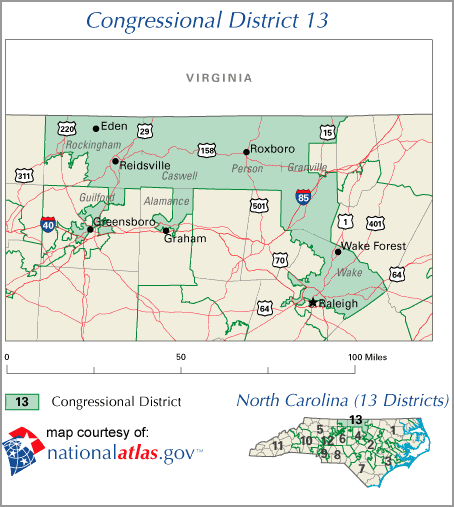
The only way I can think of objectively answering this is to offer an analysis of Brad’s past election results. For reference I have included a map of Brad’s district. This district was drawn for a Democrat to win, but it is only slightly Democratic. Cook has its PVI as D+2.

As you can see, NC-13 contains all of Caswell and Person counties. It also encompasses large portions of Granville and Rockingham counties. All 4 of these counties are rather rural, and Republican. Although the most Republican areas of the county are excluded from NC-13, they do not add up to many people. These 4 counties are especially important because their rural nature means they are very similar to other areas throughout the state that Brad must be competitive in to beat Dole.
To the numbers.
For this analysis, I looked at Brad’s results in these 4 counties in 2002 compared to the numbers from the Bowles v Dole race in 2002, and Brad’s results in 2004 compared to both Bowles and Kerry/Edwards.
2002
Granville County
Brad Miller 4,236
Carolyn Grant 3,759
Erskine Bowles 6,146
Elizabeth Dole 5,511
Person County
Brad Miller 5,054
Carolyn Grant 4,589
Erskine Bowles 4,444
Elizabeth Dole 5,873
Caswell County
Brad Miller 4,113
Carolyn Grant 2,320
Erskine Bowles 3,615
Elizabeth Dole 3,049
Rockingham County
Brad Miller 12,005
Carolyn Grant 9,965
Erskine Bowles 12,062
Elizabeth Dole 13,899
2004
Granville County
Brad Miller 7,184
Virginia Johnson 5,955
Erskine Bowles 9,806
Richard Burr 8,447
George Bush 9,491
John Kerry 9,057
Person County
Brad Miller 8,399
Virginia Johnson 6,291
Erskine Bowles 6,701
Richard Burr 8,212
George Bush 8,973
John Kerry 6,198
Caswell County
Brad Miller 5,737
Virginia Johnson 3,374
Erskine Bowles 4,737
Richard Burr 4,559
George Bush 4,868
John Kerry 4,539
Rockingham County
Brad Miller 16,580
Virginia Johnson 15,525
Erskine Bowles 15,435
Richard Burr 21,224
George Bush 22,840
John Kerry 14,430

So, what does that all mean?
Personally, I think the numbers speak for themselves. In these 4 counties, the combined vote totals for 2002 show Brad winning by about 4800 votes. Dole won those same counties by a little over 2000 votes. In 2004, Brad won these 4 counties by 6800 votes. Bowles lost them by 5800 and Kerry lost by almost 12,000 votes.
These are not tiny little swings. Brad won his race by about the same percentage as Dole beat Bowles. Yet, in these specific rural areas, he did even better Dole did. Obviously the differences between all of these races is rather large. Bowles v Dole garnered national attention, and was incredibly expensive. By comparison, Brad spent under a million dollars in 2002 with his opponent spending about 400,000 dollars.
These details about the nature of these races can explain a lot of this. However, to me these results show that Brad can win over rural voters. In fact, I wont just say that Sherrod Brown proved you can win a swing state while being proud about your progressive values. I will say that Brad himself has already proved that a progressive who doesnt hide from his record can win in rural North Carolina.
Now, I understand that many will not be convinced by these results. Some will say that Brad cant win votes in rural areas until November 4th. However, I hope that those that are unsure will find my collection of data convincing. If you do, please think about sending 5 dollars to the draft page on ActBlue.


