This is the second in a series of analysis of congressional districts.
Note that one should not use these analyses to make statements about individuals. That’s called the ecological fallacy, and it can lead you very far astray, very quickly.
Also, please ask questions. Don’t look at the graphs and equations and run away…..ask. There are no dumb questions*. I will *not tell you you are stupid for asking. Statistics is confusing to lots of people, not just you! So ASK!
Today, I started off by looking at median income and Cook PVI. That led to other things. More below the fold
(cross posted from DailyKos)
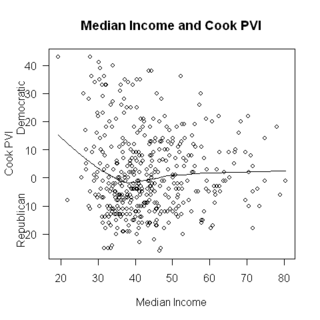
My suspicion, before looking at the relationship between median income and Cook PVI was that higher median income districts would be more Republican. I did know that some high income districts were quite Democratic, but I thought these were exceptions. Well, one reason to explore the data is to see whether your suspicions are correct. Here’s a graph of median income and Cook PVI across 435 districts:

My favorite professor in grad school used to say “If you’re not surprised, you haven’t learned anything”. I’m surprised, but what can we learn?
The very poorest districts are, indeed, very Democratic. At the extreme, the poorest district (NY16) is also the most Democratic (Cook PVI is D + 43). But above a median income of about 30,000, there is only a modest relationship, and, what there is points to wealthier districts being more Democratic….. hmmm.
When results surprise you in this way, one thing that may be going on is that there is some third variable that is affecting the relationship. I know that people in rural areas have different views than those in urban areas….
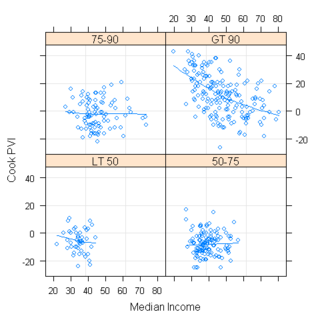
The language I used to draw these plots R offers a tool called conditioning plots, that lets you look at three variables in an interesting way. You divide the third variable into groups, and then plot the first two in each group. Easier to show than tell:

Each panel of the graph is congressional districts of a certain level of urban-ness. The lower left is less than 50% urban, lower right is 50-75%, upper left is 75-90% and upper right is over 90% urban. (Note, it is probably better to think of ‘urban’ as ‘urban or suburban’ or, perhaps ‘rural’). This is interesting!
First thing that strikes me is that there is almost no relationship between median income and Cook PVI except in the highly urban districts, where it is strong and in the expected direction: Higher median income = more Republican.
Next, we can see that more urban districts are, generally, more Democratic: All but one of the districts with Cook PVI over D+20 are over 90% urban.
Third, all the high income districts are mostly urban. Of districts with median income above $60,000 or so, none were mostly rural, and most were 90%+ Urban.
Graphs are good for exploration, now let’s look at a model. In specific, let’s look at several regression models, with the dependent variable being Cook PVI and the IVs being different combinations of urban and median income.
First, Cook PVI as a function of median income (I measured median income in thousands of dollars):
The resulting equation is:
CookPVI = 3.69 – .051*MedInc.
What this means is that the predicted PVI for a district with a median income of 0 is D+4, and that it declines by .05 for each thousand dollar increase in median income. This difference wasn’t significant, and the R^2 for this model was only 0.0001, meaning that almost none of the variation in CookPVI is accounted for by median income.
Second, Cook PVI as a function of %Urban
This gives:
CookPVI = -29.45 + 0.39*Urban
that is, when urban = 0, the predicted CookPVI is R + 29, and it gets more Democratic by 0.39 points for each percent increase in Urban. So, for a 50% urban district the predicted Cook value would be -29 + 50*.39 = R+9, and for a district that’s 100% urban, it would be D + 10.
R^2 here was 0.29 indicating that urban-ness accounted for 29% of the variation in Cook PVI
Finally, a model with both urban and median income:
Cook PVI = – 18.8 – 0.41*Median Income + 0.48*Urban
that is, for a district with median income = 0 and urban = 0, the predicted Cook PVI was R + 19, and this got more Republican by 0.41 units for each thousand dollar increase in median income, but got more Democratic by .48 units for each unit increase in Urban.
Both urban and median income were very significant, and this model had R^2 of 0.38.
I think another factor here would be region. In other words, rural New York probably has a more Democratic PVI than rural Ohio or rural Texas.
Which reminds me, I’m tired of seeing Alaska grouped with the other Pacific Coast states. Alaska seems much more like a Mountain West state – specifically, like Idaho, Montana, Wyoming, or Utah – than like a Left Coast state. Other than the fact that it touches the Pacific Ocean and that it can be expensive to live there, Alaska is geographically and politically more like the Mountainous Interior.