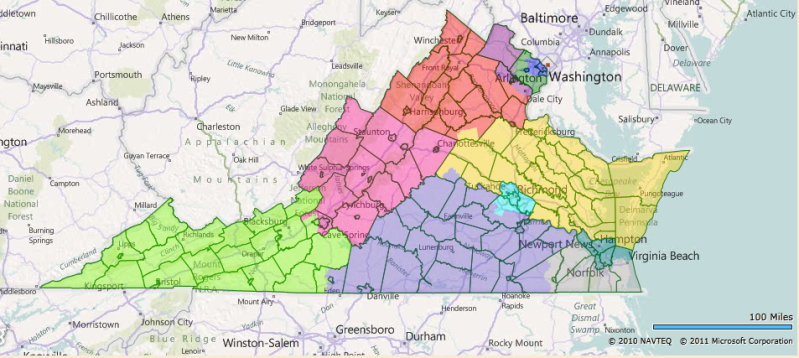
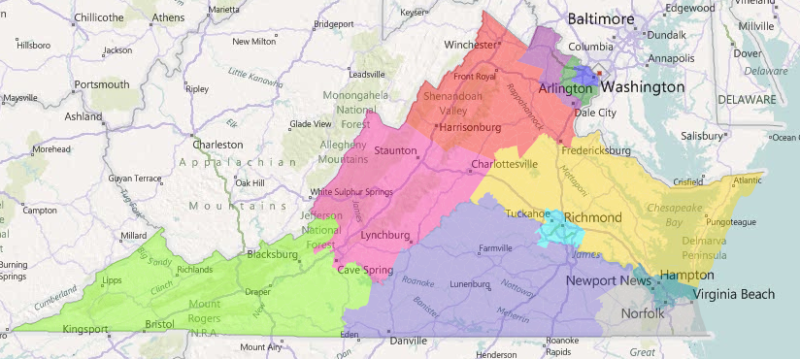
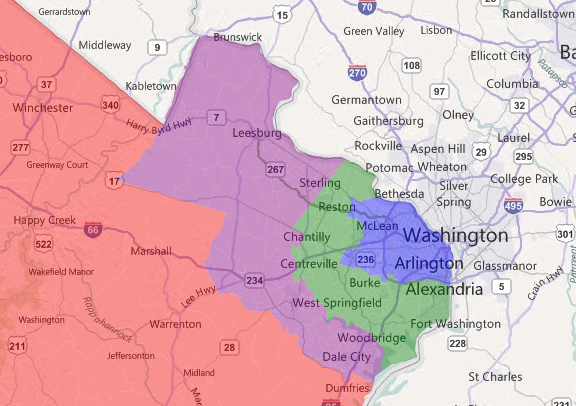
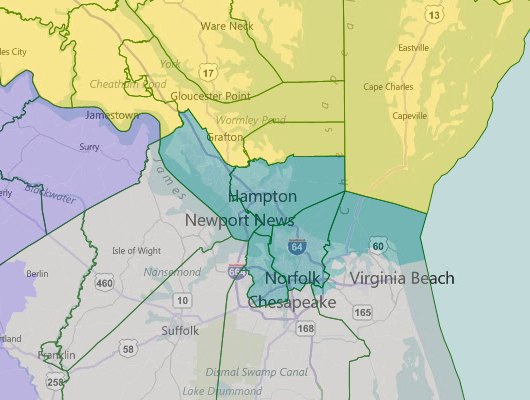
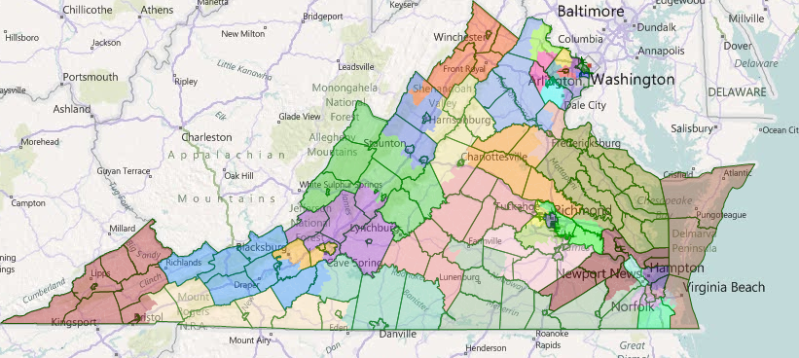
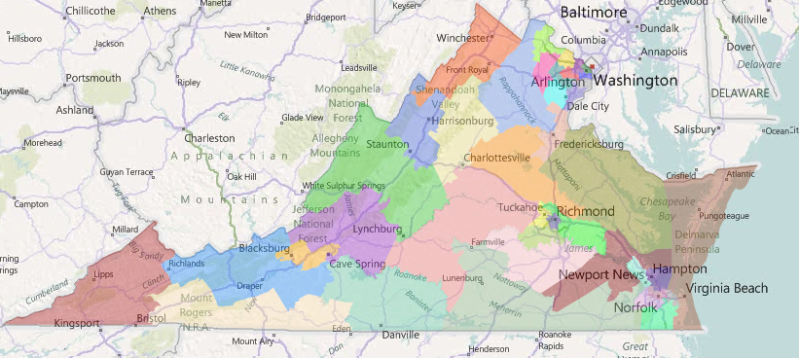
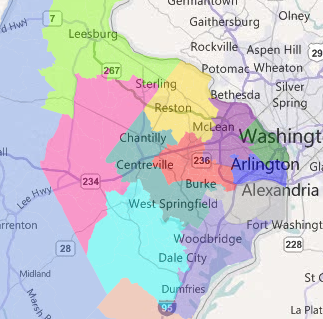
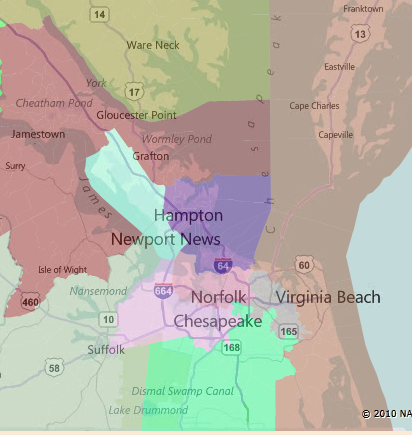
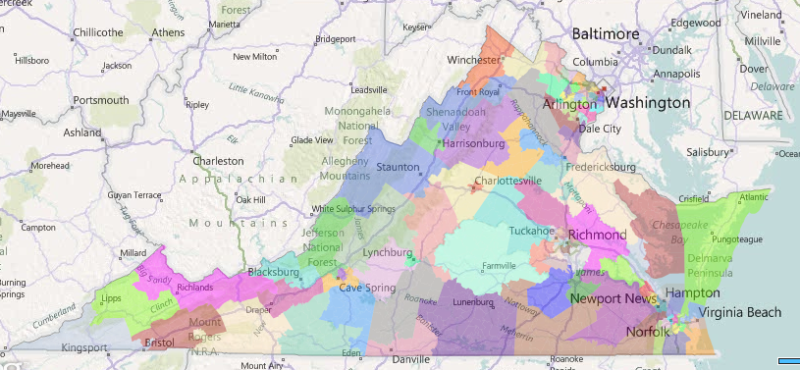
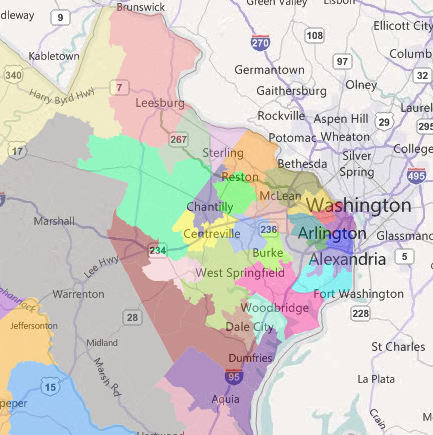
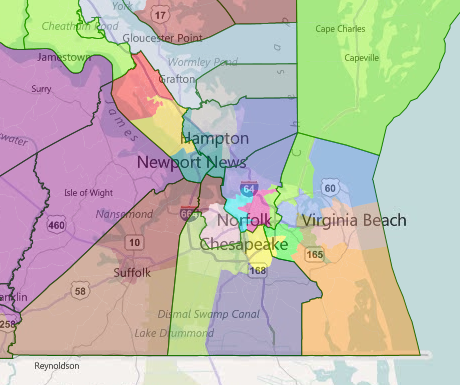
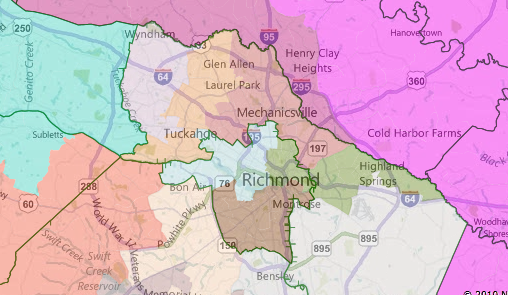
Virginia fair maps, Congress, State Senate and State House

With all the talk by Virginia Gov Bob McDonnell about fair redistricting, I thought it would be interesting to make a map that is actually fair. However, instead of just doing a congressional map, I did a State House and State Senate map as well. Do to the fact that it is 150 districts, I will not be giving information on each like i usually do. Instead, i just did a count and classified each district. Any district with less than 45% Obama is Safe R, 45-49.9 is Likely R, 50-53.9 is Lean R, 54-56 is Toss-Up, 56.1-59.9 is Lean D, 60-64.9 is Likely D, 65 and up is Safe D.

First up, the plan for the Congressional seats.


3 Safe R, 3 Likely R, 1 Toss Up, 2 Lean D, 2 Safe D.

That would be 3 Probably R, 2 Probably D, and 3 Competitive seats.

State Senate Plan


15 Safe R, 3 Likely R, 5 Lean R, 4 Toss-Ups, 2 Lean D, 7 Likely D, 4 Safe D.

That would be 18 Probably Republican, 11 Probably Democrat, and 11 Competitive.

State House


31 Safe R, 16 Likely R, 8 Lean R, 9 Toss-Ups, 10 Lean D, 12 Likely D, 14 Safe D.

47 Probably Republican, 26 Probably D, 27 Competitive.

My initial reaction was one of surprise, as I thought the seat count would be more even. But as I thought about it, Virginia was closer than the nation as a whole, so if we use the nation as a whole as the way to determine how safe a district is, we of course get this result. If you assume 08 is closer to the truth, dems would win almost all of the “competitive” districts. If we assume it is more like 2010, than those would go to republicans. If you want more info on any districts or VRA or any of that good stuff, lemme know.

Arkansas Redistricting: New Pres Numbers by CD

Arkansas rounds out the first batch (along with Iowa and Louisiana) of states finishing their redistricting tasks, so we’ve crunched the data to see how the last few elections went in the newly-designed districts. (If you’re unfamiliar with the new map, which wound up without the infamous “Fayetteville Finger,” you can take a gander here.)


District Obama # McCain # Obama % McCain % Beebe % Keet % Lincoln % Boozman %
AR-01 102,670 151,918 39.17 57.96 67.68 30.32 42.29 52.34
AR-02 129,888 157,732 44.29 53.79 66.06 32.28 42.02 53.77
AR-03 85,866 161,902 33.86 63.85 57.84 39.93 26.01 68.32
AR-04 103,886 166,465 37.41 59.95 65.54 32.52 36.49 58.07

Unlike last decade’s map (which placed in Arkansas in the company of only Iowa and West Virginia in keeping every county intact), the new Arkansas map splits several counties down the middle, making this a more difficult task than Iowa (and more difficult than Louisiana, which seems to have more useful data). Jeffmd’s data crunching involved not only some estimation of how to allocate absentee ballots, but also some approximation of Sebastian County (i.e Fort Smith, now split between the 3rd and 4th) votes, which aren’t listed by precinct but rather by polling location, meaning rather tediously mapping the county and pinpointing polling places. (You can check out the full spreadsheet here.)

Despite controlling the redistricting trifecta here (the Gov. plus both legislative chambers), it doesn’t seem like Arkansas Dems did much to advance their cause here, leaving the numbers pretty much as is, despite shifting around a lot of counties (especially in the dark-red northwest, where there’s now an unsightly bulge of the 4th into the former 3rd). The old districts were 38 Obama/59 McCain in AR-01, 44/54 in AR-02, 34/64 in AR-03, and 39/58 in AR-04… hardly any change at all, although the 1st improved very slightly at the expense of the 4th. If there was any consideration given to either improving Dem chances at picking up the 2nd or strengthening the 4th in the event of a Mike Ross retirement, it didn’t pan out.

Know Your Caucuses: Parsing the Budget Votes

Last Thursday and Friday were a busy couple of days in the House, with the passage of Paul Ryan’s Medicare-eviscerating budget and the defeat of a panoply of other budget options, including Democratic alternatives and a seriously dystopian proposal from the Republican Study Committee (the ideological caucus that once was the House Republicans’ extreme-right vanguard but now, with 179 members – including almost all of the freshman class, even the ostensibly moderate ones – pretty much overlaps with the House Republicans as a whole, encompassing nearly three-quarters of them). The week before that came the appropriations vote, which was more or less a vote on whether to keep the government running or shut it down. These particular roll call votes gave some definition to fissures within the Republican caucus that we’ve instinctively known are there; there’s a lot of overlap between the members voting ‘yes’ on the alternative RSC budget and those voting ‘no’ on the CR (i.e. voting in favor of a shutdown), providing the basic outline of mainstream vs. teabagger in the House, and also cluing us in on where the multitudes of new GOP freshmen fall on that spectrum.

As you can see with the chart below, the ones voting ‘no’ on the RSC budget and voting ‘yes’ on continued government operations are the party’s establishment: leadership, Appropriations Committee members, the remaining rump of moderates and assorted other conservatives who still fall into the ‘sane’ camp, and various swing-district freshmen watching their own backs. The ones voting ‘yes’ on the RSC budget and ‘no’ on the CR are, by contrast, the really nasty pieces of work, the ones who tend to get the most media attention for their bomb-throwing comments and don’t seem to have much interest in the consequences, given their (mostly) safe districts. There are a few glaring exceptions, and those are the freshmen in Obama districts who seem content to go down with the ship in 2012: Allen West and Joe Walsh… and one very strange third member of the group, in the form of VA-02’s Scott Rigell, who seems eager to recast himself after being on the defensive in 2010’s primary for having contributed to Obama and other RINO-ish offenses.

The ones in the middle, voting ‘yes’ on the RSC budget but also ‘yes’ on the CR, are the ones who in previous decades would have been the House’s far-right but are just sort of business-as-usual these days; they tend to make up the RSC’s rank-and-file, in favor of total austerity but not outright monkey-wrenching the economy. Maybe the most interesting collection is the ones voting ‘no’ on both the RSC budget and the CR (in other words, they’re against the RSC’s every-man-for-himself budget but also in favor of a shutdown). Most of these confused folks seem to be freshmen who are still figuring out their ideological identities in terms of what’ll get them re-elected next time (see Chip Cravaack as a main case in point, as well as, say, Robert Hurt and Scott Tipton). However, a few are veterans seeking a promotion — Dean Heller and Denny Rehberg – and seemingly trying to work an angle, not letting themselves on record as having voted in favor of anything unpopular. (Rehberg, in fact, took this even further, as one of only the four GOPers who voted against the Ryan budget, along with sorta-moderate Walter Jones, vulnerable freshman David McKinley, and Ron Paul, who voted against it from the right.)

R: Republican Study Committee

T: Tea Party Caucus

M: Main Street Partnership

F: Freshman

O: Obama district

Y on CR
N on RSC
N on CR
N on RSC
Y on CR
Y on RSC
N on CR
Y on RSC
Aderholt (R, T)

Alexander (R, T)

Barletta (F, O)

Bass (M, ‘F,’ O)

Benishek (R, F, O)

Berg (R, F)

Biggert (M, O)

Bilbray (R, M, O)

Bilirakis (R, T)

Black (R, T, F)

Bonner (R)

Bono Mack (M, O)

Boustany

Buchanan (R)

Bucshon (R, F)

Camp (R, M, O)

Canseco (R, F, O)

Cantor (R)

Capito (M)

Crawford (R, F)

Crenshaw (T)

Davis (R)

Dent (M, O)

Des Jarlais (R, F)

Diaz-Balart (M)

Dold (M, F, O)

Dreier (M, O)

Duffy (R, F, O)

Ellmers (R, F, O)

Emerson (M)

Farenthold (R, T, F, O)

Fincher (R, T, F)

Fitzpatrick (M, ‘F,’ O)

Fortenberry (R, M)

Frelinghuysen (M)

Gerlach (M, O)

Gibbs (R, F)

Gibson (R, M, F, O)

Graves (MO) (R)

Griffin (R, F)

Grimm (R, F)

Guthrie (R)

Hanna (R, M, F, O)

Hastings

Hayworth (R, M, F, O)

Heck (F, O)

Herrera (R, F, O)

Hultgren (R, F, O)

Jenkins (R, M, T)

Johnson (OH) (M, F)

Jones

King (NY)

Kinzinger (R, M, F, O)

Latham (O)

La Tourette (M)

Lewis (M)

Lo Biondo (M, O)

Lucas (R)

Luetkemeyer (R, T)

Lungren (R, O)

Marino (F)

McCarthy

McKeon (R)

McKinley (R, M, F)

McMorris Rodgers (R)

Meehan (M, F, O)

Murphy (M)

Noem (R, F)

Nugent (R, T, F)

Nunes

Paulsen (M, O)

Petri (M, O)

Pitts (R)

Platts (M)

Reed (R, M, F)

Renacci (R, M, F)

Rivera (F)

Roby (R, F)

Rogers (AL) (R)

Rogers (KY)

Rogers (MI) (O)

Rooney (R)

Ros-Lehtinen (O)

Roskam (R, O)

Runyan (M, F, O)

Ryan (R, O)

Schilling (R, F, O)

Schock (R, M)

Sensenbrenner

Shuster

Simpson

Smith (NJ)

Stivers (R, M, F, O)

Thompson (R)

Tiberi (M, O)

Turner (R, M)

Upton (M, O)

Walden (M)

Webster (R, F, O)

Whitfield (M)

Wittman (R)

Wolf (M, O)

Womack (R, F)

Young (AK)

Young (FL) (O)

Young (IN) (R, F)
Adams (R, T, F)

Cravaack (F, O)

Forbes (R, O)

Gardner (R, F)

Heller

Hurt (R, F)

McCotter (R, M, O)

Miller (MI)

Pearce (R, T, ‘F’)

Rehberg (R, T)

Scott (SC) (R, F)

Tipton (F)

Yoder (R, F, O)
Akin (R, T)

Austria (R, M)

Bachus (R)

Bishop (R, T)

Brady (R)

Brooks (R, F)

Buerkle (R, F, O)

Burgess (R, T)

Burton (R, T)

Calvert (M, O)

Campbell (R, O)

Carter (R, T)

Cassidy (R, T)

Coble (R, T)

Coffman (R, T)

Cole (R)

Conaway (R)

Culberson (R, T)

Denham (R, F)

Fleischmann (R, F)

Flores (R, F)

Foxx (R)

Gallegly (O)

Goodlatte (R)

Gosar (R, F)

Granger (R)

Guinta (R, F, O)

Hall (R)

Harper (R)

Hartzler (R, T, F)

Hensarling (R)

Herger (R, T)

Hunter (R)

Issa (R)

Johnson (TX) (R)

Kelly (R, F)

Kline (R)

Lance (M, O)

Landry (R, T, F)

Lankford (R, F)

Latta (R)

Lummis (R)

Manzullo (R, O)

Marchant (R)

Mica

Miller (CA) (R)

Miller (FL) (R)

Myrick (R)

Nunnelee (R, F)

Olson (R)

Palazzo (R, F)

Pompeo (R, F)

Posey (R)

Price (R, T)

Ribble (R, F)

Roe (R, T)

Rohrabacher

Rokita (R, F)

Royce (R, T)

Scalise (R, T)

Scott (GA) (R, F)

Sessions (R, T)

Shimkus (R)

Smith (NE) (T)

Smith (TX) (R, T)

Stearns (T)

Sullivan (R)

Terry (M, O)

Thornberry (R)

Walberg (R, T, ‘F,’ O)

Westmoreland (R, T)

Woodall (R, F)
Amash (R, F)

Bachmann (R, T)

Bartlett (R, M, T)

Barton (R, T)

Blackburn (R)

Broun (R, T)

Chabot (R, ‘F,’ O)

Chaffetz (R)

Duncan (SC) (R, T, F)

Duncan (TN)

Flake (R)

Fleming (R, T)

Franks (R, T)

Garrett (R)

Gingrey (R, T)

Gowdy (R, F)

Graves (GA) (R)

Griffith (R, F)

Harris (R, F)

Huelskamp (R, T, F)

Huizenga (R, F)

Johnson (IL)

Jordan (R)

King (IA) (R, T)

Kingston (R)

Labrador (R, F)

Lamborn (R, T)

Long (R, F)

Mack (R)

McClintock (R)

McHenry (R)

Mulvaney (R)

Neugebauer (R)

Paul

Pence (R, T)

Poe (R, T)

Quayle (R, F)

Rigell (R, F, O)

Ross (R, T, F)

Schmidt (R)

Schweikert (R, F)

Southerland (R, F)

Stutzman (R, F)

Walsh (R, T, F, O)

West (R, T, F, O)

Wilson (R, T)

One interesting post-script: the vote on the RSC budget was subject to some last-minute monkey business, as Democrats switched their votes en masse to ‘present,’ leaving the RSC budget too dangerously close to passage for leadership’s tastes. TPM reports that at least four key Republicans switched their votes at the very last second to keep it from passing, although it’s still not exactly clear who the switchers were:

After a few minutes of panic and pandemonium, GOP leaders convinced Rules Committee Chairman David Dreier (R-CA), Cathy McMorris Rodgers (R-WA), as well as Rep. Mary Bono Mack (R-CA), to switch and save the day.

After initial reports that Connie Mack had also switched were squelched, those later turned to rumors of Buck McKeon as #4. I’m not exactly sure why Dreier, Bono Mack, and McKeon (all in Obama districts that could morph into something even bluer thanks to California’s new redistricting commission) were willing to go on record in favor of the RSC budget in the first place; they might be secretly happy to be ‘no’s at this point.

One other observation: notice who’s not anywhere on the list? Dave Reichert, possibly one of the most vulnerable long-time House GOPers in 2012 unless redistricting saves his bacon; he was a non-voter on both bills. It’s not clear whether he’s ill again, or whether his electoral strategy for 2012 involves hiding under a pile of coats for the next two years. [UPDATE: Several commenters point out that Reichert’s mother passed away last week; our condolences to him and his family.]

That’s not all! We still have all the Dems to talk about, over the flip…

Democrats were unanimous against the Ryan budget, and the vast majority of them voted ‘present’ on the RSC budget in order to better expose that intra-caucus cleavage within the GOP. However, 16 Dems did wind up voting ‘no’ instead (Altmire, Barrow, Boswell, Braley, Courtney, Donnelly, Heinrich, Kildee, Loebsack, Matheson, McIntyre, Murphy, Schrader, Shuler, Smith, and Watt); while at first, it seems to be a list of sometimes-uncooperative Blue Dogs, it also includes a few guys who are seeking promotions and probably don’t want to be seen as playing games (Martin Heinrich, Chris Murphy), and maybe a few guys who just didn’t get the message about switching (Mel Watt?).

However, there were some fissures within the Democratic caucus that become evident when comparing two of the alternative budgets offered by Democrats: one from the Progressive Caucus and one from the Congressional Black Caucus. Those who voted either ‘yes’ on both or ‘no’ on both pretty clearly delineate the left and right flanks of the Democratic caucus. (I can’t say there are many surprises here, with only one notable New Dem and potentially-difficult-district denizen voting ‘yes’ twice — Rush Holt – and several well-known Progressives (DeFazio, Waxman) voting ‘no’ twice for some irascible reason.) The ones who split the difference, voting for the CBC budget but not for the more aggressive Progressive budget, tend to be leadership and its allies, or else veteran Dems who tend to alternate back and forth between the two camps. There were two members against the CBC budget and for the Progressive budget; fittingly, given the decidedly counterintuitive nature of that pairing, the two were Dennis Kucinich and David Wu.

P: Progressive Caucus

N: New Democrats

B: Blue Dogs

F: Freshman

M: McCain district

Y on Prog
Y on CBC
Y on Prog
N on CBC
N on Prog
Y on CBC
N on Prog
N on CBC
Baca (B)

Baldwin (P)

Bass (P, F)

Becerra (P)

Blumenauer (P)

Brady (P)

Brown (P)

Butterfield

Capuano (P)

Carson (P, N)

Chu (P)

Cicilline (P, F)

Clarke (MI) (F)

Clarke (NY) (P)

Cleaver (P)

Clyburn

Cohen (P)

Conyers (P)

Cummings (P)

Davis (IL) (P)

Doyle

Edwards (P)

Ellison (P)

Farr (P)

Fattah (P)

Filner (P)

Frank (P)

Fudge (P)

Grijalva (P)

Gutierrez (P)

Hastings (P)

Hirono (P)

Holt (N)

Honda (P)

Jackson (IL) (P)

Jackson Lee (P)

Johnson (TX) (P)

Lee (P)

Lewis (P)

McCollum

McDermott (P)

McGovern (P)

Miller (CA) (P)

Moore (P)

Nadler (P)

Napolitano

Pallone (P)

Pastor (P)

Payne (P)

Pingree (P)

Rangel (P)

Richardson (P)

Richmond (F)

Roybal-Allard (P)

Rush (P)

Sanchez, Li. (P)

Sarbanes

Schakowsky (P)

Serrano (P)

Slaughter (P)

Thompson (MS) (P)

Tierney (P)

Tonko

Towns

Velazquez (P)

Waters (P)

Watt (P)

Welch (P)

Wilson (FL) (P, F)

Woolsey (P)
Kucinich (P)

Wu (N)
Ackerman

Andrews

Berman

Carnahan (N)

Castor

Crowley (N)

DeLauro (P)

Deutch

Engel (N)

Gonzalez(N)

Green, Al

Hanabusa (F)

Hoyer

Kaptur (P)

Kildee

Larson (CT) (N)

Lujan (P)

Lynch

Miller (NC)

Neal

Pascrell

Pelosi

Price

Rothman

Scott (GA) (N, B)

Scott (VA)

Sires

Sutton

Van Hollen

Wasserman Schultz (N)

Yarmuth
Altmire (N, B, M)

Barrow (N, B)

Bishop (NY)

Boren (B, M)

Boswell (B)

Braley

Capps (N)

Cardoza (B)

Carney (F)

Chandler (B, M)

Connolly (N)

Cooper (B)

Costa (B)

Costello

Courtney (N)

Critz (M)

Cuellar (B)

Davis (CA) (N)

DeFazio (P)

DeGette (N)

Dicks

Dingell

Doggett

Donnelly (B)

Eshoo

Green, Gene

Heinrich (N)

Higgins (N)

Himes (N)

Holden (B, M)

Inslee (N)

Israel (N)

Kind (N)

Kissell

Larsen (WA) (N)

Levin

Lipinski

Loebsack (P)

Lofgren

Matheson (B, M)

Matsui

McCarthy (N)

McIntyre (N, B, M)

McNerney

Michaud (B)

Moran (P, N)

Murphy (CT) (N)

Owens

Perlmutter (N)

Peters (N)

Peterson (B, M)

Polis (P, N)

Quigley

Reyes

Ross (B, M)

Ruppersberger

Ryan (OH)

Sanchez, Lo. (N, B)

Schiff (N, B)

Schrader (N, B)

Schwartz (N)

Sherman

Shuler (B, M)

Smith (WA) (N)

Speier

Thompson (CA) (B)

Tsongas

Visclosky

Walz

Waxman (P)

Weiner

(You might notice 18 names missing from this chart of Dems; it excludes anyone who missed one or both votes. Maybe most significantly, that includes new Senate candidate Shelley Berkley.)

Louisiana Redistricting: New Pres Numbers by CD

With the Louisiana redistricting map one of the first to emerge intact from the sausage-making process, it’s time to crunch the numbers and see just what kind of districts we wound up with. (Notice that I’m not saying the map is a done deal… the Obama DOJ might still weigh in and shake things up, as they could conceivably push for a second African-American plurality district under the VRA.) Our resident data guru, jeffmd, has sliced and diced the shapefiles on the state House’s website, overlaid that onto the VTDs available from the Census Bureau, matched the VTDs to 2008 and 2010 election results available from the Louisiana SoS website, and voila:


District Obama # McCain # Obama % McCain % Fayard % Dardenne % Melancon % Vitter %
LA-01 81,515 233,789 25.34 72.68 25.30 74.70 24.89 69.79
LA-02 235,554 81,703 73.36 25.44 73.01 26.99 70.38 24.72
LA-03 111,831 210,951 34.06 64.25 39.36 60.64 31.40 62.55
LA-04 126,899 187,020 39.94 58.86 45.78 54.22 36.29 57.54
LA-05 124,119 209,705 36.69 61.98 40.04 59.96 32.98 60.31
LA-06 103,071 225,094 30.90 67.49 33.04 66.96 32.45 62.02

The full precinct-by-precinct dataset, courtesy of Google Docs, is available here.

If you aren’t familiar with the contours of the new map, you can take a look here. In a nutshell, the 1st remains the New Orleans suburbs, the 2nd remains New Orleans proper (although now it reaches into Baton Rouge’s African-American neighborhoods as well), the 4th is still centered on Shreveport, the 5th is still Monroe and Alexandria, and the 6th is still centered on Baton Rouge (even if its core is now missing). The big difference is the 3rd, which now mostly occupies what used to be the 7th, across Lake Charles and Lafayette; the old 3rd, in Cajun country south of New Orleans, has been parceled out to the 1st, new 3rd/former 7th, and also the 6th and 2nd.

As you can see, the redistricting result is very, very likely to result in a 5-1 map. The friendliest district for Dems, after the 2nd, is now the Shreveport-based 4th, but even it didn’t even see Barack Obama hit 40%. That’s not much different from the current setup (where he did hit 40%); the old 6th was the friendliest for Dems, but barely more so (with 41% for Obama).

Greg Giroux has some other interesting tidbits available on how the 3rd district (which is now poised to become a battleground between incumbent GOPers Charles Boustany and Jeff Landry) got neatly dismantled: Boustany represents 575K of the 3rd’s residents, while Landry represents only 180K of them, a nearly 3:1 advantage for Boustany. Of the old 3rd, 29% of it wound up in LA-01, 28% in new LA-03, 24% in LA-06, and 18% in LA-02. (The Daily Kingfish has picked up on this, and speculates that Landry might be better off challenging Steve Scalise in the 1st instead.)  

Racial Composition Change by CD

With the Census Bureau having released 2010 data for all 435 congressional districts, I started slicing ‘n’ dicing the data last week, looking at population change in the fastest growing and shrinking districts. Today, as promised, we’re moving on to how the racial composition of the congressional districts has changed.

You might remember that I did this same project a year and a half ago based on 2008 estimated data, and that was a good template for today’s work, as the lists haven’t changed that much. Where the lists have changed, it seems to be more likely because of strange sample issues in 2008 (like the rapid appearance and subsequent disappearance of a big Asian population in NY-06) than rapid changes in the trend over the last two years. As with last time, the most remarkable chart is the one showing biggest declines, percentage-wise in districts’ non-Hispanic white populations. (Because this is the key chart, I’m extending this list to 25 places.) As you’ll no doubt notice, many of these districts also had some of the biggest moves in the Democratic direction over the years from 2000 to 2008.

District Rep. 2000
white
2000
total
2000
%
2010
white
2010
total
2010
%
%
change
2000
election
2008
election
GA-07 Woodall (R) 476,346 630,511 75.5 486,673 903,191 53.9 – 21.7 31/69 39/60
GA-13 Scott (D) 295,107 629,403 46.9 202,053 784,445 25.8 – 21.1 57/43 71/28
TX-24 Marchant (R) 415,842 651,137 63.9 368,645 792,319 46.5 – 17.3 32/68 44/55
TX-22 Olson (R) 394,651 651,657 60.6 405,645 910,877 44.5 – 16.0 33/67 41/58
FL-19 Deutch (D) 494,890 638,503 77.5 456,060 736,419 61.9 – 15.5 73/27 65/34
CA-25 McKeon (R) 363,792 638,768 57.0 352,189 844,320 41.7 – 15.2 42/56 49/48
FL-20 Wasserman Schultz (D) 426,891 639,795 66.7 358,470 691,727 51.8 – 14.9 69/31 63/36
TX-07 Culberson (R) 439,217 651,682 67.4 411,276 780,611 52.7 – 14.7 31/69 41/58
NV-03 Heck (R) 459,756 665,345 69.1 568,343 1,043,855 54.4 – 14.7 49/48 55/43
TX-10 McCaul (R) 431,992 651,523 66.3 513,811 981,367 52.4 – 13.9 34/67 44/55
IL-03 Lipinski (D) 445,179 653,292 68.1 361,581 663,381 54.5 – 13.6 58/40 64/35
CA-11 McNerney (D) 408,785 639,625 63.9 400,825 796,753 50.3 – 13.6 45/53 54/44
VA-10 Wolf (R) 495,611 643,714 77.0 554,054 869,437 63.7 – 13.3 41/56 53/46
TX-02 Poe (R) 418,476, 651,605 64.2 399,454 782,375 51.1 – 13.2 37/63 40/60
FL-08 Webster (R) 447,266 639,026 70.0 459,529 805,608 57.0 – 13.0 46/54 53/47
CA-41 Lewis (R) 405,790 639,935 63.4 404,103 797,133 50.7 – 12.7 41/56 44/54
FL-12 Ross (R) 461,239 640,096 72.1 500,066 842,199 59.4 – 12.7 45/55 49/50
CA-10 Garamendi (D) 417,008, 638,238 65.3 377,698 714,750 52.8 – 12.5 55/41 65/33
CA-22 McCarthy (R) 426,192 638,514 66.7 432,482 797,084 54.3 – 12.5 33/64 38/60
MD-05 Hoyer (D) 400,668 662,203 60.5 368,667 767,369 48.0 – 12.4 57/41 65/33
NV-01 Berkley (D) 342,987 666,442 51.5 322,853 820,134 39.4 – 12.1 56/41 64/34
CA-13 Stark (D) 244,693 638,708 38.3 174,998 665,318 26.3 – 12.0 67/30 74/24
VA-11 Connelly (D) 430,091 643,582 66.8 434,526 792,095 54.9 – 12.0 45/52 57/42
CA-03 Lungren (R) 474,940 639,374 74.3 488,421 783,317 62.4 – 11.9 41/55 49/49
FL-15 Posey (R) 497,676 639,133 77.9 539,194 813,570 66.3 – 11.6 46/54 48/51

Districts appearing in the 2010 data’s top 25 that weren’t present in 2008 are VA-10, TX-02, FL-08, CA-41, and NV-01; while the other four are driven mostly by Latino growth, the growth in VA-10 (in Washington DC suburbs, more and more centered on once-exurban, now-suburban Loudoun County) is more Asian. These five replace TX-05, AZ-03, TX-06, TX-03, and NJ-07.

This presents a very different picture than the districts ordered according to the actual raw number of white residents lost. That list starts with GA-13 in first, which fell from 295,107 white residents in 2000 to 202,053 in 2010. This is the southern tier of Atlanta’s suburbs and exurbs, which is increasingly becoming a magnet for both Atlanta African-Americans moving outward and northern blacks moving south – in turn driving a lot of white flight, much of which seems to be rearranging itself north of Atlanta, especially in the 9th. The fast-growing 13th is unusual on this list, though; most of the remaining top 10 losers are districts where the overall population is stagnant or going down: MI-12, IL-03, PA-14, OH-10, IN-07, IL-02, CA-13, FL-20, and MO-01. As you’ll see in upcoming charts, blacks are replacing whites in MI-12, Hispanics are replacing whites in IL-03 and FL-20, Asians are replacing whites in CA-13, while in PA-14, OH-10, IN-07, IL-02, and MO-01, everyone is leaving, with whites are leaving the fastest.

Much, much more over the flip…

Here are the districts with the biggest gains among non-Hispanic whites:

District Rep. 2000
white
2000
total
2000
%
2010
white
2010
total
2010
%
%
change
2000
election
2008
election
IL-07 Davis (D) 178,144 653,521 27.3 204,780 638,105 32.1 4.8 83/16 88/12
NY-15 Rangel (D) 106,664 654,355 16.3 133,839 639,873 20.9 4.6 87/7 93/6
NY-11 Clarke (D) 140,595 654,134 21.5 161,819 632,408 25.6 4.1 83/9 91/9
NY-12 Velazquez (D) 150,673 653,346 23.1 180,232 672,358 26.8 3.7 77/15 86/13
GA-05 Lewis (D) 216,674 629,438 34.4 232,507 630,462 36.9 2.4 73/27 79/20
NY-10 Towns (D) 106,746 665,668 16.0 124,232 677,721 18.3 2.3 88/8 91/9
MI-14 Conyers (D) 213,120 662,468 32.2 187,516 550,465 34.1 1.9 81/18 86/14
CA-33 Bass (D) 126,488 638,655 19.8 137,720 637,122 21.6 1.8 83/14 87/12
CA-31 Becerra (D) 62,177 639,248 9.7 69,321 611,336 11.3 1.6 77/19 80/18
SC-06 Clyburn (D) 269,215 669,362 40.2 280,474 682,410 41.1 0.9 58/40 64/35

While you might expect the biggest white gains to be in the exurbs, that’s not the case at all (as suburbs and even exurbs are often becoming a first stopping-point for new immigrants). Instead, most of this list shows regentrification at work, especially in the parts of the outer boroughs of New York City currently under invasion by hipster armies (and also new additions CA-31 and CA-33, evidence of the very recent momentum in the revival of downtown Los Angeles). Similarly, Atlanta is becoming whiter even as its suburbs become much more African-American (which we got a preview of with last year’s mayoral race, where a white candidate nearly won). The odd district out is Detroit-based MI-14, where whites seem to be fleeing at a slower rate than everyone else. Only five additional districts had a percentage gain in white residents, for a total of 15 of all 435: LA-02, HI-02, CA-29, PA-02, and IL-04. (HI-02, NY-14, and CA-29 fall off the top 10 list from 2008, replaced by CA-33, CA-31, and SC-06.)

If you’re wondering which districts had the biggest numeric gains of white residents, rather than changes in the white percentage, here’s where the exurbs come in; the list looks a lot like the list of the biggest gainers altogether, or at least the whiter districts among the biggest gainers. AZ-06 in the Phoenix suburbs (with a large Mormon core in Mesa) had the biggest gain, from 490,359 to 673,881, followed by FL-05, AZ-02, ID-01, UT-03, GA-09, CO-06, SC-01, TX-26, and TX-31.

Now let’s turn to African-American populations:

District Rep. 2000
black
2000
total
2000
%
2010
black
2010
total
2010
%
%
change
2000
election
2008
election
GA-13 Scott (D) 255,455 629,403 40.6 439,119 784,445 56.0 15.4 57/43 71/28
GA-07 Woodall (R) 72,962 630,511 11.6 196,955 903,191 21.8 10.2 31/69 39/60
MI-12 Levin (D) 77,403 662,559 11.7 133,766 636,601 21.0 9.3 61/37 65/33
IL-02 Jackson (D) 403,522 654,078 61.7 414,414 602,758 68.8 7.1 83/17 90/10
MD-05 Hoyer (D) 198,420 662,203 30.0 281,862 767,639 36.7 6.8 57/41 65/33
FL-19 Deutch (D) 37,821 638,503 5.9 91,391 736,419 12.4 6.5 73/27 65/34
MD-02 Ruppersberger (D) 178,860 661,945 27.0 232,194 700,893 33.1 6.1 57/41 60/38
MO-01 Clay (D) 307,715 621,497 49.5 324,711 587,069 55.3 5.8 72/26 80/19
MI-11 McCotter (R) 23,456 662,505 3.5 64,239 695,888 9.2 5.7 47/51 54/45
GA-03 Westmoreland (R) 119,766 630,052 19.0 198,089 817,247 24.2 5.2 33/67 35/64

The list of the top 10 districts in terms of percentage gains among African-Americans is the same 10 as 2008, although with a few changes in the order. The story continues to be African-Americans moving from the cities to the suburbs, especially in the Atlanta area but also Detroit (with Detroiters moving north into the 12th), Chicago (with the metaphorical South Side now starting to extend south well below the city limits and even below I-80), and Washington DC (with Prince George’s County now largely black outside the Beltway, into the 5th, as well as inside in MD-04).

The top 10 gainers by raw numbers has many of the same districts, although also some of the suburban districts that gained a lot of everybody (like TX-22 and NC-09). It starts with GA-13 (from 439K to 629K), followed by GA-07, MD-05, GA-03, TX-22, NC-09, MI-12, FL-19, MD-02, and TX-24.

District Rep. 2000
black
2000
total
2000
%
2010
black
2010
total
2010
%
%
change
2000
election
2008
election
IL-07 Davis (D) 402,714 653,521 61.6 322,730 638,105 50.6 – 11.0 83/16 88/12
GA-05 Lewis (D) 350,940 629,438 55.8 313,302 630,462 49.7 – 6.1 73/27 79/20
LA-02 Richmond (D) 407,138 639,048 63.7 287,077 493,352 58.2 – 5.5 76/22 74/25
CA-09 Lee (D) 164,903 639,426 25.8 131,574 648,766 20.3 – 5.5 79/13 88/10
CA-35 Waters (D) 216,467 638,851 33.9 188,365 662,413 28.4 – 5.4 82/17 84/14
CA-33 Bass (D) 189,855 638,655 29.7 156,406 637,122 24.5 – 5.2 83/14 87/12
NY-11 Clarke (D) 379,017 654,134 57.9 335,828 632,408 53.1 – 4.8 83/9 91/9
PA-02 Fattah (D) 392,293 647,350 60.6 355,849 630,277 56.5 – 4.1 87/12 90/10
NY-15 Rangel (D) 198,915 654,355 30.4 169,460 639,873 26.5 – 3.9 87/7 93/6
TX-18 Jackson-Lee (D) 260,850 651,789 40.0 260,585 720,991 36.1 – 3.9 72/28 77/22

The list of districts with the biggest percentage losses among African-Americans mostly parallels the list of districts with the biggest white gains, where regentrification is changing the complexion (and that it includes the catastrophic regentrification of New Orleans). It also includes several traditionally black districts where the blacks are being replaced mostly by Hispanics: CA-09, CA-35, and TX-18. IL-01 and MD-04 have fallen off the list from 2008, replaced by PA-02 and TX-18.

The top 10 by raw numbers of losses among African-Americans is led (perhaps no surprise) by LA-02, which went from 407K to 287K, followed by MI-13, IL-07, MI-14, IL-01, NY-11, GA-05, PA-02, CA-33, CA-09. Interestingly, because New Orleans in general lost so many people, the 2nd still significantly trails IL-07 in terms of the percentage loss.

Now let’s look at Asian-American populations:

District Rep. 2000
Asian
2000
total
2000
%
2010
Asian
2010
total
2010
%
%
change
2000
election
2008
election
NY-05 Ackerman (D) 159,491 654,253 24.4 218,275 670,130 32.3 8.2 67/30 63/36
CA-13 Stark (D) 179,681 638,708 28.1 239,434 665,318 36.0 7.9 67/30 74/24
CA-15 Honda (D) 187,198 639,090 29.3 246,832 677,605 36.4 7.1 60/36 68/30
CA-48 Campbell (R) 80,095 638,848 12.5 137,094 727,833 18.8 6.3 40/58 49/49
NJ-12 Holt (D) 58,748 647,253 9.1 104,996 701,881 15.0 5.9 56/40 58/41
VA-10 Wolf (R) 41,846 643,714 6.5 107,583 869,437 12.4 5.9 41/56 53/46
WA-08 Reichert (R) 50,745 655,029 7.7 108,807 810,754 13.4 5.7 49/47 57/42
CA-11 McNerney (D) 55,895 639,625 8.7 114,217 796,753 14.3 5.6 45/53 54/44
CA-14 Eshoo (D) 102,430 639,953 16.0 140,789 653,935 21.5 5.5 62/34 73/25
CA-03 Lungren (R) 36,970 639,374 5.8 84,384 783,317 10.8 5.0 41/55 49/49

The Asian gains, percentagewise, are concentrated in the Bay Area, although the #1 gainer is NY-05, where the majority of the population is in NE Queens. Flushing is now thoroughly Asian, and that’s starting to spill over into Bayside (of Archie Bunker and Jerky Boys fame). That’s followed by the East Bay’s CA-13, the first non-Hawaiian district to have an Asian plurality. The rest of the list is mostly affluent suburban areas which are starting to become light-blue at the presidential level even as they keep Republicans in the House; will declining white populations in these districts be enough to push them over the edge?

NY-06, NJ-07, and TX-22 have fallen off the list from 2008, replaced by NJ-12, WA-08, and CA-03. If you’re curious about the top 10 by raw numbers gain, it mostly overlaps the above list, although with some of the all-purpose growth engines (like NV-03) on there too: NV-03, VA-10, TX-22, CA-13, CA-15, NY-05, CA-11, WA-08, CA-48, and VA-11.

Only twelve districts have experienced any drops in the Asian population by percentage, and most of the drops are small, so there’s not much need for a chart for them; HI-02 (28.0% to 24.9%) had the most significant change, partly because of an influx of white retirees but more so because the big rise in “Two or more” as a common choice in Hawaii. That’s followed mostly by districts with rapidly growing Latino populations:  HI-01, CA-20, CA-18, IL-02, TX-29, FL-17, CA-51, TX-30, CA-35, NY-16, and TX-16. Only six districts had drops in raw numbers of Asians: IL-02, MI-13, TX-29, FL-17, IL-05, and IL-01.

Finally, let’s look at Hispanics:

District Rep. 2000
Hispanic
2000
total
2000
%
2010
Hispanic
2010
total
2010
%
%
change
2000
election
2008
election
IL-03 Lipinski (D) 139,268 653,292 21.3 225,298 663,381 34.0 12.6 58/40 64/35
CA-25 McKeon (R) 174,193 638,768 27.3 330,711 844,320 39.2 11.9 42/56 49/48
CA-41 Lewis (R) 150,076 639,935 23.5 277,907 797,133 34.9 11.4 41/56 44/54
CA-43 Baca (D) 371,501 637,764 58.3 510,693 735,581 69.4 11.2 64/34 68/30
CA-22 McCarthy (R) 133,571 638,514 20.9 255,209 797,084 32.0 11.1 33/64 38/60
CA-18 Cardoza (D) 268,586 639,004 42.0 381,039 723,607 52.7 10.6 53/44 59/39
FL-20 Wasserman Schultz (D) 132,575 639,795 20.7 216,352 691,727 31.2 10.6 69/31 63/36
TX-10 McCaul (R) 122,894 651,523 18.9 282,641 981,367 28.8 9.9 34/67 44/55
TX-29 Green (D) 430,980 651,405 66.2 514,861 677,032 76.0 9.9 57/43 62/38
TX-02 Poe (R) 82,578 651,605 12.7 176,196 782,375 22.5 9.8 37/63 40/60

As in 2008, the biggest gainer is IL-03, covering Chicago’s Southwest Side. (I’m truly not sure if people are moving from the depopulating, closer-in IL-04 to the slightly more spacious 3rd, or if the 3rd is becoming the destination of choice for new émigrés; maybe Chicagoans in the comments might shed some insight into that.) And in second place continues to be CA-25, a Republican-held district linking LA suburbs like Santa Clarita with high desert outposts like Lancaster. Interestingly, the list is pretty evenly divided by Democratic-held districts that already were substantially Hispanic and just got much more so (like TX-29 and CA-43), and Republican-held suburban districts where voting patterns haven’t caught up with the Hispanic population (and given the number of kids and non-citizens among those numbers, where it’ll take many more years for that catching up to happen).

There’s been a lot of churn among districts since 2008, perhaps a result of the difficulty of estimating Hispanic populations: districts falling off the top 10 list since 2008 are TX-32, TX-05, AZ-04, and CA-52. These have been replaced by CA-43, CA-18, TX-10, and TX-02.

The top 10 in raw numbers gain doesn’t correlate directly with districts that had biggest white percentage drops or Hispanic percentage gains. Instead, the list pretty thoroughly overlaps with the list of the top population gainers overall; while the Hispanic percentage went upwards in all of those districts, many of these districts were ones with a large Hispanic share already: case in point, the biggest gainer, FL-25 in Miami’s westernmost suburbs (which went from 398,986 to 577,998). That’s followed by CA-45 (which I certainly would have expected to see in the top 10 Hispanic percentage changes, but where the share increased “only” by 7.2%), TX-28, TX-10, CA-25, AZ-07, TX-15, CA-44, TX-23, and CA-43.

One remarkable thing about Hispanic growth is that it’s present almost everywhere. Only six districts experienced any drops in the Hispanic percentage whatsoever, all in urban districts where regentrification is occurring: starting with NY-12 (48.7% to 44.6%), followed by CA-31, NY-15, CA-29, IL-04, and NY-14. Those same six districts were the only ones to report drops in raw numbers, either: IL-04 had the biggest loss (from 486,839 to 442,018), CA-31, NY-12, NY-15, CA-29, and NY-14.

Redistricting Oregon: O So Svelte

Dave Bradlee finally managed to sort the obnoxious problems with Oregon’s 2010 Census data, which means it’s time for me to give my home state a whirl.

Nothing too much has changed, as you can see. It just has pretty lines and definitely preserves communities of interest. Only three counties (Columbia, Josephine, and Lincoln) are split between congressional districts, and none of those three are split between more than two districts.

OR-01 (blue)

Democratic Rep. David Wu, who lives in Multnomah County, is out. Unfortunately, some depopulation along the Oregon Coast means this district is stretching a bit further south to find constituents, which is maybe the only part of this map I’m not thrilled about (for aesthetic reasons). As for the politics, as this is a horse-race elections site: Despite Yamhill County’s Republican lean, the great majority of this district’s population is in true blue northwestern Oregon. If Wu can be kept out by this redistricting job, state senators Suzanne Bonamici and Mark Hass are probably in line, provided Labor Commissioner Brad Avakian doesn’t want the job. The inside scoop is that if Wu’s job opens up, he’s got first right of refusal. Likely Democratic.

OR-02 (green)

Walden lives in Hood River. Hood River has been moved elsewhere. Even if Walden doesn’t move back – and I think the diehard conservatives in eastern Oregon, which is (surprisingly enough) one of the most conservative parts of the entire country, may prefer to send Oregon Senate Minority Leader Ted Ferrioli or Bend-area state senator and ambitious “rising star” Chris Telfer to Congress instead of Walden, a close ally of (the possibly doomed) Speaker Boehner who has taken flak for being a leading member of the quasi-moderate Main Street Partnership – this district is red enough to elect an Oregonian version of Christine O’Donnell without a fuss. Anyway, I felt Hood River County belongs with eastern Multnomah County in terms of communities of interest more than it belongs with the high desert cow counties. Safe Republican.

OR-03 (purple)

Democratic Rep. Earl Blumenauer’s district has consolidated all of Multnomah County, taken over Hood River County, and poked up into Columbia County just a tad bit, simultaneously withdrawing from Clackamas County. As for politics: Che Guevara could get elected here by double-digit margins. Walden could run here, but he would get clobbered. Wu could also run here, but he would also get clobbered. Mostly, I just think this district looks nice. Safe Democratic.

OR-04 (red)

One of the enduring mysteries of Congress is the charmed existence of Democratic Rep. Peter DeFazio, a blunt, unabashed, aggressively off-the-reservation left-winger sitting in a light-blue seat. Last year, when conditions seemed perfect for a Republican to potentially upset DeFazio, Republicans in the district nominated certifiable crazy person Art Robinson. DeFazio’s final margin was closer than expected, perhaps on account of his taking victory against Robinson pretty much for granted, but it was still fairly convincing. This district hasn’t changed much. DeFazio still has the red ball-and-chain that is Linn County tethered to him, but it’s easily offset by flaming liberal Benton and Lane counties, both of which are anchored by legendarily left-wing college towns. In terms of actually drawing the map, since I wasn’t consulting political data, it was basically just leftover western Oregon and as much of southern Oregon as fit with population limits stretching east from the coast (which turned out to be not much). Likely Democratic.

OR-05 (yellow)

What is there to do about Democratic Rep. Kurt Schrader? Well, one thing to do that would make Clackamas County residents happy would be to give the piece of OR-03 reaching down a little bit into Schrader’s home county back to this fairly swingy district. Another thing might be to embark on a registration drive in increasingly Hispanic Salem and its suburbs, but that’s not really redistricting’s job. Redistricting’s job is to preserve communities of interest, and that was my chief consideration here. As a progressive who generally supports Democrats, I’m not honestly worried about Schrader, and this is why: Republicans target OR-05 every cycle, and every time, they do worse than they were expecting. Last year, Schrader was supposed to lose to Scott Bruuuuuuuuuuuuuun (who, yes, still lives in this district). He won by over five points instead. Republicans were supposed to take over the district in 2008 when then-Rep. Darlene Hooley retired. Schrader crushed Hooley’s 2006 opponent (who was supposed to beat her then, too) by 16 points. Fun fact: in this D+1 district, Republicans haven’t even come as close as five points away since 1994 – the cycle before then-Rep. Jim Bunn lost to Hooley (in 1996) by a margin nearly identical to the margin by which Schrader prevailed last year. For whatever reason, this district is fools’ gold for the Oregon Republican Party. But my favorite part of this redrawn district? It consists simply of all of Polk, Marion, and Clackamas counties, and it’s just 515 heads over the target population. Sexy. Lean Democratic.

A Closer Look at the 25 Fastest-Growing Districts

Yesterday I created lists of the biggest gainers and losers among congressional districts over the period of 2000-10, but only hinted at the changes in racial composition that were underlying the overall population changes. A longer post about the racial composition (analogous to this one I did a year and a half ago) changes is in the works, but as part of that I conceived of this table… which really would have worked better with yesterday’s piece, so I’m giving it its own home here. It shows the numeric change in each district, broken down by the numeric change among each race in each district.

What should stand out here is that among the 25 biggest gainers, in most of the districts, the combined non-white gains exceeded the (non-Hispanic) white gains. Among the few that didn’t, some are districts that are either heavy on retirees (AZ-02, FL-05), some have a large Mormon population (AZ-06, UT-03), with a few a little harder to classify (GA-09 is sort of the exurban white flight receptacle from the rest of the Atlanta area, and ID-01 is a mix of a lot of Mormons and a lot of white flight from southern California). As always, as I’ve cautioned many times before, these districts aren’t an immediate panacea for Democrats and look to stay fairly red for the short term; with most of these districts full of kids (kids who aren’t likely to grow up to be Republicans, though!), gains at the ballot box are going to unfold slooooowly.

District Rep. Total
change
White
change
Black
change
Asian
change
Hispanic
change
NV-03 Heck (R) 378,510 108,587 40,011 71,132 136,127
AZ-02 Franks (R) 331,404 171,702 20,194 14,194 110,853
AZ-06 Flake (R) 330,373 183,522 18,103 23,727 89,920
TX-10 McCaul (R) 329,844 81,819 49,129 31,182 159,747
FL-05 Nugent (R) 289,814 178,699 27,165 10,496 65,238
CA-45 Bono Mack (R) 275,656 56,706 17,886 22,645 170,850
GA-07 Woodall (R) 272,680 10,327 123,993 47,477 80,659
TX-26 Burgess (R) 263,279 112,403 20,457 21,450 100,522
TX-22 Olson (R) 259,220 10,994 66,263 64,288 112,521
TX-31 Carter (R) 250,233 108,700 24,991 16,193 89,632
NC-09 Myrick (R) 232,672 96,914 62,615 15,404 47,784
VA-10 Wolf (R) 225,723 58,443 19,165 65,737 71,862
UT-03 Chaffetz (R) 221,687 116,807 4,236 7,233 79,400
FL-14 Mack (R) 219,658 99,639 23,344 7,121 85,608
AZ-07 Grijalva (D) 214,773 31,852 14,353 7,048 154,255
NC-04 Price (D) 207,446 95,066 30,678 30,282 43,656
CA-44 Calvert (R) 205,748 15,323 8,961 36,006 142,532
CA-25 McKeon (R) 205,552 – 11,603 33,418 23,554 156,518
TX-21 Smith (R) 205,024 69,035 13,983 15,086 102,114
FL-12 Ross (R) 202,103 38,827 46,963 8,079 101,630
TX-28 Cuellar (D) 200,565 25,648 3,741 3,060 166,375
TX-23 Canseco (R) 196,502 36,500 8,704 8,756 139,265
TX-04 Hall (R) 194,642 93,402 19,450 12,972 60,583
GA-09 Graves (R) 193,905 116,666 8,550 9,842 53,801
ID-01 Labrador (R) 193,008 141,065 2,289 3,448 39,020

Population Change by CD and by County

With the Census Bureau having completed its gradual rollout of data from all the states last week, I’ve finally gotten around to assembling data from all the various congressional districts into one place. While the actual population gain or loss in each district isn’t as important a number, for SSP purposes, as the number of people each district will need to shed or gain as part of the redistricting process (which you can see in the various posts we did as each state’s data came out), the overall gain and loss is an important part in the overall picture of where people are moving to and from (and where they’re being born). Just the numbers of people moving in or out isn’t as helpful as knowing who exactly these people are, and we’ll delve a little more deeply into the changing racial compositions of the CDs in the next day or two… but for now, here are the overall population change numbers.

You’re probably noticing, “Wow, that’s a lot of Republican districts.” That’s certainly true, but these are also districts that (as we’ll see when we talk about changing racial composition), for the most part, aren’t becoming more Republican; people tend to bring their values with them rather than undergoing some magical David Brooksian conversion experience once they move in from the city, the inner-ring suburbs, or another country. Some of these districts are ones where much of the gains are Hispanic (like NV-03 or TX-10, or just about any California district on the list); in the case of GA-07, it’s becoming more African-American. That isn’t to say that these are all on the verge of becoming blue, of course; with much of these districts’ non-white populations under 18, it’ll be a gradual process. And redistricting is likely to de-diversify at least some of these districts, with some of the closer-in suburban portions of these districts (note that many of these districts are the ones right on the cusp of suburb and exurb) to be given to lower-population urban districts that need to expand outward, with the remaining parts of the districts staying red. (GA-07, again, is a case in point; the innermost parts of Gwinnett County, which are pretty diverse today, probably will need to get added on to underpopulated GA-05, leaving the rest of the district in very Republican-friendly condition.)

You may recall I did this same thing a year and a half ago when the 2008 estimates came out; there’s been very little change to the list since then, although with some swapping of places. Despite its position at the absolute epicenter of the housing bubble, NV-03 moved up from 4th to 1st place, past the two Arizona districts and TX-10. Districts that fell out of the top 25 in 2008 include GA-06, TX-03, CO-06, FL-25, IL-14, and FL-06, replaced by VA-10, FL-12, TX-28, TX-23, TX-04, and ID-01.

District Rep. 2000 2010 Change
NV-03 Heck (R) 665,345 1,043,855 378,510
AZ-02 Franks (R) 641,435 972,839 331,404
AZ-06 Flake (R) 641,360 971,733 330,373
TX-10 McCaul (R) 651,523 981,367 329,844
FL-05 Nugent (R) 639,719 929,533 289,814
CA-45 Bono Mack (R) 638,553 914,209 275,656
GA-07 Woodall (R) 630,511 903,191 272,680
TX-26 Burgess (R) 651,858 915,137 263,279
TX-22 Olson (R) 651,657 910,877 259,220
TX-31 Carter (R) 651,868 902,101 250,233
NC-09 Myrick (R) 619,705 852,377 232,672
VA-10 Wolf (R) 643,714 869,437 225,723
UT-03 Chaffetz (R) 744,545 966,232 221,687
FL-14 Mack (R) 639,298 858,956 219,658
AZ-07 Grijalva (D) 640,996 855,769 214,773
NC-04 Price (D) 619,432 826,878 207,446
CA-44 Calvert (R) 639,008 844,756 205,748
CA-25 McKeon (R) 638,768 844,320 205,552
TX-21 Smith (R) 651,930 856,954 205,024
FL-12 Ross (R) 640,096 842,199 202,103
TX-28 Cuellar (D) 651,259 851,824 200,565
TX-23 Canseco (R) 651,149 847,651 196,502
TX-04 Hall (R) 651,500 846,142 194,642
GA-09 Graves (R) 629,678 823,583 193,905
ID-01 Labrador (R) 648,922 841,930 193,008

And here are the biggest losers, looking every bit as heavily Democratic as the list of gainers is Republican. However, if you go through the list line by line, you’ll notice that very few of these districts are even remotely-considered as being on the chopping block. That’s partly because many of these are VRA seats, or otherwise set up by Republican legislatures as Democratic vote sinks (PA-14, for example). The most obvious exceptions up for elimination are PA-12, which almost everyone concedes is gone with the wind, OH-10, which is set to get mashed with OH-13, and possibly IL-17, ironically one of the few GOP-held seats on the list (although it might instead wind up getting turned into a significantly bluer district by the now-Dem-controlled Illinois legislature). Instead, as I mentioned earlier, many of these districts are going to wind up reaching out further into the suburbs… in many cases, expanding to follow the same constituents who just moved out of the city (for instance, all the Detroit residents who moved across 8 Mile into MI-12).

District Rep. 2000 2010 Change
LA-02 Richmond (D) 639,048 493,352 – 145,696
MI-13 Clarke (D) 662,844 519,570 – 143,274
MI-14 Conyers (D) 662,468 550,465 – 112,003
OH-11 Fudge (D) 630,668 540,432 – 90,236
IL-01 Rush (D) 654,203 587,596 – 66,607
PA-14 Doyle (D) 645,809 584,493 – 61,316
IL-04 Gutierrez (D) 653,654 601,156 – 52,498
IL-02 Jackson (D) 654,078 602,758 – 51,320
MS-02 Thompson (D) 710,996 668,263 – 42,733
NY-28 Slaughter (D) 654,464 611,838 – 42,626
MO-01 Clay (D) 621,497 587,069 – 34,428
PA-12 Critz (D) 646,419 612,384 – 34,035
AL-07 Sewell (D) 635,631 603,352 – 32,279
OH-01 Chabot (R) 630,545 598,699 – 31,846
OH-10 Kucinich (D) 631,003 599,205 – 31,798
OH-17 Ryan (D) 630,316 600,111 – 30,205
CA-31 Becerra (D) 639,248 611,336 – 27,912
MI-05 Kildee (D) 662,584 635,129 – 27,455
MI-12 Levin (D) 662,559 636,601 – 25,958
NY-27 Higgins (D) 654,200 629,271 – 24,929
IL-09 Schakowsky (D) 653,117 628,859 – 24,258
NY-11 Clarke (D) 654,134 632,408 – 21,726
TN-09 Cohen (D) 631,740 610,823 – 20,917
IL-17 Schilling (R) 653,531 634,792 – 18,739
PA-02 Fattah (D) 647,350 630,277 – 17,073

Much more over the flip…

Now, let’s switch over to counties. Counties are a unit of analysis that don’t get talked about at SSP as much as congressional districts, despite the fact that they’re more useful for talking about historical trends because their boundaries (almost) never change over the decades; the rationale, I suppose, is that much of the nation’s population lives in huge counties that contain multiple (or in the case of Los Angeles County, more than a dozen) CDs, so in many cases it’s not as granular a sort (and conversely, counties turn into too-granular a sort if you’re interested in, say, Kansas or west Texas).

Still, looking at which counties gained the most population in raw numbers, it provides an interesting counterpoint to the biggest-gaining CDs. While you’d get the impression of impending utter Republican dominance by looking at the party IDs of which CDs have excess population to shed, looking at the nation’s largest counties shows that, when you balance out the parts and pieces that make up the various CDs, many of the counties have very swingy results at the presidential level. I was also planning to look at changes in racial composition by county as well as by CD in the coming days, so it’ll also become quite evident (if you hadn’t already mentally extrapolated from which CDs are in which counties) that much of the growth coming in these fastest-growing counties is coming from non-whites.

County 08 Results 2000 2010 Change
Maricopa, AZ 44/54 3,072,149 3,817,117 744,968
Harris, TX 50/49 3,400,578 4,092,459 691,881
Riverside, CA 50/48 1,541,387 2,189,641 644,254
Clark, NV 58/39 1,375,765 1,951,269 575,504
Tarrant, TX 44/55 1,466,219 1,809,034 362,815
San Bernardino, CA 52/46 1,709,434 2,035,210 325,776
Bexar, TX 52/47 1,392,931 1,714,773 321,842
Los Angeles, CA 69/29 9,519,338 9,818,605 299,267
Collin, TX 37/62 491,675 782,341 290,666
San Diego, CA 54/44 2,813,833 3,095,313 281,480
Wake, NC 57/42 627,846 900,993 273,147
Orange, FL 59/40 896,344 1,145,956 249,612
Miami-Dade, FL 58/42 2,253,362 2,496,435 243,073
Fort Bend, TX 48/51 354,452 585,375 230,923
Hillsborough, FL 53/46 998,948 1,229,226 230,278
Denton, TX 37/62 432,976 662,614 229,638
Mecklenburg, NC 62/37 695,454 919,628 224,174
Gwinnett, GA 44/55 588,448 805,321 216,873
Travis, TX 64/34 812,280 1,024,266 211,986
Hidalgo, TX 69/30 569,463 774,769 205,306
Pinal, AZ 42/56 179,727 375,770 196,043
Sacramento, CA 58/39 1,223,499 1,418,788 195,289
King, WA 70/28 1,737,034 1,931,249 194,215
Palm Beach, FL 61/38 1,131,184 1,320,134 188,950
Kern, CA 40/58 661,645 839,631 177,986

The counties with the biggest numeric loss, on the other hand, are almost all Democratic ones with a few exceptions from the New Orleans suburbs. Some are Dem strongholds that are just intensifying (like Cook County, home of Chicago, whose blueness we kind of take for granted these days… Mike Dukakis won it only 56-43). Others are onetime solid Dem counties that have turned swingy as older ex-unionists die off and educated young voters book their tickets elsewhere (like the western Pennsylvania and West Virginia counties).

County 08 Results 2000 2010 Change
Wayne, MI 74/25 2,061,162 1,820,584 – 240,578
Cook, IL 76/23 5,376,741 5,194,675 – 182,066
Orleans, LA 79/19 484,674 343,829 – 140,845
Cuyahoga, OH 69/30 1,393,978 1,280,122 – 113,856
Allegheny, PA 57/42 1,281,666 1,223,348 – 58,318
Hamilton, OH 53/46 845,303 802,374 – 42,929
St. Bernard, LA 26/71 67,229 35,897 – 31,332
Erie, NY 58/40 950,265 919,040 – 31,225
Baltimore city, MD 87/12 651,154 620,961 – 30,193
St. Louis city, MO 84/16 348,189 319,294 – 28,895
Montgomery, OH 52/46 559,062 535,153 – 23,909
Jefferson, LA 36/62 455,466 432,552 – 22,914
Mahoning, OH 62/36 257,555 238,823 – 18,732
St. Louis, MO 60/40 1,016,315 998,954 – 17,361
Trumbull, OH 60/37 225,116 210,312 – 14,804
Lucas, OH 65/33 455,054 441,815 – 13,239
Fayette, PA 49/50 148,644 136,606 – 12,038
Washington, MS 67/32 62,977 51,137 – 11,840
Beaver, PA 48/50 181,412 170,539 – 10,873
Genesee, MI 65/33 436,141 425,790 – 10,351
Saginaw, MI 58/40 210,039 200,169 – 9,870
Essex, NJ 76/23 793,633 783,969 – 9,664
Hampton city, VA 69/30 146,437 137,436 – 9,001
Cambria, PA 49/48 152,598 143,679 – 8,919
Kanawha, WV 49/49 200,073 193,063 – 7,010

While looking at congressional districts by percentage of change isn’t that interesting (as they all start from a very similar baseline, giving you almost the same results as raw numeric change), it’s worth a deeper look with counties, because counties come in a wide variety of sizes and the fastest-gainers by population don’t dovetail much with the fastest-gainers by percentage. The percentage gainers tend to smaller counties that are poised at the very edge of metropolitan growth, making the transition from rural to exurban. Case in point: #1 Kendall County, which is where you wind up if you find already-exurban Kane County and then head south, to where Chicagoland meets the prairie. The bigger-name counties on this list, like Loudoun County, Virginia, Douglas County, Colorado, and Collin and Fort Bend Counties, Texas, are some of the archetypal exurbs of decades past, which are starting to diversify and make the stylistic transition from exurb to outer-ring suburb… and their voting patterns are starting to change too, with Loudoun turning light-blue and Douglas and Collin still pretty red but making sharp moves in 2008.

County 08 Results 2000 2010 Change
Factor
Kendall, IL 53/46 54,544 114,736 2.10
Pinal, AZ 42/56 179,727 375,770 2.09
Flagler, FL 50/49 49,832 95,696 1.92
Lincoln, SD 42/57 24,131 44,828 1.86
Loudoun, VA 54/45 169,599 312,311 1.84
Rockwall, TX 26/73 43,080 78,337 1.82
Forsyth, GA 20/78 98,407 175,511 1.78
Sumter, FL 36/63 53,345 93,420 1.75
Paulding, GA 30/69 81,678 142,324 1.74
Sublette, WY 21/76 5,920 10,247 1.73
Henry, GA 46/53 119,341 203,922 1.71
Teton, ID 49/49 5,999 10,170 1.70
Williamson, TX 43/55 249,967 422,679 1.69
Fort Bend, TX 48/51 354,452 585,375 1.65
Union, NC 36/63 123,677 201,292 1.63
Douglas, CO 41/58 175,766 285,465 1.62
Dallas, IA 46/52 40,750 66,135 1.62
Newton, GA 50/49 62,001 99,958 1.61
Hays, TX 48/50 97,589 157,107 1.61
Collin, TX 37/62 491,675 782,341 1.59
Franklin, WA 37/61 49,347 78,163 1.58
Delaware, OH 40/59 109,989 174,214 1.58
Forest, PA 42/55 4,946 7,716 1.56
Osceola, FL 59/40 172,493 268,685 1.56
Montgomery, TX 23/76 293,768 455,746 1.55

Finally, here are the biggest losing counties by percentage. Unfortunately, beyond the obvious Orleans Parish (and several other smaller Louisiana parishes obliterated by hurricanes), it’s a bunch of counties that you’ve probably never heard of, most of which are very tiny. Beyond that, it tells us that blindingly-red western Kansas and western North Dakota are losing population, as well as the Texas and Oklahoma Panhandles… and also dark-blue, mostly-black rural counties in the Mississippi Delta, which was seen in MS-02’s population loss. The list continues on like that ad nauseam; the next county with a population over 100,000 is all the way down at #148: Wayne County, MI, which is 88% of its 2000 size. St. Louis city and Cuyahoga County, OH follow along at 92%.

County 08 Results 2000 2010 Change
Factor
St. Bernard, LA 26/71 67,229 35,897 0.53
Issaquena, MS 61/38 2,274 1,406 0.62
Cameron, LA 16/81 9,991 6,839 0.68
Orleans, LA 79/19 484,674 343,829 0.71
Sharkey, MS 68/31 6,580 4,916 0.75
Chattahoochee, GA 50/49 14,882 11,267 0.76
Sheridan, ND 29/69 1,710 1,321 0.77
Kiowa, KS 18/80 3,278 2,553 0.78
Towner, ND 52/45 2,876 2,246 0.78
Cimarron, OK 12/88 3,148 2,475 0.79
Cottle, TX 27/72 1,904 1,505 0.79
Jefferson, MS 87/12 9,740 7,726 0.79
Tensas, LA 54/45 6,618 5,252 0.79
Monroe, AR 47/51 10,254 8,149 0.79
King, TX 5/93 356 286 0.80
Culberson, TX 65/34 2,975 2,398 0.81
Esmeralda, NV 24/69 971 783 0.81
McDowell, WV 53/45 27,329 22,113 0.81
Jewell, KS 20/78 3,791 3,077 0.81
Claiborne, MS 86/14 11,831 9,604 0.81
Washington, MS 67/32 62,977 51,137 0.81
Lane, KS 19/79 2,155 1,750 0.81
Quitman, MS 67/32 10,117 8,223 0.81
Greeley, KS 20/79 1,534 1,247 0.81
Swift, MN 55/42 11,956 9,783 0.82

NY and ME: Population by CD

Today’s the last day of Census data releases, meaning we have the complete set of all 50 states now. The Census Bureau released some data summarizing the entire nation, including what you’d think was the single most important bit of all, considering the way they hyped the announcement: the new population center of the U.S., still in south-central Missouri, but moving 30 miles to the southwest, now near Plato, MO. Perhaps more interestingly, they summarized the country’s demographic change as a whole: that starts with the nation’s Hispanic population crossing the 50 million mark, now up to almost 17% of the nation’s population. Hispanics and Asians both grew at a 43% rate, and people checking “2 or more” races rose at a 32% rate. The non-Hispanic white share of the population fell from 69% to 64%. They also found a country that’s more urban than ever before, with 84% of the country living in metropolitan areas now.

I know you’re all champing at the bit to find out what happens in Maine, but there’s this other state called “New… Something” that we should probably get through first. New York is one of only two states to lose two seats, from 29 down to 27. (Ohio was the other one.) New York’s new target is 717,707, up from about 654K in 2000. Thanks to a few hundred votes in a couple of state Senate races that tipped that chamber’s balance, the GOP managed to hold on to one leg of the redistricting trifecta, meaning that instead of a shot at a 26-1 Dem map, there’s probably just going to be a shared-pain map instead with a GOP loss upstate and a Dem loss in the NYC metro area. That’s despite the fact that New York City itself actually grew a bit, to 8.175 million, still by far the nation’s largest city. (There are moves afoot toward an independent redistricting commission, but this doesn’t seem likely to happen.)

In general, the heaviest losses were in the western part of Upstate, with the state’s two biggest losers the Dem-held 27th (Buffalo) and 28th (Rochester). On the other hand, losses also popped up rather patchily in parts of the outer boroughs (especially the 11th in the black parts of Brooklyn… without much seniority, Yvette Clarke may wind up with the shortest straw among the NYC delegation) and Long Island (Peter King’s 3rd… which would be a prime target for the 2nd seat to evaporate, if only the Dems controlled the trifecta here). The big gainers were both urban (Jerry Nadler’s 8th, probably fueled not so much by growth in Manhattan as among Orthodox families in Borough Park in Brooklyn) and exurban (Nan Hayworth’s 19th, at the outermost reaches of the NYC metro area).

While none of the districts in New York seem to be undergoing the kind of rapid demographic transformation that threatens the red/blue balance in any place like we’ve seen in Texas or California, a few districts are worth looking at just as an indicator of what an interesting tapestry New York City is. Take the 5th for instance (another possibility for wipeout, given its strange position straddling Nassau County and Queens, and Gary Ackerman’s non-entity-ness): it’s moved from 44% non-Hispanic white, 5% non-Hispanic black, 24% non-Hispanic Asian, and 24% Hispanic, to 36% white, 4% black, 33% Asian, and 26% Hispanic, close to an Asian-plurality, thanks to growth in the Asian community in Flushing. A few districts in New York City are getting whiter, thanks to hipsters and gentrifiers: the 11th moved from 21% white and 58% black to 26% white and 53% black, while the 12th moved from 23% white and 49% Hispanic to 27% white and 45% Hispanic. The Harlem-based 15th went from 16% white, 30% black, and 48% Hispanic, to 21% white, 26% black, and 46% Hispanic, while the remarkably complex, Queens-based 7th went the other direction, from 28% white, 16% black, 13% Asian, and 40% Hispanic to 21% white, 16% black, 16% Asian, and 44% Hispanic.


District Rep. Population Deviation
NY-01 Bishop (D) 705,559 (12,148)
NY-02 Israel (D) 679,893 (37,814)
NY-03 King (R) 645,508 (72,199)
NY-04 McCarthy (D) 663,407 (54,300)
NY-05 Ackerman (D) 670,130 (47,577)
NY-06 Meeks (D) 651,764 (65,943)
NY-07 Crowley (D) 667,632 (50,075)
NY-08 Nadler (D) 713,512 (4,195)
NY-09 Weiner (D) 660,306 (57,401)
NY-10 Towns (D) 677,721 (39,986)
NY-11 Clarke (D) 632,408 (85,299)
NY-12 Velazquez (D) 672,358 (45,349)
NY-13 Grimm (R) 686,525 (31,182)
NY-14 Maloney (D) 652,681 (65,026)
NY-15 Rangel (D) 639,873 (77,834)
NY-16 Serrano (D) 693,819 (23,888)
NY-17 Engel (D) 678,558 (39,149)
NY-18 Lowey (D) 674,825 (42,882)
NY-19 Hayworth (R) 699,959 (17,748)
NY-20 Gibson (R) 683,198 (34,509)
NY-21 Tonko (D) 679,193 (38,514)
NY-22 Hinchey (D) 679,297 (38,410)
NY-23 Owens (D) 664,245 (53,462)
NY-24 Hanna (R) 657,222 (60,485)
NY-25 Buerkle (R) 668,869 (48,838)
NY-26 Vacant 674,804 (42,903)
NY-27 Higgins (D) 629,271 (88,436)
NY-28 Slaughter (D) 611,838 (105,869)
NY-29 Reed (R) 663,727 (53,980)
Total: 19,378,102

Now for the maine event! (Rim shot.) Maine’s a lot like Rhode Island and New Hampshire in that the long-standing boundary between its two districts rarely seems to budge much, and this year won’t be any different. Maine’s target is 664,181, up from 637K in 2000. The disparity of a little more than 4,000 people means things won’t change much; the Republicans control the redistricting process this year but there’s not a lot of fertile material here for them to try to make swingy ME-02 much redder.


District Rep. Population Deviation
ME-01 Pingree (D) 668,515 4,334
ME-02 Michaud (D) 659,846 (4,335)
Total: 1,328,361

RI, SC, and WV: Population by CD

Rhode Island doesn’t offer much for redistricting fans to sink their teeth into: it has two districts that are about equally blue, the Dems control the redistricting trifecta, and the disparity between the two districts, while not New Hampshire-close, requires only minimal boundary-shifting. Rhode Island’s target is a tiny 526,284 (only up from 524K in 2000… Rhode Island had the smallest growth, percentage-wise, of any state over the decade, putting it 2nd overall behind only Michigan, which actually lost population). If this continues, there’s the distinct possibility we could see Rhode Island reduced to one House seat come 2020. Also worth noting: Rhode Island had a lot of Hispanic growth over the decade, not quite on par with the Southwest but high for the Northeast; it went from 8.5% Hispanic to 12.4%, and Providence moved to a Hispanic plurality.


District Rep. Population Deviation
RI-01 Cicilline (D) 519,021 (7,263)
RI-02 Langevin (D) 533,546 7,263
Total: 1,052,567

South Carolina is gaining one seat to move from six to seven; its new target based on 7 seats is 660,766 (it was 668K in 2000, so every district gained significantly over the decade). With the GOP holding the trifecta and much of the growth seeming to come among white retirees, look for the creation of one more Republican-friendly seat… with one possible wild card, that the Obama DOJ might weigh in and push for a second African-American VRA seat (theoretically possible if terribly ugly, as SSP’s crack team of freelance mapmakers have shown here). The biggest growth has come in the coastal Low Country, rather than the fiercely evangelical uplands; I’d expect Charleston and Myrtle Beach, both part of SC-01 for now, to wind up each anchoring their own districts.


District Rep. Population Deviation
SC-01 Scott (R) 856,956 196,190
SC-02 Wilson (R) 825,324 164,558
SC-03 Duncan (R) 722,675 61,909
SC-04 Gowdy (R) 770,226 109,460
SC-05 Mulvaney (R) 767,773 107,007
SC-06 Clyburn (D) 682,410 21,644
Total: 4,625,364

West Virginia is staying at three seats for now, although it might be headed for two seats in 2020, given its slow growth and low targets; its target is 617,665, only up from 603K in 2000. The 3rd, in coal country in the southern part of the state, is losing population (though not as fast as one might suspect); the 2nd needs to shed an amount equivalent to what the 3rd needs to gain, leaving the 1st pretty stable. Much of the state’s growth is in the far east tip of the Panhandle (in the 2nd), especially Berkeley County, which serves as Washington DC’s furthest-out exurbs. Dave Wasserman, who seems to get all the good redistricting-related gossip, says that while the obvious solution (moving Mason County from the 2nd to the 3rd, and calling it a wrap) still seems likely, the Dems who control the redistricting trifecta might want to cobble together a slightly Dem-friendlier 1st along the state’s northern boundary that includes both Morgantown and the Panhandle exurbs (the only counties in the state that are getting bluer).


District Rep. Population Deviation
WV-01 McKinley (R) 615,991 (1,674)
WV-02 Capito (R) 648,186 30,521
WV-03 Rahall (D) 588,817 (28,848)
Total: 1,852,994