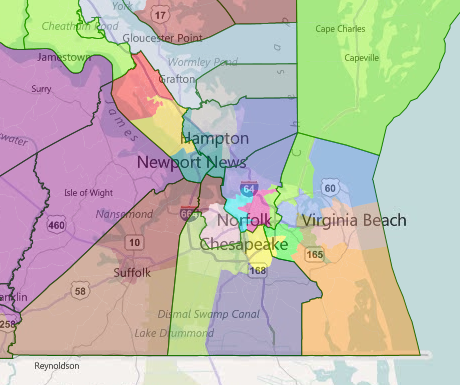
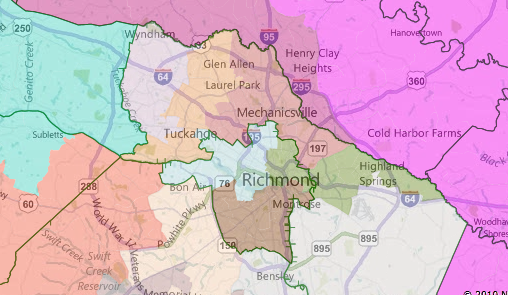
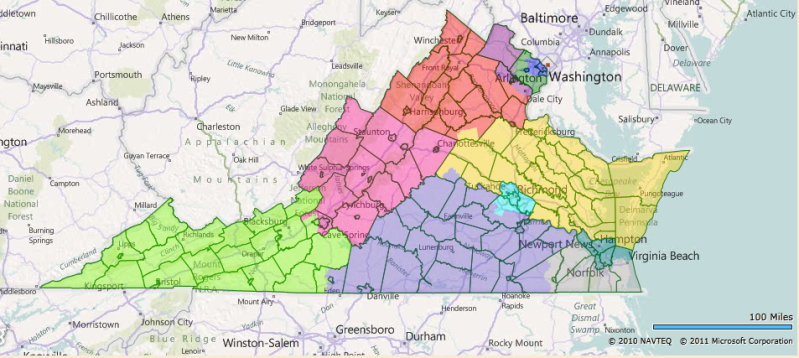
Virginia fair maps, Congress, State Senate and State House

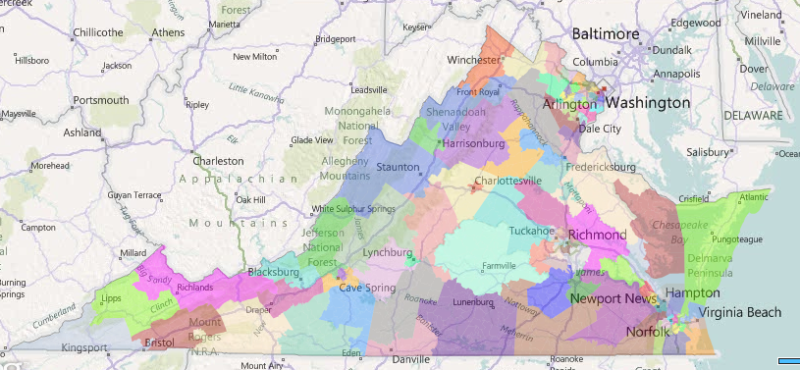
With all the talk by Virginia Gov Bob McDonnell about fair redistricting, I thought it would be interesting to make a map that is actually fair. However, instead of just doing a congressional map, I did a State House and State Senate map as well. Do to the fact that it is 150 districts, I will not be giving information on each like i usually do. Instead, i just did a count and classified each district. Any district with less than 45% Obama is Safe R, 45-49.9 is Likely R, 50-53.9 is Lean R, 54-56 is Toss-Up, 56.1-59.9 is Lean D, 60-64.9 is Likely D, 65 and up is Safe D.

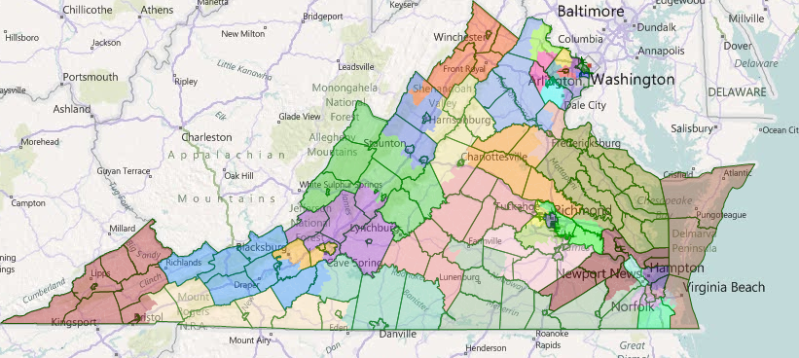
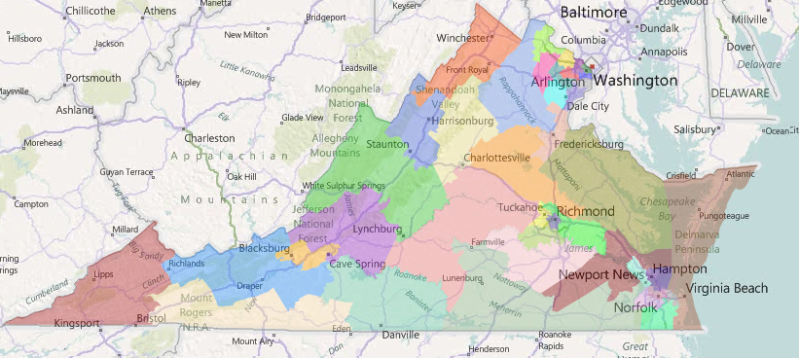
First up, the plan for the Congressional seats.


3 Safe R, 3 Likely R, 1 Toss Up, 2 Lean D, 2 Safe D.

That would be 3 Probably R, 2 Probably D, and 3 Competitive seats.

State Senate Plan


15 Safe R, 3 Likely R, 5 Lean R, 4 Toss-Ups, 2 Lean D, 7 Likely D, 4 Safe D.

That would be 18 Probably Republican, 11 Probably Democrat, and 11 Competitive.

State House


31 Safe R, 16 Likely R, 8 Lean R, 9 Toss-Ups, 10 Lean D, 12 Likely D, 14 Safe D.

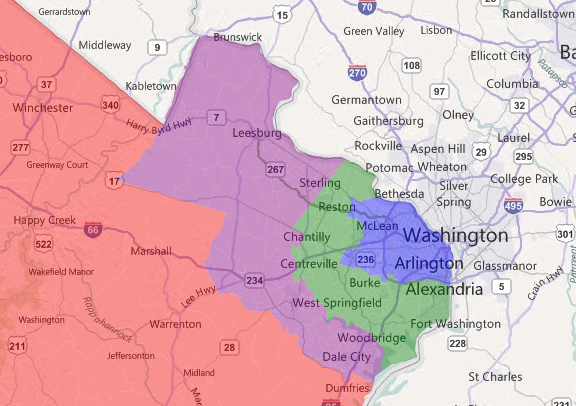
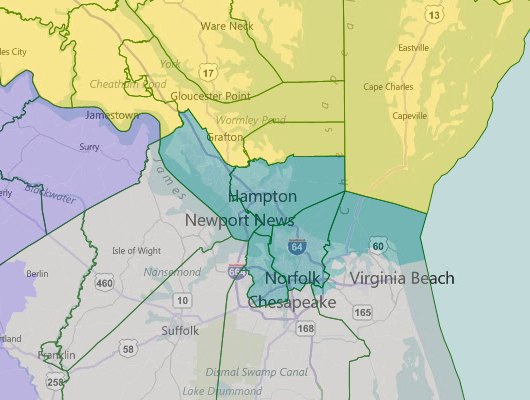
47 Probably Republican, 26 Probably D, 27 Competitive.

My initial reaction was one of surprise, as I thought the seat count would be more even. But as I thought about it, Virginia was closer than the nation as a whole, so if we use the nation as a whole as the way to determine how safe a district is, we of course get this result. If you assume 08 is closer to the truth, dems would win almost all of the “competitive” districts. If we assume it is more like 2010, than those would go to republicans. If you want more info on any districts or VRA or any of that good stuff, lemme know.

Virginia 9-2-1

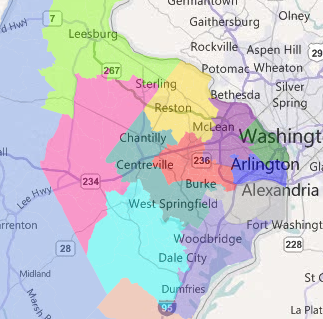
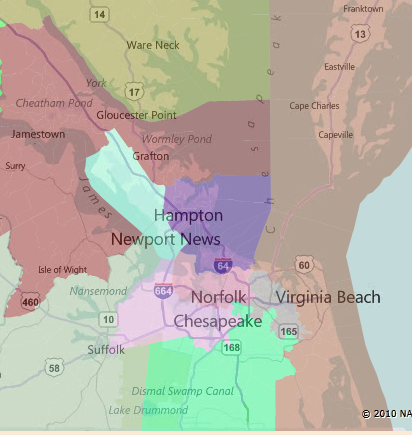
Virginia was really bad for democrats in 2010 (what state wasn’t?). The republicans picked up the 2nd, 5th, and 9th. As I am a democrat I usually make maps leaning that way so I decided to make a republican map. This is an 8-2-1 map and preserves the VRA district while weakening only Morgan Griffith and Cantor a bit.  It’s not perfect but I think it pretty good. For those who don’t know, in the individual district pictures, light green is new district only, pink is old only, and the darkish green is areas in both.


District 1


Incumbent: Rob Wittman

New Stats:

Deviation from Target: 176

Obama: 47.8%

McCain: 52.2%

Dem: 44.6%

GOP:  55.6%

White: 67.2 %

Black: 20.6 %

Hispanic: 6.3%

Old Stats:

Deviation from Target: 45,520

Obama: 48.4%

McCain: 51.6%

Dem: 44.8%

GOP:  55.2%

White: 67.7 %

Black: 19.6 %

Hispanic: 6.8%

The 1st had to lose some population and so it moved a bit, but it is largely unchanged with the exception of taking up a little more of the suburbs in SE Virginia.  Likely R

District 2:


Incumbent: Scot Rigell

New Stats:

Deviation from Target: -26

Obama: 49.2%

McCain: 50.8%

Dem:  46.4%

GOP:  53.6%

White: 65.7%

Black: 20.4%

Hispanic: 6.0%

Old Stats:

Deviation from Target:  -70,482

Obama:  52.4%

McCain: 47.6%

Dem: 49.1%

GOP:  50.9%

White: 62.6%

Black: 21.7%

Hispanic: 6.9%

Nye was elected on the backs of two very poor republican congressmen. While he is young, attractive, and from Philadelphia (awww yeah), with this new district he would not have won in 08. Rigell’s biggest worry is the primary with his donations to Obama and all that jazz. This seat mainly took what district one gave up.  Likely R

District 3:


Incumbent: Robert Scott

New Stats:

Deviation from Target:  -267

Obama: 82.2%

McCain: 17.8%

Dem:  76.9%

GOP:  23.1%

White: 28.9%

Black: 61.0%

Hispanic: 5.3%

Old Stats:

Deviation from Target: -53,960

Obama: 75.7%

McCain: 24.3%

Dem:  28.7%

GOP:  71.3%

White: 36.2%

Black: 53.7%

Hispanic: 5.0%

Mr. Scott would probably be happy with this district as it gets more black and democratic. The district did have to pick up people, and it did this by snaking to as many areas of strength as possible.  I have to say it is horrendous looking. The VRA  mapping standards I have mixed feelings about… Yes they are good for protecting the rights of minorities. This though? Ugh. Safe D

District 4:


Incumbent: Randy Forbes

New Stats:

Deviation from Target:  -255

Obama: 48.8%

McCain:  51.2%

Dem: 46.4%

GOP:  53.6%

White: 61.7%

Black: 28%

Hispanic: 5.3%

Old Stats:

Deviation from Target:

Obama: 51.0%

McCain: 49.0%

Dem:  48.2%

GOP:   51.8%

White: 57.8%

Black: 33.2%

Hispanic: 4.5%

Randy Forbes is unfortunately a skilled politician.  While he wins in a current Obama district easily, I don’t think anyone in the GOP would mind his district getting a bit safer. The only serious challenge he had was his first against Louise Lucas in the 2001 special election. Likely R.

District 5:


Incumbent: Robert Hurt

New Stats:

Deviation from Target: 122

Obama:  43.3%

McCain:  56.7%

Dem: 42.7%

GOP:  57.3%

White: 75.1%

Black: 19.5%

Hispanic: 2.7%

Old Stats:

Deviation from Target: -39,711

Obama:  48.5%

McCain:  51.5%

Dem: 47.3%

GOP:  52.7%

White: 71.7%

Black: 21.9%

Hispanic: 3.1%

5 is the most important district. Perriello is not in this district, and half of his base in Charlottesville is gone. Included, however is Rick Boucher.  Neither Boucher or Perriello has much to run, as they both have a lot of new constitutions AND the district is 5 points more republican than it was before.  Safe R unless Perriello or Boucher run, than Likely R.

District 6:


Incumbent: Bob Goodlatte

New Stats:

Deviation from Target: -43

Obama:  43.9%

McCain: 56.1%

Dem: 42.8%

GOP:  57.2%

White: 81.5%

Black: 10.9%

Hispanic: 4.2%

Old Stats:

Deviation from Target: -23,285  

Obama:  43.2%

McCain: 56.8%

Dem: 42.1%

GOP:  57.9%

White: 81.2%

Black: 11.1%

Hispanic: 4.3%

This close save district remains close to safe. Little changes, mostly just to fill in where other districts no longer are because it was lacking population. Likely R.

District 7:


Incumbent: Eric Cantor

New Stats:

Deviation from Target: -601

Obama: 48.1%

McCain:  51.9%

Dem:  43.4%

GOP:  56.6%

White: 68.9%

Black: 14.5%

Hispanic: 8.6%

Old Stats:

Deviation from Target: 25,081

Obama: 46.6%

McCain: 53.4%

Dem: 43.3%

GOP:  56.7%

White: 72.3%

Black: 16.7%

Hispanic:  4.8%

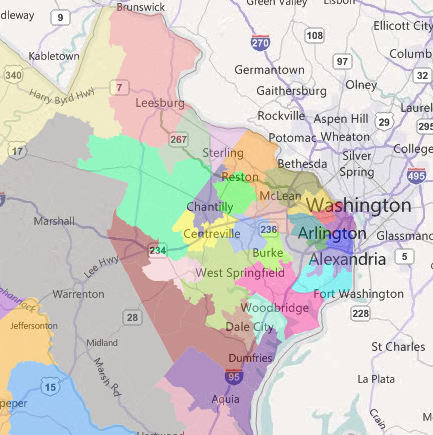
Snaking into Prince William to shore in place of 1 and 11, the partisan numbers actually don’t change all that much as the district loses parts of Richmond. I kept in the most conservative precincts because I figure that’s where Cantor lives. Cantor should be fine. Likely R

District 8:


Incumbent:  Jim Moran

New Stats:

Deviation from Target: 531

Obama: 68.2%

McCain: 31.8%

Dem:  67.7%

GOP:  33.3%

White:  53.9%

Black: 13.2%

Hispanic: 18.4%

Asian: 11.4%

Old Stats:

Deviation from Target: -27,688

Obama:  68.2%

McCain: 31.8%

Dem: 67.7%

GOP:  33.3%

White: 54.4%

Black: 13.3%

Hispanic: 18.4%

Asian: 10.7%

Almost unchanged, just look at demographics. Safe D

District 9:


Incumbent: Morgan Griffiths

New Stats:

Deviation from Target: -196

Obama: 43.4%

McCain: 56.6%

Dem: 45.7%

GOP:  54.3%

White: 88.8%

Old Stats:

Deviation from Target:  -72,764

Obama: 40.3%

McCain: 59.7%

Dem: 43.7%

GOP:  56.3%

White: 92%

The district had to gain people and Griffith’s home of Salem. The district got more democratic by taking in parts of Charlottesville and some of its suburbs to weaken cut Periello’s base in two. Periello resides in this district but might still choose to run in the 5th.   Likely R, will move to Safe fairly soon as Griffith’s gains name recognition throughout the district.

District 10:


Incumbent: Frank Wolf

New Stats:

Deviation from Target: -98

Obama: 49.4%

McCain: 50.6%

Dem: 48.1%

GOP:  51.9%

White: 66.9%

Hispanic: 10.7%

Asian: 13.5%

Old Stats:

Deviation from Target: 144,282

Obama: 50.2%

McCain: 49.8%

Dem: 47.2%

GOP:  52.8%

White: 63.8%

Hispanic: 13.5%

Asian: 12.4%

Wolf has won for 30 years straight, usually with ease. His district is now a McCain district but it only moved by about .8%. Lean/Likely R

District 11:


Incumbent: Gerry Connolly

New Stats:

Deviation from Target: 645

Obama: 55.6%

McCain: 44.4%

Dem: 50.5%

GOP:  49.5%

White: 54.4%

Black:  10.2%

Hispanic: 16.9%

Asian: 14.9%

Old Stats:

Deviation from Target: 62,964

Obama: 56.6%

McCain: 43.4%

Dem: 52.3%

GOP:  47.7%

White: 55.0%

Black: 11.1%

Hispanic: 15.4%

Asian: 14.9%

This district becomes more swingy by taking away some liberal territory like Dale City and giving to Eric Cantor. Leans slightly D but I’d call it a toss-up. Connolly would have lost in 2010 with this district.

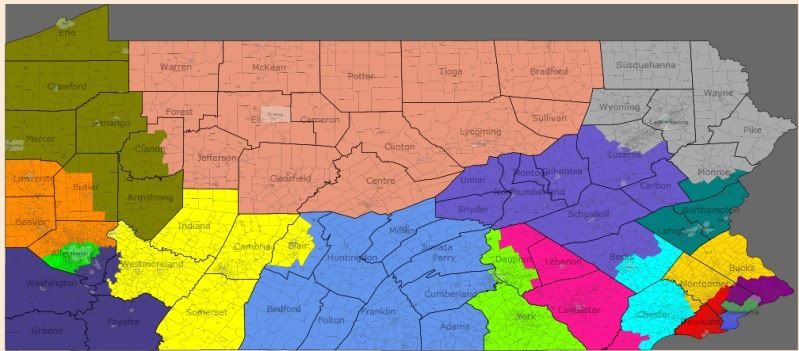
5-7-6 PA Gop compromise/fair districts

I made a map with two goals. They were:

1.) Keep cities together, and if possible, counties

2.) Make the district without care for partisanship

Philadelphia is the only city in more than one cd, and only four counties have 3 or more cds in them (Allegheny, Philadelphia, Chester, and Montgomery. 4 out of 69 aint bad, considering that Philadelphia has to be.)

There is high upside here for both parties, and this is a decent compromise, although more favorable to the republicans. It comes down to if you believe 2008 or 2010 is the closer to reality.

I really only think one picture is necessary due to the nature of this exercise. If anyone wants a zoomed view, lemme know. All are under 1000 off the ideal population.

District 1 (Blue): 53% Black, 88% Obama

Entirely Philadelphia. Safe as could be. 1-0-0

District 2 (Green): 36% B, 14 Hispanic, 5 Asia, 80% O

Entirely Philadelphia. Safe as could be. 2-0-0

District 3 (Dark Magenta): 58% O

North-East Philly, and parts of Montgomery and Bucks. Leans very D. 3-0-0

District 4 (Red): 61% O

Delco and a part of montco. Likely D. 4-0-0

District 5 (Gold): 54% O

Rest of Montgomery and Bucks, plus a tiny bit of chester. Toss-up, Leans slightly R. 4-0-1

District 6 (Teal): 56% O

Bethlehem, Allentown, Easton and their counties, plus a bit of monroe. Toss-up, Leans slightly D. 4-0-2

District 7 (Dark Grey): 56% O

Scranton, Wilkes-Barre and the surrounding area. Toss-Up, Leans slightly D. 4-0-3

District 8 (Slate Blue): 53% M

A few small cities (Hazelton, Bloomsburg, Pottsville), but a lotta empty area. Likely R. 4-1-3

District 9 (Cyan): 55% O

Reading, the rest of Berks and a huge part of chester county. Pure Toss-Up 4-1-4

District 10 (Deep Pink): 56% M

Lancaster, Lebanon and space. Likely R. 4-2-4

District 11 (Chartreuse): 51% M

Harrisburg and York. Lean M. 4-3-4

District 12 (Cornflower Blue): 63% M

Not a lot going on here. Safe R. 4-4-4

District 13 (Dark Salmon): 54% M

North PA. Surprised it is this close tbqh. Likely R. 4-5-4

District 14 (Olive): 49% O (Wins by about 600 votes).

Erie. Toss-Up, Leans R. However, I think obama underperformed what a congressional D could do here so i’m counting it in the toss-up.  4-5-5

District 15 (Dark Orange): 55% M

North of Pitt. Likely R. 4-6-5

District 16 (Lime): 64% O

Pittsburgh. Safe D. 5-6-5

District 17 (Dark Slate Blue): 50% O

South of Pitt. Toss-Up, Leans R. 5-6-6

District 18 (Yellow): 56% M

The rest, includes Altoona. Likely R. 5-7-6.

Not the best either side could do, but most definitely fair. Both sides have reason to believe they could win a lot of the toss-ups. I hope the gopers believe that anyways. Well, lemme know.

36-0 Texas

The hardest thing for me to remember when making GOP friendly gerrymanders is that a 50% John MctCain district isn’t a toss-up but a likely R district, similar in theory to a 60% Obama District. 5 points more friendly to the gop then the nation as an average implies that, but it is somewhat tricky for me, at least, to wrap my mind around it. However, that was my goal when I started North Carolina: create as many districts that went GOP in 08 as possible. After getting an 11-2 in a state that went for Obama, i figured a 36-0 in Texas was possible. and it was. One district voted for Obama by less than 1000 votes, so I’m going to count it. A 59% Obama district would be okay for most of us here… Without further ado, MAPS!

As always, ask me and i will provide a zoomed in map of whatever area you wish if it isn’t clear from the big one.

http://img.photobucket.com/alb…

http://img.photobucket.com/alb…

El Paso: http://img.photobucket.com/alb…

District 1 (Blue):  Mccain 56%, 56% Hispanic

El Paso and Odessa

District 2 (Green): M 53%, 63% H

Rest of El Paso and some nearby counties

San Antonio and Austin: http://img.photobucket.com/alb…

District 3 (Purple): M 50%, 60% H

South San Antonio

District 4 (Red): M 51%, 50% H

North and West Antonio

District 5 (Yellow):  M 51%, 40% H, 10% Black, 3% Asian

East and North San Antonio

District 6 (Teal): M 50%, 72% H

Laredo and some Border counties, then up to West Texas

District 7 (Gray): M 50%, 66% H

McAllen and Border areas all the way up to Bastrop and Fayette Counties

District 8(Violet) M 51%, 62% H

Brownsville, Mcallen and then up.

District 9(Sky Blue): M 51%, 59%  H

Brownsville, Harlingen, up to Williamson and Milam counties.

District 10 (Pink):  M 50%, 35% H, 16% B, 3% A

Corpus Christi and up

Houston:  http://img.photobucket.com/alb…

District 11 (Lemon-Lime Green): M 55%,  55% White

South of  Houston

District 12 (Blue-Line Green) :  M 56%, 22% H, 20% H, 11% A

Some of the south-west of Houston and then surroundin areas.

District 13(Light Brown): M 53%, W 52%

Houston and some areas north

District 14(Gold):  M 57%,  W 61%

Houston and some areas north

District 15 (Orange): M 52%, 32% H, 19% B, 4% A

South of Houston, with a bit of the city

District 16(Lime Green):  M 52%, 39% H, 12% B, 4% A

Houston and Areas East

District 17(Navy blue): M 52%, 41% H,  16% B

Houston and Areas North East

District 18 (Golden Yellow):  M 56%, 56% W

North of Houston

District 19 (Puke Green): M 56%, 65% W

Wraps around 11-17

District 20 (Light Pink): M 52%, 59% W

Wraps around Austin and takes part of the city then to Abilene

District 21 (Blood Red): M 54%, 66% W

Parts  of Austin then  going to sparsely populated Northern Texas

District 22 (Poo Brown):  M 51%, 79% W

Austin and North Texas

Dallas-FW: http://img.photobucket.com/alb…

District 23 (Robin’s Egg Blue): M 54%, 57% W

Dallas and some northern suburbs

District 24 (Dark Purple):  M 56%, 59% W

Dallas and Some Eastern areas

District 25 (Rose): M 54%,  59% W

Dallas then to some less populated eastern areas

District 26 (Silver) M 58%,   54% W

Dallas, FW, then to North Texas

District 27 (Sea Green) M 49%, 54% W

Dallas, FW, then to North Texas

District 28 (Pinkish Purple) M 60%, 57% W

Irving, then up to North Texas

District 29 (Gray Green): M 53%, 60% W

Waco and Forth Worth

District 30 (slightly lighter shade of rose then

the one touching it): M 55%, 60% W

Parts of Arlington, Dallas and Fort Worth

District 31 (Tan): M 61%, 71% W

North Fort Worth and Dallas then North

District 32 (Red Orange): M 64%, 79% W

North FW and then northern areas surrounding it

District 33 (I can’t name that many different shades of blue): M 63%, 80% W

North of Dallas

District 34 (Somewhat dark-green): M 69%, 75% W

Wraps around a lot of other districts, filling in a lot of gaps

District 35 (Royal Purple): M 62%, 64% W

Everything Else Part 1

District 36 (Not Flyers Orange, but I’m using it anyways): M 68%, 69% W

Everything Else, Part 2

This is not a perfect 36-0 Map. The last 5-6 districts could bleed some republican voters to some of the more borderline districts. However, in an ok to good year, the republicans win all 36 seats barring an exceptional democratic candidate.

Dave’s seems to have deleted my other maps. I’ll redo them later and either edit this diary or do a new one, depending on what you guys thing.
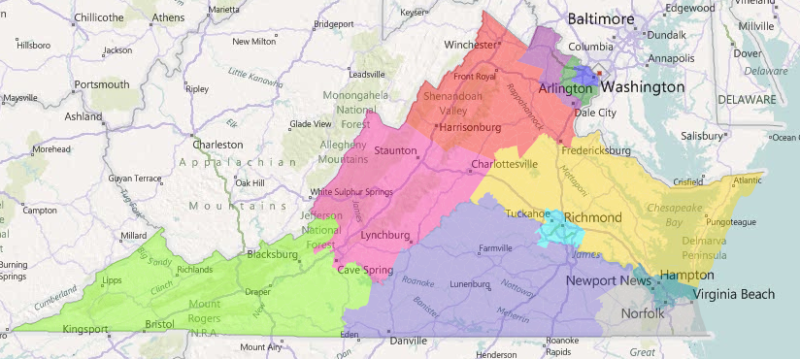
Texas dem redistricting

Had a whole write up posted but it got deleted. No comments this time but you guys know the deal by now. Its a 17-16-3 Democratic gerrymander.

http://img.photobucket.com/alb…

http://img.photobucket.com/alb…

El Paso: http://img.photobucket.com/alb…

District 1 (Blue) 54 Obama 66 Hispanic

El Paso and Odessa

Lean/Likely D

District 2 (Green) 57 O 72 H

El Paso and tentacles

Likely D

District 3 (Purple) 56 O 78 H

Mexican Border and some other counties

Likely D

District 4 (Red) 55 0 74 H

Mexican Border and it snakes up

Lean/Likely D

District 5 (Yellow) 55 0 72 H

Mexican Border and Corpus Christi

Likely D

District 6 (Teal) 34 O 59 White

Counties that border the Gulf of Mexico and going inward.

Safe R

San Antonio: http://img.photobucket.com/alb…

District 7 (Gray) 55 O 58 H

Southern San Antonio and surrounding areas

Likely D

District 8 (Lilac Purple) 54 O 54 H

Middle of San Antonio and some other parts of Bexar county.

Lean/Likely D

District 9 (Sky Blue) 33 O 69 W

Northern San Antonio and its conservative suburbs and exurbs.

Safe R

Austin: http://img.photobucket.com/alb…

District 10 (Bright Pink) 55 O 57 W

Austin and its suburbs

Likely D

District 11 (Lime Green) 54 O 63 W

Austin

Lean/Likely D

District 12 (Periwinkle) 53 O 67 W

Austin and Killeen

Lean D

District 13 (Burt Sienna) 31 O 74 W

Waco, Temple and empty spaces

Safe R

District 14 (Gold) 25 O 66 W

A lot of space and part of lubbock

Safe R

District 15 (Orange) 25 O 66 W

More Nothing.

Safe R

Fort Worth: http://img.photobucket.com/alb…

District 16 (Kelly Green) 52 O 51 W

Surprisingly Conservative Fort Worth

Toss-Up

District 17 (Navy Blue) 30 O 84 W

Suburbs of Fort Worth

Safe R

Dallas: http://img.photobucket.com/alb…

District 18 (Golden Yellow) 59 O, 30 Black 19 Hispanic 5 Asian

Dallas

Safe D

District 19 (Puke Green) 54 O, 22 Black 27 Hispanic 2 Asian

Dallas and a few southward counties

Likely D

District 20 (Rose) 55 O, 39 Hispanic 14 Black 6 Asian

Dallas and Irving

Likely D

District 21 (Blood Red) 50 O, 54 W

Dallas  and surrounding areas

Toss-Up

District 22 (Poo Brown) 39 O 72 W

North of Dallas and FW

Safe R (Winnable with a great candidate in a good year or an incumbent in an ok one, but tilts very r)

District 23 (Robin’s Egg Blue) 35 O 75 W

North of FW to OK border

Safe R

District 24 (Dark Purple) 29 O 72 W

Wraps Around 19, 13 to the end of 11

Safe R

District 25 (Salmon)  35 O, 79 W

North Of Dallas

Safe R

District 26 (Dark Gray) 33 O, 77 W

Between OK Border and 24

Safe R

District 27 (Seafoam Green)31 O 72 W

Along the LA Border

Safe R

Houston: http://img.photobucket.com/alb…

Note: I made a small error here in the large map. It is fixed in the numbers and in the close–up of houston (part of the district didn’t connect)

District 28 (Really Light Purple) 58 O  28 Black 13 Asian 26 Hispanic

Southwest Houston

Safe D

District 29 (Sage Green) 33 O 73 W

Northeast of Houston

Safe R

District 30 (Pinkish-Red near houston) 33 O 70 W

Wraps Around Houston

Safe R

District 31 (Pale Yellow) 39 O, 61 W

South of Houston

Safe R (See District 22)

District 32 (Bright Red) 37 O, 66 W

Wraps even closer around Houston then does 30

Safe R

District 33 (Denim Blue) 56 O, 24 B 7 A 28 H

Houston

Likely D

District 34 (Green in Houston) 51 O, 12 B 6 A 34 H

Houston

Toss-up

District 35 (Purple in Houston) 53 O, 16 B 3 A  43 H

North Houston

Lean D

District 36 (Orange in Houston) 62 O, 26 B 42 H

Southeast Houston riding up to Northwest Houston

Safe D

What I think makes this most effective is that the Democratic districts will only get more liberal over the Decade, cementing the safety of Incumbents and helping unseat any republicans who manage to pull an upset or win a toss-up.

Please reply, this took a while 🙂

And a big thank you for my girlfriend for help with the names of colors (You can tell which parts she left for, lol)

By what margin will Bob Shamansky win?

View Results

Loading ... Loading ...

Pennsylvania gets wyoming’d

First of all, this is my first diary and my first redistricting so be gentle! Also, there is one small error in the bigger pictures, however it is fixed in the zoom ones.

I basically did a very dem friendly redistricting of Pennslyvania under the Wyoming plan. This gives PA 25 seats of about 491,242 that MassGOP has made diaries on.

Without further ado, the map: http://img.imgcake.com/pajpgbu…

Without counties/cities: http://img.imgcake.com/paunmar…

Zoom on Philadelphia: http://img.imgcake.com/phillyu…

East PA: http://img.imgcake.com/eastpai…

SEPA: http://img.imgcake.com/southea…

District 1 (Blue): Obama 73%

Plurality Minority  

Goes from Philly to chester county, covering most of delco along the way. I was surprised how democratic the district was. 49 W 44 B

District 2 (Green): Obama 58%

Just gave the district a chunk of philly then tried to make it more conservative, so it went into Bucks, Montgomery and most of South Delaware. Should be reasonably safe.

District 3 (Purple): Obama 56%

Northeast Philly and wraps around the 2nd and 4th. Most bucks, but also Northampton and Lehigh. Would lean strongly D, and it would only get moreso. Would be vulnerable in another 2010 like year.

District 4 (Red): Obama 55%

Takes Allentown and half of Bethleham. Goes into Montgomery, Bucks, a lot of lehigh, and northhampton. Should be ok in most years.

District 5 (Yellow): Obama 55%

Rest of Bethleham, Easton, and most of Hazleton. All of carbon and monroe counties. Only 2 people off the population goal. Should lean Dem.

District 6 (Teal): Obama 53%

Wilks-Barre, the scranton suburbs, a tiny piece of scranton, all of Montour, columbia counties and the majority of wyoming, luzurne and lackawanna. (Thank you the office for spelling of that). Would tilt D but probably require a blue dog.

District 7 (Silver): Obama 54%

The funniest district in the state, containing the rest of scranton, most or all of 3 northeastern counties, and going all the way to Penn State. Leans D

District 8 (Violet): Obama 64%

This one is ugly. Starts in Philly and just goes out. Snakes through Montgomery to get some of the central pa counties like Snyder and Mifflin. Easy D.

District 9 (Sky Blue) Obama 58%

The most Liberal parts of delco and montco along with eastern chester county. Leans D pretty heavily.

District 10 (Pink) Obama 53%

Harrisburg, Half of Lancaster and coatsville. Pretty tough to hold but def doable. Leans slightly

District 11 (Lime Green): Obama 73%

Starts in Philly and snakes.

District 12 (Robin’s Egg Blue): Obama 57%

Starts in Philly and snakes up to central. Easy Dem.

District 13 (Tan): Obama 89%

VRA district. 29 W 46 B 19 H

District 14 (Gold): Obama 39%

Huge by Land Area, takes a ton of the conservative areas into one votesink.

District 15 (Orange): Obama 53%

The one I’m perhaps most proud of. Goes from York to Pittsburgh. Takes Altoona, Johnstown, and some of the bigger Pitt suburbs. Blue dog should take this one easily.

District 16 (Slightly darker lime green): Obama 50%

Reading and the other half of Lancaster. True toss-up, very winnable.

District 17 (Navy Blue) Obama 40%

The surprisingly heavily populated York, Adams and Franklin counties in south central pa. Not a shot in hell for us to win it.

District 18 (Bright yellow): Obama 41%

Scraps. Takes parts of a lot of other counties. Easy R win.

District 19 (Pea Green): Obama 40%

A lot of the Southwestern counties. Easy R win.

Pitt close up: http://img.imgcake.com/pittclo…

District 20 (Light Pink): Obama 52%

Parts of Pitt and Washington county and Fayette county. Lean D or Toss-Up

District 21 (Blood Red): Obama 54%

East Pittsburgh, some suburbs and then it just snakes out east. Lean D

District 22 (Poo Brown): Obama 38%

One of the most conservative districts in the country. Easy easy R.

District 23 (Baby Blue): Obama 54%

Erie, Saint Mary’s and a lot of the more liberal areas in the Northwest PA. Lean D

District 24 (Dark Purple): Obama 55%

Lots of pittsburgh and Allegheny county. Likely D

District 25 (Pink-Red Mesh): Obama 49%

What was left. Surprised it was still winnable for us.

Lean Dem or better: 18

Toss-up: 2

Easy R: 5

Thoughts?