TX-SBOE Maps

Today in the Texas House, the Committee Substitute to HB 600 was read a 3rd time and passed.

HB 600 redraws the State Board of Education seats.

There has been some talk about increasing the size of the SBOE. It currently has only 15 members which means the ideal population size for the new districts is 1.6 million.

Who cares about some SBOE seats? Considering that Texas is one of the biggest buyers of textbooks (when the state has the money to purchase them), and that these 15 people decide what goes in the textbooks, these 15 seats can have a national impact.

So what did the House finally agree to?

It should be noted that all 15 of these seats will be up in 2012. The year after redistricting all of the members of the State Senate and the State Board of Education run.  They then draw to see who runs in 2 years (i.e. 2014) or 4 years (i.e. 2016)

First, here’s a map of the current SBOE districts.

The new districts:

New districts in Dave’s App

These maps are from the state’s redistricting website, but they didn’t provide any partisan data. So I drew them using Dave’s App.

District 1

Lean-Likely D

55% Obama/45% McCain

73% Hispanic, 24% White, 3% Black, 1% Asian

This district is interesting because in 2010 it elected a Republican. The incumbent Democrat may have gotten a little complacent having been elected in 1988 and his only previously close election being in 1994 when he won 53% to 47%. Although with a district that contains both El Paso and Laredo, you have to think you’d be pretty safe as a Hispanic Democrat. Democrats have the chance to recapture this seat in 2012.

District 2

Lean D

52% Obama/47% McCain

69% Hispanic, 27% White, 3% Black, 1% Asian

This district features a longtime incumbent with Democrat Mary Helen Berlanga. She’s been on the board since 1982. That’s long enough to have been elected to the SBOE (in 1982), appointed to the SBOE (in 1984 when the Lege made it an appointed body), and elected again (in 1988 when it went back to an elected body).  In spite of the closeness of this district, Berlanga has managed to solidly win every time.

District 3

Safe D

60% Obama/39% McCain

68% Hispanic, 27% White, 7% Black, 2% Asian

This district pretty much stays safe for a Democrat.

District 4

Light Red (next to District 7)

Safe D

73% Obama/26% McCain

49% Hispanic, 30% Black, 16% White, 5% Asian

Stays a solid Democratic district.

District 5

Yellow

Lean-Likely R

44% Obama/54% McCain

60% White, 31% Hispanic, 6% Black, 4% Asian

This district still takes in heavily Republican areas in north Bexar County. In Bexar County it trades some Republican areas in NE Bexar County (Live Oak, Universal City, Converse, Schertz, and Randolph AFB) for some others (Alamo Heights, Olmos Park, and Terrell Hills). It keeps the Republican counties of Kendall, Comal, and Guadalupe. It only slightly increases its coverage of Travis County. It sheds Bell County which contains Killeen-Temple-Fort Hood.

District 6

Light Blue (below District 8, directly to the left of District 4)

Likely R

41% Obama/58% McCain

48% White, 30% Hispanic, 12% Black, 11% Asian

This district pretty much stays the same, only losing a small slice of Harris County.

District 7

Likely R

41% Obama/58% McCain

54% White, 18% Black, 19% Hispanic, 9% Asian

This district sheds east Harris County and adds 4 new counties. This could be a ripe district for Democrats to target because the new configuration includes Fort Bend County.  This county has been trending Democratic. In 2008, the county went 49% Obama/51% McCain. In 2010 it went 47% Bill White/52% Rick Perry.

District 8

Safe R

65% White, 20% Hispanic, 11% Black, 4% Asian

This district has some changes. Previously it ran up east Texas. It now moves south and becomes more compact.

District 9

Safe R

30% Obama/70% McCain

73% White, 15% Black, 11% Hispanic, 2% Asian

This district takes in a lot of the old 8th.

District 10

Toss Up

49% Obama/49% McCain

61% White, 21% Hispanic, 12% Black, 6% Asian

I never thought I’d be able to write tossup about either a State Senate seat or an SBOE seat. *The 2008 vote totals for this district were 298,091 for Obama and 298,430 for McCain. 339 votes. Democrats may finally be able to win a new seat on the SBOE.  If Judy Jennings wants another crack at this seat, 2012 is the year to do it with the presidential race and Travis County. This district now doesn’t go all the way from Austin to the Houston suburbs.

*Thanks to Greg at Greg’s Opinion for the updated numbers. And thanks to blank for the prodding that got the update.

District 11

Safe R

37% Obama/62% McCain

67% White, 17% Hispanic, 9% Black, 6% Asian

Takes in plenty of Republican areas to still make it safe for Republicans.

District 12

Red (covers northern portion of Dallas County and NE quadrant of Tarrant County)

Likely R

43% Obama/57% McCain

58% White, 21% Hispanic, 12% Black, 8% Asian

Here is another potential opportunity for Democrats. It sheds Rockwall County and a portion of Collin County, while adding a portion of Tarrant County. Thanks to the success of Dallas County Democrats, this district has the potential to be competitive.

District 13

Gray (weird looking district that covers Dallas and Tarrant counties)

Safe D

69% Obama/30% McCain

41% Hispanic, 26% White, 30% Black, 4% Asian

Takes in more of Tarrant County, but continues to be a safe Democratic seat.

District 14

Safe R

32% Obama/67% McCain

71% White, 14% Hispanic, 7% Black, 7% Asian

District 15

Safe R

25% Obama/74% McCain

65% White, 27% Hispanic, 6% Black, 3% Asian

Currently the board is split 4 D – 11 R. If Democrats play their cards right, they could conceivably wind up with a 6 D – 9 R split on the SBOE. Democrats should go for broke and make a serious play for Districts 5, 7, & 12, if only to try and get an idea of what the Democratic performance is like in the new districts.

Populations for districts are VAP from the state.

A Look at Southern Texas Redistricting

I was working on an extended redistricting of Texas, but I accidentally closed out the file! I had saved it using an .RTF, but I don’t know how to open it (can anyone help with that??). But anyway, I did take a photoshot of Southern Texas before I closed out, and I think it might be worthwhile to examine what redistricting will look like along the border.

Photobucket

I used the 2010 Census numbers for this, so all follow the VRA. I also plugged in the partisan data for TX-23 and found that if you attach the district to San Angelo, you get a Obama 44% district and VAP of 59% Hispanic. Pretty cool!

I drew an extra fajita strip (purple) that went about 49% for Obama, while being around 60% VAP. The other Hispanic districts (TX-15, 20, 28, 35) are all around 70% VAP. The new TX27 (green) is safe for Farenthold (back-of-the-envelope calculations say that it went 41% for Obama).

Also, as you can see, McCaul is significantly safer, it’s now a 38% Obama district. However, and this is important, the estimations under the partisan data are wildly different than the actual Census numbers: the district is actually far more Hispanic under the 2010 numbers. In fact, it’s only 60% white VAP, and less so with the total numbers. Austin is far more Hispanic that one would imagine.

Also, Carter is made a lot safer in his district by removing Killeen to the super-duper red TX-11.

So tell me what you think! Sorry I don’t have the rest available–I will if someone helps me out. I do think this is what’s going to happen, though.

Texas: Repredicting Redistricting

Previously, I created a 24R-12D map predicting Texas redistricting.  Since then, my reading of the tea leaves (mostly Aaron Pena’s party switch) has convinced me to revise my predictions somewhat.  At the very least we can expect the state to pass a more Republican friendly map, which will almost certainly be challenged in the courts.  Something close to the previously drawn map might be enacted if the state loses the court battle.  This map then is more of a prediction of what the state might pass before the court battle.  

The map has the following objectives:

1) Keep all incumbents with their base voters, except McCaul.

2) Draw a Republican safe district for McCaul.

3) Draw a new non-VRA Republican safe district for Farenthold in Corpus Christi.

4) Draw two new Republican safe districts in Harris and Johnson.

5) Draw two VRA swing districts for Canseco and Pena in south Texas.

6) Draw a new VRA Democratic safe district in DFW.

7) Draw a VRA Democratic safe district in Austin.

The data is based upon the 2010 census.  For the partisan data, I matched the precincts that matched the 2008 test data precincts, and then I used regression models based upon the county level voting and demographics for each of the parties on the remaining precincts.  Based upon residual analysis and validation data sets, this approach appears to be pretty accurate.  Here are the maps with the pretty colors.  (I used only nine colors that I duplicated each four times.)

The state.

Photobucket

Greater Houston.

Photobucket

DFW.

Photobucket

Central Texas.

Photobucket

The Valley.

Photobucket

El Paso.

Photobucket

CD 1: (Yellow) [31% Obama – 69% McCain, Wh 64%, Bl 18%, Hisp 15%] Tyler based district for Gohmert.

CD 2: (Brown) [42% Obama – 58% McCain, Wh 50%, Bl 22%, Hisp 15%] Northeast Harris/Jefferson based district for Poe.

CD 3: (Silver) [42% Obama – 58% McCain, Wh 52%, Bl 11%, Hisp 20%] Plano based district for Sam Johnson.

CD 4: (Indigo) [31% Obama – 69% McCain, Wh 69%, Bl 11%, Hisp 14%] Rockwall based district for Hall.

CD 5: (Blue) [41% Obama – 59% McCain, Wh 55%, Bl 15%, Hisp 26%] Dallas based district for Hensarling.

CD 6: (Red) [33% Obama – 67% McCain, Wh 65%, Bl 13%, Hisp 18%] Ellis County/Arlington based district for Barton.  

CD 7: (Violet) [45% Obama – 55% McCain, Wh 53%, Bl 9%, Hisp 26%] Houston based district for Culberson.  There is almost certainly a way to make this district safer than currently drawn.  

CD 8: (Silver) [24% Obama – 76% McCain, Wh 74%, Bl 6%, Hisp 16%] Montgomery County based district from Brady.

CD 9: (Silver) [71% Obama – 29% McCain, Wh 13%, Bl 29%, Hisp 43%] Houston based district for Al Green.

CD 10: (Brown). [40% Obama – 60% McCain, Wh 70%, Bl 4%, Hisp 22%] Austin/West Texas district for McCaul. Previously, I drew McCaul to Johnson County.  However, since I am no longer drawing West Texas districts for both Canseco and a VRA-protected Democrat, I had more real estate for McCaul to the West.

CD 11: (Yellow) [31% Obama – 69% McCain, Wh 60%, Bl 3%, Hisp 33%] Midland based district for Conaway that now helps crack Austin.

CD 12: (Blue) [39% Obama – 61% McCain, Wh 56%, Bl 8%, Hisp 32%] Fort Worth based district for Granger.

CD 13: (Gren) [24% Obama – 76% McCain, Wh 69%, Bl 6%, Hisp 21%] West Texas based district for Thornberry.  

CD 14: (Red) [36% Obama – 64% McCain, Wh 57%, Bl 11%, Hisp 28%] Galveston based district for Paul.

CD 15: (Silver) [67% Obama – 33% McCain, Wh 9%, Bl 0%, Hisp 89%] Hidalgo County based district for Hinojosa that now goes into Cameron.  In the previous 24-12 map, several comments noted that a similar district may be too Hispanic.  However, based upon my reading of Lulac v. Perry, this was not established.  If there is another court case that established that districts may not be too Hispanic, then please let me know.  

CD 16: (Red) [66% Obama – 34% McCain, Wh 13%, Bl 2%, Hisp 82%] El Paso based district for Reyes.

CD 17: (Orange) [37% Obama – 63% McCain, Wh 60%, Bl 15%, Hisp 21%] College Station/Waco based district for Flores that now goes East. Chet Edwards could make a comeback, but I doubt it.

CD 18: (Green) [84% Obama – 16% McCain, Wh 10%, Bl 45%, Hisp 40%] Houston based district for Jackson.

CD 19: (Violet) [27% Obama – 73% McCain, Wh 57%, Bl 5%, Hisp 36%] Lubbock based district for Neugebauer.

CD 20: (Violet) [65% Obama – 35% McCain, Wh 17%, Bl 6%, Hisp 74%] San Antonio based district for Gonzalez.

CD 21: (Red) [41% Obama – 59% McCain, Wh 52%, Bl 9%, Hisp 34%] San Antonio based district for Smith.

CD 22: (Orange) [40% Obama – 60% McCain, Wh 48%, Bl 13%, Hisp 24%] Sugar Land based district for Olson.

CD 23: (Indigo) [51% Obama – 49% McCain, Wh 28%, Bl 3%, Hisp 65%] North Bexar based district for Canseco.  As noted previously, this district is very similar to his current district, and Democrats will likely win it back before the end of the decade.

CD 24: (Yellow) [38% Obama – 62% McCain, Wh 59%, Bl 10%, Hisp 19%] Southlake/Coppell based district for Marchant. This district is significantly safer than his current district.

CD 25: (Orange) [64% Obama – 36% McCain, Wh 35%, Bl 11%, Hisp 50%] Austin based district for Doggett is now VRA protected.

CD 26: (Orange) [36% Obama – 64% McCain, Wh 67%, Bl 7%, Hisp 18%] Flower Mound/Denton based district for Burgess that no longer cracks the African American community in southeast Fort Worth.

CD 27: (Blue) [47% Obama – 53% McCain, Wh 31%, Bl 3%, Hisp 65%] New Hidalgo based VRA district for Pena.  This district is obviously the biggest case against this map, because it retrogresses the old CD 27 and split Nueces County. If not ruled out by the courts though, it would be a huge Democratic target that they would have an excellent chance of winning before the end of the decade.

CD 28: (Brown) [73% Obama – 27% McCain, Wh 6%, Bl 0%, Hisp 93%] Laredo based district for Cuellar.  Previously, I drew this one less safe.  However, if the Republicans are going to pack, then they will almost certainly pack with Cuellar, who is probably in good shape no matter what.  

CD 29: (Blue) [63% Obama – 37% McCain, Wh 12%, Bl 10%, Hisp 76%] Houston based district for Gene Green.

CD 30: (Indigo) [74% Obama – 26% McCain, Wh 21%, Bl 46%, Hisp 27%] Dallas based district for Eddie Bernice Johnson that now goes into the African American communities in East Arlington and Southeast Fort Worth.

CD 31: (Indigo) [44% Obama – 56% McCain, Wh 63%, Bl 7%, Hisp 22%] Williamson County based district for Carter.

CD 32: (Violet) [44% Obama – 56% McCain, Wh 59%, Bl 10%, Hisp 22%] North Dallas based district for Sessions.   Like CD 24, this district is significantly safer than his current district.

CD 33: (Green) [34% Obama – 66% McCain, Wh 64%, Bl 12%, Hisp 19%] New Johnson County based district for some Republican like Brian Birdwell.  

CD 34: (Green) [71% Obama – 29% McCain, Wh 15%, Bl 18%, Hisp 64%] New Dallas based VRA district for some Democrat like Royce West or Rafael Anchia.

CD 35: (Brown) [40% Obama – 60% McCain, Wh 45%, Bl 5%, Hisp 47%] Corpus Christi based district for Farenthold.  It is no longer a VRA district since it extends north.

CD 36: (Yellow) [35% Obama – 65% McCain, Wh 51%, Bl 11%, Hisp 28%] New Harris County based district for some Republican like Dan Patrick or Debbie Riddle.

Overall 24 R – 10 D – 2 Swing.

I imagine that there are several Democrats worried about such a map as this one, and they are hoping the Obama DOJ and/or Lulac is prepared to prosecute such a map. While I do hope such a map is prosecuted, since it clear cracks Nueces, I actually think that this may be Nietzsche map for Democrats.    In the previous 24-12 map, there was not a single swing district for Democrats to target, whereas in this 24-10-2 map there are two in South Texas.  I am sure most Democrats would prefer 2 safe districts rather than 2 swing districts, which is the net difference between the two maps.  However, Democrats would probably spend upwards of $2-$4 million every other year in South Texas on 2 districts that will likely turn Democratic eventually.  That could dramatically improve the local parties in Hidalgo and Bexar, which is necessary for the state to turn blue.  A similar example would be Martin Frost’s district.  Yes, Democrats lost one of their best congressmen.  However, many Dallas Democrats will point to the money spent on the 2004 CD-32 race as one of the reasons for Dallas turning solidly blue, which it is today.  Furthermore, Dallas Democrats are likely to get back a district similar to Frost’s old district in this round of redistricting anyway.  So, in the end, Dallas Democrats lost a powerful congressman for 6 years, while they rapidly built themselves into a powerful local party that claims most of the county positions.  Meanwhile Republicans gained a backbencher named Kenny Marchant.  Certainly having your backs up against a wall in swing districts is not the preferred method of party building.  However, there is no doubt that well-built turnout operations in Bexar and Hidalgo would pay dividends at the top of the ticket.

[UPDATE 1] I should have mentioned this originally.  I would be remiss in not giving lots of credit to Greg Wythe.  His posts on Lloyd Doggett and Aaron Pena were inspirations for CDs 25 & 27 on this map.  Also, rdelbov has been predicting a similar set of districts in South Texas for some time.

[UPDATE 2] I found this map at RRH, which is pretty similar but ever so slightly more friendly to Democrats.  In any case, it leads me to believe even more that this is something the Texas GOP might try.

[UPDATE 3] Thanks to Kuff and Greg for the links to this diary.  To those of you coming to this diary from their links, welcome.  

Attempting Texas

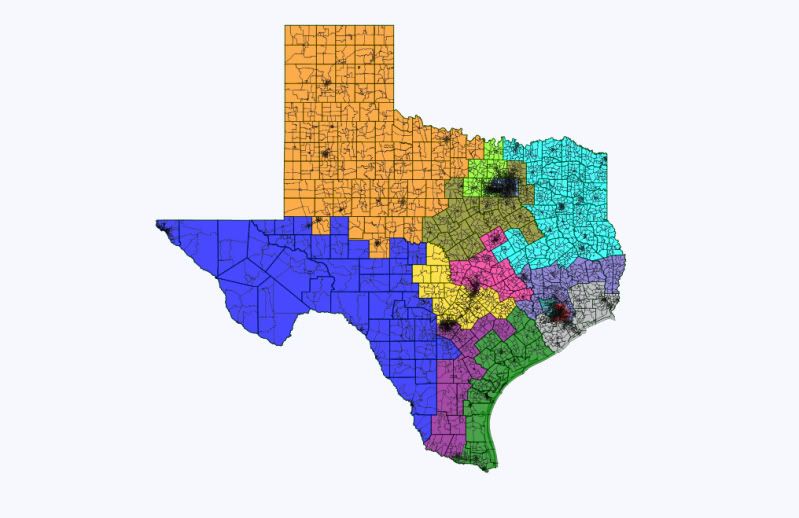
Now that Dave has uploaded Census data for Texas, I thought I’d give one of the most interesting states this decade a go on his website. There are ups and downs re: the realism of this map. Of the four new seats, I made one new heavily Democratic VRA seat in Dallas-Fort Worth meant to elect an Hispanic (though that % is still under 60), one competitive South Texas seat that is majority but not safely Hispanic (again, under 60%), and overwhelmingly Republican seats in north Houston and — not sure how to describe this region — between Weatherford/Fort Worth in the north and Killeen in the south. As for protecting Republican incumbents, the new GOP Houston seat made it harder for me to help Mike McCaul, whose district barely voted for McCain, and the Hispanic boom in San Antonio can only hurt Quico Canseco (though a better mapmaker than I could have split the difference with Lamar Smith to help Canseco’s reelection chances). But overall, this is a decent map. Take a look below the fold…

Photobucket

RURAL EAST TEXAS: 3 Republicans

District 1 (brown)

Representative: Louie Gohmert (R)

Areas: Tyler, East

Demographics: 70% white

2008 Vote: McCain 69-31

Gohmert stays safe and this seat barely changes.

District 4 (red)

Representative: Ralph Hall (R)

Areas: Rockwall, Texarkana

Demographics: 80% white

2008 Vote: McCain 69-30

Sheds some suburban population but remains similarly situated.

District 8 (lavender)

Representative: Kevin Brady (R)

Areas: Montgomery County, Southeast

Demographics: 80% white

2008 Vote: McCain 74-25

The most densely populated spots in Montgomery County are ceded to the new District 35 in northwest Houston, but this district’s general shape stays the same. It remains among the wealthiest and most Republican seats in the state.

HOUSTON AND SOUTHEAST: 5 Republicans, 3 Democrats

Photobucket

District 2 (green)

Representative: Ted Poe (R)

Areas: Humble, Port Arthur

Demographics: 63% white

2008 Vote: McCain 57-42

Cedes parts of Jefferson County to Ron Paul and northern Harris County to the new District 35.

District 7 (gray)

Representative: John Culberson (R)

Areas: west Houston

Demographics: 67% white

2008 Vote: McCain 57-42

Contracts a bit in area and moves slightly south and east, but stays fairly Republican for near-downtown Houston.

District 9 (turquoise)

Representative: Al Green (D)

Areas: south Houston, north Fort Bend

Demographics: 39% black, 33% Hispanic, 17% white

2008 Vote: Obama 78-22

Surprisingly, I was able to keep black pluralities both here and in District 18 despite the Hispanic population explosion of the last decade.

District 14 (olive)

Representative: Ron Paul (R)

Areas: Galveston, Lake Jackson

Demographics: 65% white

2008 Vote: McCain 63-36

Paul’s district shrinks and becomes even more coastal but stays securely Republican. It still amazes me that a downright libertarian continues to get elected in military-heavy country like southeast Texas.

District 18 (yellow)

Representative: Sheila Jackson Lee (D)

Areas: central Houston

Demographics: 44% black, 34% Hispanic, 17% white

2008 Vote: Obama 80-19

The most Democratic district in Texas remains so, changing only to accommodate population growth.

District 22 (brown)

Representative: Pete Olson (R)

Areas: Sugar Land, Missouri City, Pasadena

Demographics: 57% white (20% Hispanic, 13% Asian – future VRA seat?)

2008 Vote: McCain 58-42

Welcome to the district most likely to become majority-minority during the 2010s. Tom DeLay’s old turf remains Republican enough — slightly more so than the state at large, in fact — but in 2021 we are probably looking at a new VRA district right here.

District 29 (light green)

Representative: Gene Green (D)

Areas: east Houston

Demographics: 69% Hispanic

2008 Vote: Obama 63-37

Green has managed 20 years as an Anglo Congressman for Houston’s Hispanic-majority district, but as the Latino population reaches South Texas levels, can he withstand a primary challenge? Given his seniority, most think so, but GOP mapmakers may try to concentrate Hispanics previously represented by Sheila Jackson Lee or Al Green to mess with him.

District 35 (purple)

Representative: TBD

Areas: northwest Houston, Conroe, south-central

Demographics: 72% white

2008 Vote: McCain 67-33

I made this district too Republican, at the expenses of Mike McCaul, John Culberson, and Ted Poe. A professional gerrymanderer could do better. Regardless, legislators will make a safe GOP seat in north Houston.

DALLAS-FORT WORTH: 7 Republicans, 2 Democrats

Photobucket

District 3 (fuchsia-purple)

Representative: Sam Johnson (R)

Areas: Plano

Demographics: 76% white

2008 Vote: McCain 61-38

Huge growth in the Metroplex suburbs means this district is now confined to Collin County.

District 5 (yellow)

Representative: Jeb Hensarling (R)

Areas: Mesquite, east-central

Demographics: 74% white

2008 Vote: McCain 64-35

I’m not sure if Hensarling still lives here, as Districts 30 and 32 both ate up some white areas of north Dallas, but he would move here if need be as this district is quite solid for a Dallas County Republican.

District 6 (teal)

Representative: Joe Barton (R)

Areas: Arlington, east-central

Demographics: 67% white

2008 Vote: McCain 60-39

The former Energy and Commerce Committee chairman remains quite safe in this meandering Arlington-to-rural-East-Texas seat.

District 12 (blue-gray)

Representative: Kay Granger (R)

Areas: Fort Worth

Demographics: 69% white

2008 Vote: McCain 57-42

Now entirely within Tarrant County, this district loses its rural areas but stays fairly Republican. As the Metroplex trends more Democratic, this may become competitive by 2020.

District 24 (dark purple)

Representative: Kenny Marchant (R)

Areas: Carrollton, Irving, Grapevine

Demographics: 65% white

2008 Vote: McCain 58-41

This fast-growing seat may also become a tossup in the next decade, though it remains affluent, suburban, and decidedly Republican.

District 26 (pink)

Representative: Mike Burgess (R)

Areas: Denton County

Demographics: 81% white

2008 Vote: McCain 66-34

I maintained the odd “dripping” shape of this district; in fact, this is one of the least changed seats in the state (in addition to the whitest).

District 30 (peach)

Representative: Eddie Bernice Johnson (D)

Areas: central and south Dallas

Demographics: 45% black, 28% white, 25% Hispanic

2008 Vote: Obama 79-20

As District 32 moved east, toward Richardson and Garland and away from white-flight Dallas proper, Johnson had to pick up some white areas of north Dallas, though Democratic primaries in the district will still be dominated by African-Americans.

District 32 (orange)

Representative: Pete Sessions (R)

Areas: north Dallas, Garland

Demographics: 62% white

2008 Vote: McCain 55-44

A rapidly diversifying area, this district may be unsalvageable for Republicans in ten years, but for now I did my best to help Sessions (who might not live here) and future area GOPers.

District 36 (gold)

Representative: TBD

Areas: urban Fort Worth-to-Dallas serpent

Demographics: 58% Hispanic, 20% white, 19% black

2008 Vote: Obama 74-25

Republicans really do not have a choice anymore; they must draw a second Democratic vote-sink in the Metroplex, and almost everyone expects it to be a VRA coalition or Hispanic-majority district linking the region’s two primary cities. Low Hispanic turnout might enable a white or black Democrat to win, but any serious primary candidate will need to have ties to the Latino community, at least.

CENTRAL TEXAS: 5 Republicans, 1 Democrat

District 10 (pink)

Representative: Mike McCaul (R)

Areas: northeast Austin, Brazos Valley

Demographics: 63% white

2008 Vote: McCain 50-48

My biggest regret in this map is failing to give McCaul a safe district; he had to lose safe GOP areas of Harris County to enable the creation of a new district around Houston and these were replaced with counties east of Austin that are no more Republican. Again, a more skilled mapmaker can split the difference between this and District 35 to make two safe GOP seats.

District 17 (ash purple/puce)

Representative: Bill Flores (R)

Areas: stretches down to Waco, Temple, College Station

Demographics: 65% white

2008 Vote: McCain 62-37

This once-important district (back when unhinging Chet Edwards was a priority for state Republicans) is now little more than a “leftovers” seat sandwiched between fast-growing seats like the 8th, 10th, and 31st (in addition to the new District 34).

District 25 (salmon pink)

Representative: Lloyd Doggett (D)

Areas: Austin, San Marcos

Demographics: 52% white, 33% Hispanic

2008 Vote: Obama 67-32

Much as Republicans would like to crack Austin’s Democratic base, growing Dem strength in Central Texas is sufficient for them to make a compact, geographically logical seat for Doggett.

District 31 (weak yellow)

Representative: John Carter (R)

Areas: Round Rock, New Braunfels

Demographics: 77% white

2008 Vote: McCain 57-41

Carter’s district had to move south to accommodate the new District 34 and, even then, it contracted considerably in area.

District 34 (green)

Representative: TBD

Areas: Weatherford and Arlington all the way down to Killeen

Demographics: 75% white

2008 Vote: McCain 67-32

Now here’s a classic DeLaymander-style district: it stretches incoherently from the Metroplex in the north down to the heart of Central Texas. In any case, it’s safely Republican, maybe enough so that Carter should be further shored up at its expense.

WEST TEXAS: 3 Republicans

District 11 (lime)

Representative: Mike Conaway (R)

Areas: Midland, San Angelo

Demographics: 65% white

2008 Vote: McCain 75-24

This is actually the least altered district in the state, I believe.

District 13 (light brown)

Representative: Mac Thornberry (R)

Areas: Panhandle, Amarillo

Demographics: 76% white

2008 Vote: McCain 77-22

Actually extends into what used to be Kay Granger land to get enough population.

District 19 (chartreuse)

Representative: Randy Neugebauer (R)

Areas: Lubbock, Abilene

Demographics: 64% white

2008 Vote: McCain 72-28

Now looks slightly less silly on its pinched southern flank.

SAN ANTONIO, EL PASO, & SOUTH TEXAS: 4 Democrats, 3 Republicans, 1 competitive

District 15 (orange)

Representative: Ruben Hinojosa (D)

Areas: Victoria down to the Mexican border

Demographics: 72% Hispanic

2008 Vote: Obama 53-46

The first of the “fajita strip” districts intended to maximize Hispanic strength in the Rio Grande Valley. It could still afford to shed a few Latinos to the new District 33, whose Hispanic majority is less than secure for VRA purposes.

District 16 (green)

Representative: Silvestre Reyes (D)

Areas: El Paso

Demographics: 76% Hispanic

2008 Vote: Obama 65-34

This district has essentially been urban El Paso for all of contemporary Texas history.

District 20 (pink)

Representative: Charlie Gonzalez (D)

Areas: San Antonio

Demographics: 68% Hispanic

2008 Vote: Obama 64-35

Much like the 16th, this is a compact urban seat.

District 21 (brown)

Representative: Lamar Smith (R)

Areas: north San Antonio, Hill Country

Demographics: 68% white

2008 Vote: McCain 64-35

Smith remains safe; maybe too safe. But I’m not sure how to transfer significant numbers of Republicans from his district to Canseco’s without begging for a VRA lawsuit.

District 23 (light green)

Representative: Quico Canseco (R)

Areas: between El Paso and south San Antonio

Demographics: 69% Hispanic

2008 Vote: Obama 57-42

This actually got significantly more Democratic, much to my dismay as someone hoping to craft a realistic GOP map. I suppose I could have kept north San Antonio in the district, but the 21st would have become pretty awkward-looking. Still, Republicans will probably do just that.

District 27 (shiny green)

Representative: Blake Farenthold (R)

Areas: coast down to Brownsville

Demographics: 67% Hispanic

2008 Vote: Obama 52-47

From Farenthold’s perspective, this district is no worse than his current one, but if I were him I’d move into the new District 33 (if he doesn’t already live there), which is significantly whiter and slightly more Republican.

District 28 (mauve)

Representative: Henry Cuellar (D)

Areas: east San Antonio down to Mexican border

Demographics: 73% Hispanic

2008 Vote: Obama 60-40

This is a pear-shaped seat now, with a pinched San Antonio and Seguin top and a robust bottom. Again, I could have diluted its and the 15th’s Hispanic pops to make the 33rd closer to safety from otherwise inevitable lawsuits. But hey, at least Laredo is in one district!

District 33 (periwinkle)

Representative: TBD

Areas: Fort Bend County down to Harlingen

Demographics: 58% Hispanic, 35% white

2008 Vote: McCain 51-49

No one will like this district. It’s ugly, geographically incoherent (Houston exurbs and border towns?), not Hispanic enough to avoid a lawsuit, and politically competitive (likely Democratic in a year like 2008 and Republican in a year like 2010). This seat is an unfortunate product of big population growth both in Fort Bend County and the Rio Grande Valley. Again, mapmakers will almost surely come up with a more elegant solution than this.

OVERALL

Texas has twelve VRA-protected districts in this scenario. As I said, there are areas in which I overconcentrated Republicans and would like to spread them thinner to help potentially endangered GOP incumbents. At other times, my districts are just plain fugly. But in general, the map we see from Texas should vaguely resemble this, with a new Dem VRA seat in Dallas, a new GOP seat in Houston, a new GOP seat in Central, and a new Hispanic VRA seat in South Texas that may lean Democratic, but will not be overwhelmingly so.

Texas: Population by CD

Texas has always been, in my mind, the most interesting state for redistricting in 2010, partly because it grew much more than any other state (it gained four seats, while no other state gained more than two), and partly because much of that growth was Hispanic. This sets up a major conflict in the redistricting process: the Republicans, who control the trifecta here, will want to draw as many of those four new seats for themselves as possible, obviously, but the Obama administration’s Dept. of Justice, via the Voting Rights Act, will compel the creation of as many majority-minority seats as possible. Given the numbers that came out today, Texas Republicans may actually feel lucky getting away with two of the four new seats… assuming that’s what they end up with, after the conclusion of the inevitable litigation process that will result.

Texas gained a whopping 4,293,741 people between 2000 and 2010, growing from 20,851,820 to 25,145,561. Of that 4+ million, only about 10% were non-Hispanic whites. The non-Hispanic white population in 2000 was 10,933,313, and in 2010 it’s 11,397,345, a difference of 464,032. Contrast that with the growth in Hispanics, who went from 6,669,616 to 9,460,921, a gain of 2,791,305. Expressed as percentages, Texas now has only a plurality, not a majority, of non-Hispanic whites. They make up 45.3% of the population in 2010, along with 11.5% non-Hispanic blacks, 3.8% non-Hispanic Asians, and 37.6% Hispanics. (In 2000, non-Hispanic whites were 52.4%, along with 11.3% black, 2.7% Asian, and 32% Hispanic. Those don’t add up to 100 because there are also categories for Native Americans, Pacific Islanders, two or more races, and “some other” race.)

With Texas about to expand to 36 seats, that means the target average for each new congressional district will be 698,488. Here’s a chart that looks at each current congressional district, giving old and new populations, the amount gained (or lost), and the “deviation,” which is what we’re calling how many people each district will need to shed (or in a few cases, gain) in order to hit its 2010 target. (In case you’re wondering, yes, the 2000 data is for the post-2004 DeLay-mander configurations of each district.) I’m also including the 2000 and 2008 presidential election results, so you can see which direction the districts are headed (very different, when you contrast the trend in rural east Texas districts with suburbs for the major cities).

District Rep. 2000 total 2010 total Total change Deviation 2000 election 2008 election
TX-01 Gohmert (R) 651,652 723,464 71,812 24,976 33/68 31/69
TX-02 Poe (R) 651,605 782,375 130,770 83,887 37/63 40/60
TX-03 Johnson, S. (R) 651,782 842,449 190,667 143,961 30/70 42/57
TX-04 Hall (R) 651,500 846,142 194,642 147,654 34/66 30/69
TX-05 Hensarling (R) 651,919 725,642 73,723 27,154 34/66 36/63
TX-06 Barton (R) 651,691 809,095 157,404 110,607 34/66 40/60
TX-07 Culberson (R) 651,682 780,611 128,929 82,123 31/69 41/58
TX-08 Brady (R) 651,755 833,770 182,015 135,282 31/69 26/74
TX-09 Green, A. (D) 651,086 733,796 82,710 35,308 69/31 77/23
TX-10 McCaul (R) 651,523 981,367 329,844 282,879 34/67 44/55
TX-11 Conaway (R) 651,590 710,682 59,092 12,194 25/75 24/76
TX-12 Granger (R) 651,770 831,100 179,330 132,612 36/64 36/63
TX-13 Thornberry (R) 651,665 672,781 21,116 (25,707) 26/74 23/77
TX-14 Paul (R) 651,837 779,704 127,867 81,216 36/64 33/66
TX-15 Hinojosa (D) 651,580 787,124 135,544 88,636 54/46 60/40
TX-16 Reyes (D) 652,363 757,427 105,064 58,939 59/41 66/34
TX-17 Flores (R) 651,509 760,042 108,533 61,554 32/68 32/67
TX-18 Jackson-Lee (D) 651,789 720,991 69,202 22,503 72/28 77/22
TX-19 Neugebauer (R) 651,610 698,137 46,527 (351) 25/75 27/72
TX-20 Gonzalez (D) 651,603 711,705 60,102 13,217 58/42 63/36
TX-21 Smith (R) 651,930 856,954 205,024 158,466 31/69 41/58
TX-22 Olson (R) 651,657 910,877 259,220 212,389 33/67 41/58
TX-23 Canseco (R) 651,149 847,651 196,502 149,163 47/54 51/48
TX-24 Marchant (R) 651,137 792,319 141,182 93,831 32/68 44/55
TX-25 Doggett (D) 651,477 814,381 162,904 115,893 47/53 59/40
TX-26 Burgess (R) 651,858 915,137 263,279 216,649 38/62 41/58
TX-27 Farenthold (R) 651,843 741,993 90,150 43,505 50/50 53/46
TX-28 Cuellar (D) 651,259 851,824 200,565 153,336 50/50 56/44
TX-29 Green, G. (D) 651,405 677,032 25,627 (21,456) 57/43 62/38
TX-30 Johnson, E. (D) 652,261 706,469 54,208 7,981 74/26 82/18
TX-31 Carter (R) 651,868 902,101 250,233 203,613 32/69 42/58
TX-32 Sessions (R) 650,555 640,419 (10,136) (58,069) 36/64 46/53

Now let’s turn to the changes in racial composition in each district. The Hispanic population increased in all of Texas’s 32 districts, with the smallest increase being 35,816 (in TX-32 in north Dallas, the only district which lost population overall – I’m not quite sure why this district lost population, other than the fact that it’s fairly dense, and boxed in by other urban districts, so it’s unable to sprawl in any direction). Eight districts gained more than 100,000 Hispanics each, with the biggest gain in the Laredo-based TX-28, gaining 166,375. The second biggest gain was 159,747 in TX-10, the wormlike district that links Houston’s western suburbs with Austin’s eastern suburbs and which gained a whole lot of everybody of all races. TX-10 is also more remarkable in that the Hispanic share of the total population nearly went up 10%, from 19% to 29% (by contrast, in TX-28, the Hispanic share barely increased, seeing as how they’re already the vast majority there).

These two existing districts point to where two of the new VRA districts are likeliest to pop up: the Rio Grande Valley, and the Houston area. (A new Hispanic-majority Houston seat would probably be located in the downtown and western parts of town, pushing TX-07 and then TX-10 further west.) The third possibility is a Dallas area Hispanic-majority seat, which might be anchored in downtown and western Dallas but wander further west to grab areas near DFW airport and maybe even in Fort Worth. The GOP, I’m sure, would prefer to try to limit the number of VRA seats to two, but it may be a difficult balancing act; in particular, it’ll be hard to avoid having a new VRA seat pop up in the Rio Grande Valley (thanks to huge growth in TX-15 and TX-23, too) if they’re going to try to reconstruct a more Republican-favorable TX-27 in order to protect unexpected new member Blake Farenthold (maybe linking Corpus Christi with Victoria instead of Brownsville, for instance).

District 2000 white White % 2010 white White % % change 2000 Hispanic Hispanic % 2010 Hispanic Hispanic % % change
TX-01 485,238 74.5 514,939 71.2 -3.2 59,688 9.2 109,499 15.1 6.0
TX-02 462,830 71.0 493,830 63.1 -7.9 82,578 12.7 176,196 22.5 9.8
TX-03 467,828 71.8 539,627 64.1 -7.7 111,121 17.0 186,890 22.2 5.1
TX-04 540,477 83.0 666,802 78.8 -4.2 50,410 7.7 110,993 13.1 5.4
TX-05 505,283 77.5 523,328 72.1 -5.4 83,113 12.7 157,037 21.6 8.9
TX-06 477,168 73.2 537,602 66.4 -6.8 103,380 15.9 185,397 22.9 7.0
TX-07 505,703 77.6 529,586 67.8 -9.8 117,392 18.0 198,587 25.4 7.4
TX-08 553,472 84.9 686,659 82.4 -2.6 58,820 9.0 128,027 15.4 6.3
TX-09 213,041 32.7 240,882 32.8 1.1 213,195 32.7 310,931 42.4 9.6
TX-10 490,353 75.3 676,833 69.0 -6.3 122,894 18.9 282,641 28.8 9.9
TX-11 523,788 80.4 577,078 81.2 0.8 192,811 29.6 257,633 36.3 6.7
TX-12 505,402 77.5 635,292 76.4 -1.1 154,032 23.6 239,268 28.8 5.2
TX-13 526,737 80.8 544,719 81.0 0.2 114,488 17.6 157,732 23.4 5.9
TX-14 491,492 75.4 588,513 75.5 0.1 162,778 25.0 226,440 29.0 4.1
TX-15 504,686 77.5 674,927 85.7 8.3 506,447 77.7 649,297 82.5 4.8
TX-16 483,295 74.1 620,074 81.9 7.8 507,249 77.8 617,465 81.5 3.8
TX-17 512,489 78.7 585,982 77.1 -1.6 100,241 15.4 157,049 20.7 5.3
TX-18 240,569 36.9 281,511 39.0 2.1 231,548 35.5 313,533 43.5 8.0
TX-19 502,156 77.1 549,589 78.7 1.7 188,932 29.0 235,973 33.8 4.8
TX-20 425,519 65.3 500,530 70.3 5.0 437,800 67.2 509,208 71.5 4.4
TX-21 531,029 81.5 680,337 79.4 -2.1 138,599 21.3 240,713 28.1 6.8
TX-22 464,216 71.2 557,629 61.2 -10.0 132,379 20.3 244,900 26.9 6.6
TX-23 467,321 71.8 672,404 79.3 7.6 423,648 65.1 562,913 66.4 1.3
TX-24 476,428 73.2 488,398 61.6 -11.5 116,586 17.9 214,851 27.1 9.2
TX-25 439,574 67.5 584,962 71.8 4.3 220,942 33.9 315,776 38.8 4.9
TX-26 474,910 72.9 652,345 71.3 -1.6 93,451 14.3 193,973 21.2 6.9
TX-27 495,162 76.0 623,615 84.0 8.1 443,919 68.1 543,306 73.2 5.1
TX-28 518,245 79.6 748,669 87.9 8.3 505,754 77.7 672,129 78.9 1.2
TX-29 357,764 54.9 398,350 58.8 3.9 430,980 66.2 514,861 76.0 9.9
TX-30 238,931 36.6 256,028 36.2 -0.4 223,200 34.2 280,508 39.7 5.5
TX-31 477,328 73.2 647,694 71.8 -1.4 106,121 16.3 195,753 21.7 5.4
TX-32 439,551 67.6 422,818 66.0 -1.5 235,626 36.2 271,442 42.4 6.2

Unfortunately, for some reason, while American Factfinder has “Hispanic or Latino by Race” available for entire states, the only data it currently has available at the CD level is the less precise “Race and Hispanic or Latino.” While that seems like a minor semantic distinction, this means there’s no way to parse out non-Hispanic white (and non-Hispanic black, etc.) for CDs. Bear in mind that “Hispanic,” for Census purposes, isn’t a race unto itself, but a box that gets checked in addition to race. So, while most people who check “Some other race” are Hispanic, not all Hispanics identify as “Some other race;” in fact, more than half of Hispanics identify as “white” (with most of the rest as “some other”) instead. This makes a big difference, in making the sample look whiter than it actually is (at least if one defines “white” in the narrow non-Hispanic sense). At the state level, in 2010, Texas appears as 70.4% white, 11.8% black, and 3.8% Asian in this format, in addition to 37.6% Hispanic. (Considering that adds up to 124%, it’s very confusing. Here, it’s also confusing because it makes districts with an already-large Hispanic majority look like they got even whiter, at the same time as they gained more Hispanics.) So, I’d focus more on the Hispanic column than on the white column in this table, and maybe I’ll revisit this when we get data on non-Hispanic whites.

More data over the flip…

Finally, here are tables for the African-American and Asian populations for each congressional district. While African-American growth is fairly slow (though seemingly faster than growth in non-Hispanic whites), the Asian growth in Texas is just as fast-paced as Hispanic growth (if not faster, in certain suburban districts).

District 2000 black Black % 2010 black Black % % change 2000 Asian Asian % 2010 Asian Asian % % change
TX-01 120,705 18.5 127,714 17.7 -0.9 3,256 0.5 6,487 0.9 0.4
TX-02 124,420 19.1 168,647 21.6 2.5 16,395 2.5 26,501 3.4 0.9
TX-03 59,496 9.1 97,376 11.6 2.4 54,246 8.3 102,783 12.2 3.9
TX-04 67,155 10.3 87,583 10.4 0.1 4,300 0.7 17,420 2.1 1.4
TX-05 80,743 12.4 100,881 13.9 1.5 10,365 1.6 14,086 1.9 0.3
TX-06 83,081 12.7 134,647 16.6 3.9 21,819 3.3 32,795 4.1 0.8
TX-07 36,603 5.6 78,428 10.0 4.4 44,670 6.9 79,224 10.1 3.3
TX-08 56,930 8.7 65,401 7.8 -0.9 5,098 0.8 11,934 1.4 0.6
TX-09 244,295 37.5 262,525 35.8 -1.7 69,533 10.7 79,853 10.9 0.2
TX-10 59,420 9.1 111,799 11.4 2.3 25,383 3.9 57,124 5.8 1.9
TX-11 26,925 4.1 28,410 4.0 -0.1 3,527 0.5 5,222 0.7 0.2
TX-12 36,133 5.5 56,115 6.8 1.2 14,963 2.3 24,464 2.9 0.6
TX-13 36,690 5.6 39,620 5.9 0.3 7,762 1.2 11,586 1.7 0.5
TX-14 63,978 9.8 71,281 9.1 -0.7 10,962 1.7 27,358 3.5 1.8
TX-15 12,020 1.8 12,169 1.5 -0.3 3,588 0.6 6,854 0.9 0.3
TX-16 20,477 3.1 24,499 3.2 0.1 6,946 1.1 8,205 1.1 0.0
TX-17 67,278 10.3 74,834 9.8 -0.5 9,434 1.4 15,071 2.0 0.5
TX-18 263,106 40.4 265,109 36.8 -3.6 21,547 3.3 24,340 3.4 0.1
TX-19 35,845 5.5 39,777 5.7 0.2 5,521 0.8 8,840 1.3 0.5
TX-20 43,738 6.7 51,563 7.2 0.5 9,964 1.5 13,859 1.9 0.4
TX-21 41,027 6.3 57,403 6.7 0.4 16,805 2.6 32,375 3.8 1.2
TX-22 61,165 9.4 129,682 14.2 4.8 50,695 7.8 115,594 12.7 4.9
TX-23 18,617 2.9 29,870 3.5 0.7 6,650 1.0 16,040 1.9 0.9
TX-24 63,194 9.7 117,088 14.8 5.1 39,716 6.1 75,088 9.4 3.3
TX-25 63,750 9.8 64,042 7.9 -1.9 12,146 1.9 18,460 2.3 0.4
TX-26 100,881 15.5 122,856 13.4 -2.1 14,125 2.2 35,991 3.9 1.7
TX-27 17,084 2.6 17,385 2.3 -0.3 5,091 0.8 8,837 1.2 0.4
TX-28 8,178 1.3 13,116 1.5 0.2 3,179 0.5 6,502 0.8 0.3
TX-29 65,414 10.0 68,630 10.1 0.1 8,492 1.3 7,826 1.2 -0.1
TX-30 271,812 41.7 293,203 41.5 -0.2 8,552 1.3 8,848 1.3 0.0
TX-31 84,561 13.0 113,076 12.5 -0.5 14,275 2.2 31,047 3.4 1.2
TX-32 50,833 7.8 54,869 8.6 0.8 26,923 4.1 33,982 5.3 1.2

Growing Republican Strength Along the Rio Grande River?

By: Inoljt, http://mypolitikal.com/

The state of Texas is one of the Republican Party’s most valuable strongholds. It adds a good 38 electoral votes to the Republican candidate’s electoral vote; Democrats have not been competitive in the state for at least a decade.

One of the only Democratic regions in Texas lies along the Rio Grande River:

Photobucket

More below.

This region is the part of Texas that borders Mexico. It is readily apparent in the map above as the only group of blue counties that President Barack Obama won outside of a major city.

The area is one of the most Hispanic areas in the United States; there are places, especially next to the border of Mexico, where the Hispanic percentage approaches 100%. Some of these people have lived along the Rio Grande for hundreds of years, with roots dating back to when Texas was a part of Mexico.

There are several other distinguishing characteristics. The parts of Texas along the Mexican border are among the poorest regions in the United States. Politically speaking, voter turn-out is very low – perhaps lower than any other part of the country.

When the rest of Texas moved steadily Republican, South Texas swung leftwards for much of the twentieth century. In 1996 the Democratic presidential nominee won almost every single county south of San Antonio, some with over 80% of the vote.

Since then, however, Republicans have recovered their verve. President George W. Bush did incredibly well amongst Hispanics in Texas; in 2004 he even won 86% Hispanic Cameron County in the Rio Grande Valley. In 2008 the Democratic presidential candidate once again posted solid numbers along the Rio Grande. Nevertheless, they ran well behind their 1996 performance throughout the region:

Photobucket

(Note: Edited NYT Image)

Compared to 1988 – a year in which the Democratic presidential candidate suffered a resounding national defeat – the 2008 nominee, despite winning a solid national victory, also failed to improve markedly in the Rio Grande area:

Photobucket

(Note: Edited Center For American Progress Image This image can be accessed here.)

Note that in 2008 Democrats lost Texas by 11.8%; in 1988 they lost Texas by 12.6%.

In the 2010 midterm elections Republicans also made several gains in South Texas, winning two heavily Hispanic congressional districts. The first was the 23rd congressional district, which is 65.5% Hispanic; the second the 27th congressional district, which is 71.6% (!) Hispanic.

Photobucket

These patterns are not unique to Texas. In rural south Colorado, for instance, traditionally Hispanic counties have also trended Republican since the 1990s.

Whether the areas of Texas bordering the Rio Grande River will continue moving Democratic or Republican is up-to-question. In Texas, the effects of Mr. Bush’s appeal to Hispanics still are heard; Hispanics in the state are some of the more conservative in the country. The Texas Republican Party has also been relatively moderate on immigration issues. For instance, Republican Governor Rick Perry – a firecracker on other issues – opposes SB 1070.

Needless to say, Republican success at cutting Democratic margins in the counties bordering the Rio Grande would constitute a major achievement for the party.

If a Democrat is ever to win Texas – and none has done so for more than a decade – he or she will need enormous margins there. If Republicans go from 30+% to 40+% of the vote in El Paso or Hidalgo County, it is very difficult to imagine Democrats ever winning Texas.

For more than a decade Democrats have latched onto the Great Hispanic Hope: that growing numbers of Democratic-voting Latinos in Texas will one day turn the state blue. Republican success at winning Hispanics would crush that dream.

Hyper-partisan Democratic Texas Gerrymander

A hyper-partisan Democratic gerrymander of Texas.  Probably not VRA compliant and Texas might even have some laws against such whacked-outness.  However when drawing hyper-partisan maps I like to take “screw the other party over as much as possible and forget the law” approach.  This another full Texas map, the first I drew was before partisan data was available.

The two crowning achievements of this map are the three Democrats out of Travis County (City of Austin), which is something I posted earlier and worked to further perfect, and six Democrats out of Harris County (City of Houston).  

Every Republican seat is a major vote sink, only 4 of the 14 GOP seats are less than 70% McCain.  Which means there are 10 seats that are R+24 or higher including what would be the most Republican district in the country at R+30.

For the sake of classifying districts 59% Obama and higher are labeled as Safe D, 56-58% is Likely D and <56% is Lean D.  There is only one district that is less than 56% Obama than isn’t a GOP vote sink.

Overall this is a 22-14 Democratic Map with one district that could be won by the GOP in a wave year.  So I think the worst case scenario for the Dems would be 21-15

District 13

Obama 23%

McCain 76%

69% White, 6% Black, 22% Hispanic

The most Republican district in the state and probably the most conservative in the country.  Interestingly enough despite being a R+30 district it is 22% Hispanic.

Safe R

District 17

Obama 26%

McCain 73%

67% White, 5% Black, 26% Hispanic

A R+27 West Texas District that is 26% Hispanic.  Includes the cities of Midland, Odessa and San Angelo.

Safe R

District 19

Obama 27%

McCain 72%

67% White, 6% Black, 25% Hispanic

This is a third West Texas district that is over 20% Hispanic.  That definitely doesn’t help in this district.  Includes the cities of Abilene and Lubbock

Safe R


District 4

Obama 31%

McCain 68%

81% White, 8% Black, 8% Hispanic

North East Texas and part of Collin County

Safe R

District 5

Obama 28%

McCain 71%

76% White, 13% Black, 9% Hispanic

Tyler-Longview based district for Louie Gohmert.  Hey we got to keep the most entertaining Republicans right!

Safe R

District 8

Obama 26%

McCain 73%

81% White, 4% Black, 11% Hispanic

Includes most of the very fast growing Montgomery County.

Safe R

District 11

Obama 28%

McCain 71%

74% White, 8% Black, 14% Hispanic

This is my favorite GOP vote sink based on unattractiveness.  It gets all the Republican vote that would have ended up jeporadizing district 10, 31 and 9 if no counties were split.

Safe R

District 14

Obama 29%

McCain 70%

73% White, 6% Black, 17% Hispanic

Another GOP vote sink near Houston.  

Safe R

District 25

Obama 27%

McCain 72%

78% White, 13% Black, 8% Hispanic

East Texas GOP district.  

District 35

Obama 26%

McCain 73%

78% White, 6% Black, 11% Hispanic

Like the rest of the GOP districts, another vote sink carefully drawn.

District 16

Obama 59%

McCain 40%

24% White, 3% Black, 70% Hispanic

Most of El Paso but I also used 16 to grab some of the more Republican counties from district 23 in order to help make 23 more Democratic.

Safe D

District 23

Obama 55%

McCain 44%

27% White, 2% Black, 69% Hispanic

Shedding some of the more Republican counties and picking up part of Southern El Paso shifts this district 4 points towards the Democrats compared to it’s previous 51% Obama/48% McCain breakdown.  In 2010 Conseco beat Rodriguiz by 5 points.

Lean D

District 36

Obama 29%

McCain 70%

80% White, 2% Black, 16 Hispanic

Contains a decent amount of Lamar Smiths current district including the conservative parts of North Bexar County.

Safe R  

District 15

59% Obama

40% McCain

19% White, 1% Black, 78% Hispanic

Most of McAllen and the most Republican parts of Corpus Christi are here.  

Safe D

District 27

Obama 58%

McCain 41%

22% White, 2% Black, 74% Hispanic

Solomon Ortiz’s loss to Blake Farenthold was definitely a sign of a GOP wave.  The old district 27 was 53%/46%.  I would want to rate this district Safe D since Farenthold won by 1 point and the shift by 5 probably would have safed Ortiz, but I’d be breaking break my own rules.

Likely D

District 28

Obama 59%

McCain 41%

19% White, 3% Black, 76% Hispanic

This district shifts a few more points Democratic from his current 56%/43% district.  It was difficult to get a good image capture of this district since it is drawn like it is.

Safe D

District 20

Obama 58%

McCain 41%

30% White, 5% Black, 61% Hispanic

I tried so hard to get two 59% Obama districts in San Antonio and just couldn’t do it.  58% is really close and as much as I want to label this a safe D district I can’t since my intro says 59% will be considered a safe D district.

Likely D

District 21

Obama 58%

McCain 41%

33% White, 10% Black, 54% Hispanic

Eastern San Antonio and southern Bexar county.  

Likely D


I would have zoomed in more but that would have cut off several of the districts originating from Houston.

District 2

Obama 59%

McCain 40%

36% White, 26% Black, 33% Hispanic

Very Democratic part of North Houston and the Democratic parts of Huntsville in East Texas

Safe D

District 7

Obama 59%

McCain 40%

35% White, 24% Black, 30% Hispanic, 11% Asian

District 9

Obama 59%

McCain 41%

38% White, 27% Black, 23% Hispanic, 12% Asian

Stretches from Galveston up into Brazos County, most of the Democratic vote is in Fort Bend.  Interesting note is this district is 12% Asian

Safe D

District 18

Obama 59%

McCain 40%

39% White, 25% Black, 28% Hispanic

South and West Houston district.

Safe D

District 22

Obama 60%

McCain 40%

39% White, 32% Black, 26% Hispanic

The most Democratic district partially in Houston also includes Beaumont, Port Arthur, Hudson and Nacodoches.  

Safe D

District 29

Obama 59%

McCain 40%

29% White, 10% Black, 57% Hispanic

A good piece of Green’s current district is in the new 29, he should have no problem winning here.

Safe D


Like Houston I had to take this photo to account for the sprawly districts

District 10

Obama 60%

McCain 39%

52% White, 6% Black, 38% Hispanic

This district includes most of Lloyd Doggetts current district in South Austin and it sort of stretches all the way down into South Texas.  

Safe D

District 31

Obama 58%

McCain 40%

47% White, 24% Black, 25% Hispanic

Squeezing a third Democratic district out of Travis County was great.  This district includes parts of Travis County, Waco, Killeen, Temple, College Station

Likely D

District 33

Obama 59%

McCain 40%

67% White, 7% Black, 19% Hispanic

Most of Austin is in this district including Round Rock.

Safe D

District 3

Obama 60%

McCain 38%

39% White, 18% Black, 38% Hispanic

The most Democratic district in the state with Obama winning by a 22 point margin.  It loops around the very conservative Park Cities and Preston Hollow area of Dallas County

District 12

Obama 59%

McCain 40%

45% White, 21% Black, 29% Hispanic

Contains much of the City of Fort Worth.  I’d like to see Lon Burnam run in this one.  He’s a very liberal State Representative in Fort Worth.

Safe D

District 24

Obama 59%

McCain 40%

53% White, 18% Black, 21% Hispanic

Contains the Democratic parts of Arlington in Tarrant County and Southwest Dallas County.   The college town Denton is also roped into the district.

Safe D

District 30

Obama 60%

McCain 39%

40% White, 19% Black, 35% Hispanic

Mostly West Dallas including southern parts of the city and Democratic pieces of Collin/Denton County

Safe D

District 32

Obama 60%

McCain 39%

45% White, 28% Black, 21% Hispanic

South Dallas and some eastern Dallas suburbs including Garland.  I think Eddie-Bernice Johnson would run in this one.

Safe D

Well it happen?  No, but a Democrat can dream 🙂

TX Redistricting 20R-16D Map

Never done a map, so I thought why not.

First, I have no illusions that there is anyway a map that would have the chance to elect 16 Democrats would ever pass the current legislature, let alone survive a veto by Rick Perry.

I just wanted to see if i could a map that had districts that were a little more compact.

Let me just say that I threw out most of the current map and renumbered the districts and probably ended up redistricting a lot of current reps out of their districts.  

I also threw out the old numbers. I just have this pet peeve about numbering.  I hate to have district 1 and then district 2 on the other side of the state.  You can pretty much follow a trail from NE TX to SE TX, over to Houston, down the coast to the border, up to San Antonio, then Austin, then to El Paso, up to the Panhandle and south, then over and north into DFW.

Photobucket

TX-1, Safe Republican

Blue, NE corner of the state.

76% White, 16% Black, 7% Hispanic, 2% Asian

70% McCain/29% Obama

I think I redistricted Louie Gohmert out of this district and into the 2nd, which contains most of his old district.

TX-2, Safe Republican

Green, east Texas

73% White, 16% Black, 9% Hispanic, 1% Asian

70% McCain/29% Obama

TX-3, Safe Republican

Dark Magenta, SE corner of the state.

63% White, 21% Black, 13% Hispanic, 3% Asian

59% McCain/41% Obama

I gave the Golden Triangle (Beaumont, Port Arthur, & Orange) it’s own district.  I redistricted Ted Poe out of this district.  Although it’s a 60-40 district, I think someone like Nick Lampson could have a chance in it since it contains both Beaumont and Galveston.

Photobucket

TX-4, Safe Republican

Red, just north of Harris County (Houston)

77% White, 13% Hispanic, 8% Black, 2% Asian

73% McCain/26% Obama

Although it has less population than the other districts, it’s a fast growing area that will likely grow.  I also figured why not give the Houston suburbs their own district.

TX-5, Safe Republican

Gold

67% White, 15% Hispanic, 11% Black, 6% Asian

62% McCain/37% Obama

As Houston expands, this area may get more Democratic.  I don’t live in the Houston area, so I can’t say for certain.

TX-6, Safe Democratic

Teal

Majority-Minority

37% Hispanic, 33% White, 24% Black, 6% Asian

60% Obama/40% McCain

TX-7, Lean Democratic

Dark Gray

Majority-Minority

41% Hispanic, 40% White, 14% Black, 4% Asian

51% Obama/48% McCain

TX-8, Likely Republican

Slate Blue

Majority-Minority

47% White, 40% Hispanic, 9% Black, 4% Asian

56% McCain/43% Obama

TX-9, Safe Democratic

Cyan

Majority-Minority

33% White, 31% Hispanic, 29% Black, 6% Asian

67% Obama/32% McCain

TX-10, Likely Democratic

Deep Pink

Majority-Minority

34% White, 26% Hispanic, 26% Black, 14% Asian

55% Obama/45% McCain

TX-11, Likely Republican

Chartreuse

56% White, 22% Hispanic, 14% Black, 8% Asian

56% McCain/43% Obama

TX-12, Safe Republican

Cornflower Blue

59% White, 28% Hispanic, 9% Black, 3% Asian

65% McCain/34% Obama

Ron Paul gets to keep his seat.  This district combines most of the current 14th and 25th CDs.

TX-13, Lean Democratic

Dark Salmon

Majority-Minority

70% Hispanic, 26% White, 2% Black, 2% Asian

54% Obama/45% McCain

Although it’s a lean Democratic district, the right Democratic shouldn’t have trouble holding it.  This district takes in Corpus Christi and Brownsville.

TX-14, Safe Democratic

Olive

Majority-Minority

86% Hispanic, 13% White, 1% Asian

67% Obama/32% McCain

A border district, easy hold.

TX-15, Safe Democratic

Dark Orange

Majority-Minority

88% Hispanic, 10% White, 1% Asian

68% Obama/31% McCain

This district is anchored by Laredo.  Henry Cuellar gets to keep his job.

TX-16, Safe Democratic

Lime

Majority-Minority

71% Hispanic, 20% White, 7% Black, 2% Asian

66% Obama/33% McCain

Encompasses most of San Antonio.  Charlie Gonzalez gets to keep his job.

TX-17, Toss Up

Dark Slate Blue

Majority-Minority

50% Hispanic, 41% White, 5% Black, 3% Asian

50% Obama/49% McCain

This would be my new district.  I took in more of San Antonio and Bexar County and was able to cut down the size of this district.  Rather than stretching to El Paso, it now only goes to Del Rio.  In addition to cutting down the size, I also cut out a lot of the Republican areas in northern Bexar County that really came out in 2010 (such as Fair Oaks Ranch and Stone Oak).  Ciro Rodriguez could probably win this district.

TX-18, Safe Republican

Yellow

64% White, 26% Hispanic, 7% Black, 3% Asian

62% McCain/37% Obama

Democrats in the NE part of Bexar County won’t like it, but I made Lamar Smith’s district much more Republican.  I took those Republican areas from Ciro’s old district (haven’t gotten used to having Canseco yet) and gave them to Lamar Smith.  Austin Democrats should love this district because no longer do they have to deal with Lamar Smith.

TX-19, Safe Democratic

Lime Green

56% White, 30% Hispanic, 8% Black, 6% Asian

68% Obama/30% McCain

Here’s another reason Austin Democrats should love this map…Austin gets its own district.  Welcome back to a compact district Lloyd Doggett.

TX-20, Toss Up

Pink

65% White, 23% Hispanic, 8% Black, 4% Asian

50% Obama/49% McCain

Thanks to Travis, Bastrop, and Hays Counties, this district is a toss up and may continue in the Democratic direction.

TX-21, Safe Republican

Maroon, West Texas and Border

57% White, 38% Hispanic, 3% Black, 2% Asian

71% McCain/28% Obama

This district combines a lot of the current 23rd as well as the current 11th.  This district is dominated by San Angelo, Midland, & Odessa.

TX-22, Safe Democratic

Sienna

Majority-Minority

76% Hispanic, 18% White, 3% Black, 2% Asian

65% Obama/34% McCain

Silvestre Reyes gets to keep his El Paso district.

TX-23, Safe Republican

Aquamarine, Panhandle

66% White, 26% Hispanic, 6% Black, 2% Asian

74% McCain/25% Obama

Republicans keep breaking up Austin, so I thought I’d combine Amarillo and Lubbock and let them fight over one district.

TX-24, Safe Republican

Indigo, West Texas

70% White, 22% Hispanic, 6% Black, 2% Asian

74% McCain/25% Obama

Abilene is the biggest city here.  Charlie Stenholm might have been able to win this district.

TX-25, Likely Republican

Pale Violet Red

69% White, 16% Hispanic, 11% Black, 4% Asian

55% McCain/43% Obama

North of Austin it takes in Williamson County and Killeen.

Photobucket

TX-26, Safe Republican

Gray

67% White, 16% Black, 14% Hispanic, 2% Asian

66% McCain/33% Obama

Waco is the predominant city here.

TX-27, Safe Republican

Red

86% White, 9% Hispanic, 3% Black, 2% Asian

75% McCain/25% Obama

TX-28, Likely Republican

Dark Green

64% White, 24% Hispanic, 8% Black, 4% Asian

57% McCain/42% Obama

Western Tarrant County/Fort Worth.  Depending on where she resides, this district could be ripe in some years for a Congresswoman Wendy Davis.

TX-29, Lean Democratic

Dark Sea Green

54% White, 21% Black, 18% Hispanic, 6% Asian

53% Obama/47% McCain

SE Tarrant County/Fort Worth and Arlington.  If Wendy Davis wanted a better district right away, she could choose this one.

TX-30, Safe Republican

Yellow

80% White, 9% Hispanic, 5% Asian, 5% Black

65% McCain/34% Obama

TX-31, Safe Republican

Khaki

76% White, 11% Hispanic, 7% Asian, 6% Black

60% McCain/39% Obama

TX-32, Likely Republican

Cyan

67% White, 14% Hispanic, 11% Asian, 8% Black

57% McCain/42% Obama

TX-33, Safe Republican

Dark Goldenrod

78% White, 12% Hispanic, 7% Black, 2% Asian

69% McCain/30% Obama

TX-34, Toss Up

Lime Green

Majority-Minority

47% White, 35% Hispanic, 11% Black, 7% Asian

50% Obama/49% McCain

As Dallas goes more Democratic, so should this district.

TX-35, Toss Up

Dark Orchid

53% White, 27% Hispanic, 15% Black, 4% Asian

50% Obama/49% McCain

Second verse, same as the first.

TX-36, Safe Democratic

Orange

Majority-Minority

41% Black, 31% Hispanic, 26% Black, 2% Asian

80% Obama/20% McCain

Democratic Gerrymander of Austin – GOP smackdown

Everyone who gerrymanders knows about the infamous GOP cracking of Austin during the GOP gerrymander of Texas.  If the Democrats magically got control of the state House, state Senate and Governorship they would be out for blood over the GOP mid-decade gerrymander

Time for the GOP’s turn to cry over a gerrymander of Austin!

CD-10

Obama 59%

McCain 40%

White 55% Black 6% Hispanic 35%

Since Doggett’s District has grown by over 120,000 people in the past 10 years it has been easy to make it more compact by removing several of the conservative counties, some of Austin was also removed to make room for the other districts.  Austin comprises the majority of the population, but San Marcos and Seguin are also in the district.  The PVI remains the same as Doggett’s old district.  If he can win with an 8 point margin in one of the worst years for Democrats in decades this new district should be no problem.  

Safe Democrat

CD-33

Obama 60%

McCain 39%

White 65% Black 8% Hispanic 20%

Clearly most of Austin is in this new district.  It is 2 points more Democratic than Doggett’s district and includes Round Rock and Georgetown in addition to the majority of Austin.  Again the massive population growth in Austin made this district possible.  Not much else to say on this one.

Safe Democrat

CD-31

Obama 56%

McCain 43%

White 52% Black 21% Hispanic 21%

As if two safe Democratic districts weren’t bad enough a third district including parts of Austin, Waco, Killeen/Temple and College Station/Bryan.  This is the crown jewel of this gerrymander.  This district is beautifully drawn for one reason, to get the GOP angry. I couldn’t quite make this district Democratic enough to be a safe Democratic Seat, but it is definitely winnable, toss-up at worst and lean D at best.

Lean D/Toss-Up

Texas 25R-9D-2 Non-Dummymander

Redistricting Texas was a bit of a chore.  To do this with an eye to how the GOP legislature might do so requires balancing a number of considerations.  These are at loggerheads with each other to some degree:

(1) A desire to protect new GOP incumbents Farenthold and Canseco;

(2) A desire to shore up increasingly vulnerable GOP incumbents in TX-10, TX-24 and TX-32

(3) Compliance with the VRA.

First, a primer on the VRA.  It does not require that a state with a 38 percent population have 38 percent of its districts be Hispanic opportunity districts.  It doesn’t necessarily require any.

Instead, it requires only that distinct populations be given a reasonably compact district if it is possible to draw one.  This is a problem in Texas, where the Hispanic population is fairly subsumed within the anglo and African American populations.  West Texas has a fairly large Hispanic vote, but it is impossible to create anything approaching a minority majority district there — in fact, almost all of these districts have at least a 15% Hispanic population, but they can’t be used to draw a compact district. In the 2006 Texas redistricting litigation, the district court found that Texas could support only 6 Hispanic opportunity districts (although I counted 7).  I don’t think it has increased all that much recently.

There’s a second complication in Texas, which is that there’s a difference between the population and the voting population.  Both undocumented and documented workers count for census purposes, even though neither can vote.  In Texas this creates a substantial discrepancy between the numbers shown by census voting-age population (VAP), and the Citizen Voting Age Population (CVAP).  Throw in lower turnout among hispanics in general, and it gets very difficult to draw VRA districts.

The basic theory behind the map, therefore, is as follows.  Keep all the present Hispanic opportunity districts as close to the current lines as possible.  Anything that’s around 60 percent Hispanic should be an Hispanic opportunity district (the district Court in 2006 seemed to accept that TX-25 would be an Hispanic opportunity district with 55% Hispanic population; it was struck down because it was not sufficiently compact to count as a VRA district).  If you can keep the white vote below 30% or so, that can change, although an African American population that starts to approach the Hispanic population can overwhelm it in a Dem primary.

I created something looking like an Hispanic opportunity district in the DFW area.  To illustrate just how difficult this is, you’ll note that this and the 30th are now awfully close to electing an Anglo Democrat, and these lines are pretty convoluted.  It may well be that the VRA doesn’t require any additional minority-majority districts in Texas, although drawing close to one in DFW is a good idea for shoring up GOP incumbents.

A few other notes.  I didn’t know exactly where Blake Farenthold lived, so I drew his new district to where Farenthold Consulting was located.  The baconmander of Dallas county is avoidable with precise locations for the incumbents; because I didn’t want to draw two Congressmen together, I kept the Dallas portions of their old districts more-or-less intact.

The centerpiece of the map is the 8-way split of Austin.  I don’t know where Lloyd Doggett lives and I don’t think it matters; he runs in a 58 percent McCain district no matter what.

I have to say, given what I did, I was pleasantly surprised that the districts look as regular as they do.  It might actually look better than the current map . . .

Without further adieu…

Photobucket

(1, Gohmert) 31% Obama/68% McCain, 70W/17B/11H (old 31O/69M, 68W/18B/13H) — Gohmert’s district goes further South now, but retains the Tyler base.  Without the Dallas Baconmander, it could be made more compact.

Photobucket

(2, Poe) 40Obama/60McCain, 61W/13B/22H (old 40O/60M, 57/21/18) — This district grew 14 percent and has to shrink — it is now contained almost entirely within Harris County.  A leg goes down to Galveston and Texas City to take Democratic votes from the 14th to offset the votes that district gains in Austin (cue ominous foreshadowing music).

Photobucket

(3, Johnson) 40Obama/59McCain, 65W/11B/16H (old 42O/57M, 56/10/21) — This baconmander would be avoidable if I knew where Johnson resided (even better if he retired . . .).  For now, it takes in its old portion of Dallas, and then extends out to rural North Texas.  It is made slighly more Republican.

(4, Hall) 30O/70M, 75W/16B/7H (old 30/69, 75/10/11) — Because of the situation with the Third district, this has to be pretty grotesque.  This one is also much easier if Hall retires, or with his precise location (as that would allow using some of Rockwall to shore up the third without putting it out in N Texas, which in turn would allow the 4th to keep its old shape.

(5, Hensarling) 39O/61M, 69W/13B/14H (old 36/63, 65/13/19) — Hensarling’s district doesn’t change all that much, though due to population growth it loses some heavily Republican rural portions.  Still, he should have a nice home for the rest of the decade.

(6, Barton) 37O/63M, 68W/12B/15H (old 40O/60M, 58/15/21) — Normally I wouldn’t have shored up a district, but Barton is a bit, um, controversial, so I thought he would want to know that his district would be safe through 2020.

(7, Culberson) 40O/59M, 62W/6B/24H (old 41O/58M, 59/8/23) — This district retains much of its old territory.  I made it a touch more Republican.  I figured if Culberson got 56% of the vote while being outspent 2-1 in 2008, he was going to be pretty safe.  My first time through I had this at 61 percent, but then my computer crashed before I wrote it up.  So this could be improved.

(8, Brady) 31O/68M, 74W/6B/14H (old 26O/72M, 77/9/12) — This district is now entirely within Harris and Montgomery Counties, which should make Brady happy.  It’s a bit more Democratic, but I don’t think he’ll notice.

(9, Green) 74O/26M, 19W/34B/34H (old 77/23, 14/36/40) — Al Green’s district expands to pick up some more African American voters, and sheds some white voters to the 7th.  Not much change here.

Photobucket

(10, McCaul) 40O/59M, 62W/12B/21H (old 44/55, 59/10/25) — McCaul is one who could use some help — although in a terrible Republican year he beat back a stiff challenge handily.  His district gets some more Houston suburban lovin’, which ratchets it up a few notches.

(11, Conaway) 41O/59M, 64W/6B/26H (old 77M/24O, 61/4/33) — This district retains its Midland base, but picks up a chunk of Austin to become quite a bit more Dem.  Still — and this is important to remember for the rest of the map — 59%McCain is still roughly R+13, which should be enough to win throughout the decade.

(12, Granger) 35O/64M, 79W/4B/11H (old 36/63, 63/6/27) — Not a lot of changes here; drops some of its minority population to create the new 33rd.

(13, Thornberry) 23O/76M, 69W/6B/23H (old 23/76, 70/6/21).  Not much you can do here — the district is Amarillo, and there isn’t another Democratic hub within 500 miles of the place.  Note, however, that the district is a quarter Hispanic.  This is what I’m talking about re the problems of creating Hispanic majority districts here.  

(14, Paul) 41O/58M, 57W/8B/32H (old 33O/66M, 59/9/27) Paul gets a chunk of Austin as well.  It is a more Democratic district, but he should still be able to win pretty handily.

Photobucket

(15, Hinojosa) 66O/33M, 13W/0B/85H (old 60/40, 17/2/80) — This district has grown a lot, and so it shed some of the anglo counties to the north.  Hinojosa actually had a bit of a close call in ’10, but that won’t happen again in this district.

(16, Reyes) 68O/31M, 15W/3B/81H (old 66O/33M, 14/3/81) — No big changes here.

(17, Flores) 35O/64M, 67W/15B/15H (old 32O, 67M, 69/10/18) — This district is a bit more Democratic, but its a ton of new territory, which should prevent a Chet Edwards comeback.

(18, Jackson Lee) 83O/16M, 19W/51B/26H, (old, 77O/22M, 16/38/42) — The original Texas minority-majority district, it sees its African American percentage increased substantially, as it shed white voters to the 7th and Hispanics to the 29th.

(19, Gonzales) 66O/33M, 22W/9B/66H (old 63/36, 21/6/70) — I switched the 19th and 20th, because I’m colorblind and was having troubles with the 19th and 23rd.  This gives up some population to the 28th, which allowed me to do an ugly gerrymander that shored up the 21st to compensate for getting parts of Austin.

(20, Neugebauer) 27O/72M, 67W/6B/24H (old 27O, 72M, 61/5/32) — Again, not much you can do with these voters.  In theory you could put this one into Travis County as well, but that would be greedy.  Also, note the 32 percent Hispanic population.

I really should have broken this into two pieces.

(21, Smith) 40O/58M, 70W/3B/23H (old district 40O/59M, 63W/7B/26H) — Smith never had any troubles in his old district, so the addition of the Austin territory shouldn’t hurt him.  It’s not downtown Austin, so we’re not talking heavily Dem stuff.

(22, Olson) 41O/58M, 60W/9B/22H (old district 41O/58M, 51W/13B/24H) — this gets some of Austin as well.  But unless Olson gets himself indicted for money laundering and the GOP runs a write-in candidate with a hyphenated last name, he should be ok.

(23, Canseco) 47O/52M, 36W/2B/60H (old district 51O/48M, 29W/3B/66H) — I think this is testing the outer limits of what you can do and still comply with the VRA here.  It should still be considered an Hispanic opportunity district though, although one that leans more to the right.  In a bad GOP year, it will probably elect a Democrat.

(24, Marchant) 38O/61M, 68W/6B/18H (old district 44/55, 53/12/25) — Marchant is another big winner from the creation of the 33rd.  A substantial increase in Republican performance here.

(25, Ducky) 43O/56M, 61W/5B/31H (old district 59O/39M, 51W/9B/37H) — A small sliver into Corpus connects Farenthold to what is essentially a new South-Central Texas district.  I would have liked to have gotten the GOP percentage up a few more notches, since he is so weak, but it just isn’t feasible.  This doesn’t go much into downtown, so I don’t think I picked up Dogget’s residence.

(26, Burgess) 37O/62M, 77W/6B/11H (old district 41O/58M, 62/13/19) — Burgess is another Dallas winner.  his district has seen massive growth, so this is quite a bit more compact.  He loses quite a bit of minority population to the 33rd.

(27, open) 53O/46M, 27W/2B/69H (old district 53O/46M, 25W/2B/71H) — Since the old district elected a very weak Republican once, I figured that I should keep it more-or-less intact if possible, on the off chance that it might do so again.  The only real change is that a few rural precincts are added, and three Corpus precincts are put into the 25th.

(28, Cuellar) 70O/30M, 11W/3B/85H (old district 56O/44M, 19W/1B/79H) — This district gets a bigger chunk of Hispanic voters in San Antonio who are apparently MUCH more reliable Democratic votes than those on the border.  Cuellar may actually not be able to survive here.

(29, Green) 63O/36M, 20W/10B/67H (old district 62O/38M, 16/10/72) — This remains an Hispanic opportunity district, which would probably still elect an Anglo Democrat.  Again, this illustrates just how tough it is to really create a Hispanic opportunity district here.

(30, Johnson) 79O/21M, 26W/44B/27H (old district 82/18, 17/39/41) — This district has to become quite a bit whiter in order to help make the 33rd.  Still, Johnson should win the primary and the general.

(31, Carter) 40O/58M, 71W/7B/18H (old district 41/57, 63/12/19) — Carter gets a little boost in Republican performance, but he was never really in any jeopardy in the first place.

(32, Sessions) 40O/59M, 69W/6B/19H (old district 46/53, 44/8/42) — After a relatively close shave against a weak opponent in 2008, Sessions gets a big boost from creating the 33rd.  It is a bit ugly; in reality if I knew where Johnson and Hall lived, I’d probably push it more into the 3rd, push the 3rd more into the 4th, and have the 4th get a lot of this northern Collin County territory.  But I might inadvertantly put those guys in the same district, so you get what you get.

(33, new) 71O/29M, 25W/21B/50H Minority-majority district.  Its ugly, and it still might elect a white Democrat.  But its the best you can do and even if the GOP doesn’t HAVE to draw it, it will probably still try to do so to shore up the other Reps.

(34, new) 39O/60M, 67W/11B/18H

(35, new) 35O/63M, 78W/5B/11H

(36,new) 37O/62M, 66W/17B/13H